
Abstract
Using Moderate Resolution Imaging Spectroradiometer (MODIS) 500 m spatial resolution global water product data, Least Squares Method (LSM) was applied to analyze changes in the area of 14 lakes in Central Asia from 2001 to 2016. Interannual changes in lake area, along with seasonal change trends and influencing factors, were studied for the months of April, July and September. The results showed that the total lakes area differed according to interannual variations and was largest in April and smallest in September, measuring −684.9 km2/a, −870.6 km2/a and −827.5 km2/a for April, July and September, respectively. The change rates for the total area of alpine lakes during the same three months were 31.1 km2/a, 29.8 km2/a and 30.6 km2/a, respectively, while for lakes situated on plains, the change rates were −716.1 km2/a, −900.5 km2/a, and −858 km2/a, respectively. Overall, plains lakes showed a declining trend and alpine lakes showed an expanding trend, the latter likely due to the warmer and wetter climate. Furthermore, there was a high correlation (r = 0.92) between area changes rate of all alpine lakes and the lakes basin supply coefficient, although there was low correlation (r = 0.43) between area changes rate of all alpine lakes area and glacier area/lake area. This indicates that lakes recharge via precipitation may be greater than lakes recharge via glacier meltwater. The shrinking of area changes for all plains lakes in the study region was attributable to climate change and human activities.
Introduction
Lakes have a strong influence on both human beings and the ecological environment, providing water for local residents, developing fishery production, and playing an important role in agricultural irrigation1,2,3. Lake can also provide the necessary water conditions for vegetation in arid areas where precipitation is scarce and the ecosystem is fragile. As a geographical element in the arid region, lakes expansion or shrinkage are essential to agricultural development and the health of the plant and animal ecosystems inside and outside lake, such that land desertification and salinization in arid areas are severely impacted by lake area shrinkage2,4. Furthermore, the size of a lake exerts a regulating effect on the climate in the surrounding area5 by increasing or decreasing local air humidity and thus affecting precipitation in the lake basin. Therefore, it is critical not only for the development of socioeconomic status of countries in Central Asia but also for their ecological environmental protection to study variation of lakes area and analyze internal driving factors contributing to those changes.
Central Asia is situated inland region from Eurasia (Fig. 1) and includes Kazakhstan, Tajikistan, Kyrgyzstan, Turkmenistan, Uzbekistan, and China’s Xin Jiang Province6. The region is characterized as arid and semi-arid, and the climate is mostly controlled by westerly air circulation. Annual precipitation in Central Asian countries varies greatly from region to region. In the windward (western) side of the Tianshan Mountains, precipitation amounts can top 2,000 mm annually, while in the desert side, precipitation levels are typically less than 100 mm7.Since the 1970 s, temperatures across Central Asia have shown an obvious rising trend of 0.368 ~ 0.428 °C/10 a6,8, which is higher than the current global average warming level. Overall, the vast region generally suffers from scarce water resources and a fragile ecological environment9,10. The largest water bodies of Central Asia are Aral Sea, and Issyk-kul Lake, Balkhash Lake (Table 1).

Location of the study area. (Generated by ArcGIS 10.2, URL: http://www.esri.com/sofware/arcgis/arcgis-for-desktop).
In most cases, lake area change is the result of the combined action of climate change and human activities2,3,11,12,13,14,15,16. Climate change (e.g., changes in temperature and precipitation) directly impacts water cycle changes in a lake basin, while human activities (e.g., agricultural irrigation) can change the water cycle process in a lake system. In the context of global warming, the warming rate in Central Asia is higher than the average global warming rate8, which may promote the evaporation of the lake surface. The warming also speeds up the melting of glaciers and snow and brings the melting period forward.
In the plains region of Central Asia, changes in precipitation can cause changes in river runoff, which in turn can impact lake inflow and lake recharge and contribute to lake area expansion or shrinkage. Human activities such as irrigated agriculture consume water resources mostly in the form of evaporation and loss, which then directly affects lake area changes. Central Asia is a typical arid and semi-arid region in the inland temperate zone. Due to low levels of precipitation in this region, snow cover and glacier meltwater are important sources for lake water recharge. However, both snow and glacier cover are currently experiencing a shrinking trend due to changes of climatic factors.
Jing et al.17 extracted 12 lakes areas with a combined water index with MOD09A1 dataset in different seasons (April, July and September) in the year 2005–2015, but that only nearly 10-years long. Klein et al.2 used AVHRR and MODIS sensors to derive inland water bodies extents over a period from 1986 till 2012 for the region of Central Asia for the months of April, July and September. Tan et al.3 used MODIS NDVI data to extract areas of 24 lakes along the Silk Road (including some lakes of Central Asia) and analyze their spatial-temporal characteristics, but that only with annual mean lake area without seasonal changes. Li et al.18 also used Modis NDWI datasets to extract 9 lakes to analyze seasonal and inter-annual changes from 2001 to 2016, and the number of lakes was scarce. This paper used 14 lakes to analyze seasonal and inter-annual changes of 14 closed lakes with Modis product datasets.
Some studies have been conducted on changes in lake area, but most of the research was carried out within limited time frames4,19. Some images (eg. Landsat remote sensing images) have been used to obtain lake areas at a given moment for many times16,20, the lake area at a given moment indicates the area of the lake in a particular period, the lake area captured at a given point in time is insufficient to reflect inter-annual and annual variations because of the possible fluctuations of the lake area in the short term3. For example, one observation represents lake area for a year, thus lack of high temporal resolution (i.e., observing the lake area several times a year), and ignored annual seasonal changes affecting the lakes. Annual changes such as inundation and drought can cause a water body to fluctuate in area within a short time, resulting in significant impacts to the surrounding ecological environment. Currently, the data on lakes situated in arid regions do not fully reflect the variations in characteristics caused by annual changes to water surface area3, so the research which includes high temporal resolution is urgently required21. This paper studies the changes in lake water area in April, July and September in Central Asia and provides decision-making suggestions for water resource management and ecological environment maintenance for the impacted lakes.
In this paper, considering that the open lakes were highly regulated by reservoirs, we mainly considered closed lakes. The change of lakes water area in Central Asia was mainly affected by larger lakes, so this paper chose the main typical lakes (larger than 200 km2) in Central Asia, including 7 alpine lakes and 7 plain lakes. This paper contained all the great closed lakes in Central Asia except for the Caspian Sea, therefore, closed lakes larger than 200 km2 were selected as research objects.
Results
Temporal variation of lake area
For the years 2001 to 2016, the total area of the 14 lakes under study (Fig. 2a) was the largest in April, followed by July and September. The change rate for the total area of the lakes was −684.9 km2/a, P < 0.01, R2 = 0.63 in April, −870.6 km2/a, P < 0.05, R2 = 0.85 in July, and-827.5 km2/a, P < 0.01, R2 = 0.80 in September. The lake area decreased the fastest in July, followed by the area change rate in September. The area change rate in April was the lowest.

The total area change of all lakes, alpine lakes and plain lakes. (a) Total lakes area; (b) All alpine lakes area; (c) All plain lakes area). (Generated by Matlab 2018a, URL: http://cn.mathworks.com/products/matlab/).
The change in total area of alpine lakes for the months of April, July and September (Fig. 2b) was largest in April, with little difference in the area during July and September. From 2001 to 2016, the change rate of the total area of the lake was 31.1 km2/a, P < 0.01, R2 = 0.84 in April, 30.6 km2/a, P < 0.05, R2 = 0.94 in July, and 29.8 km2/a, P < 0.01, R2 = 0.87 in September. The lake area increased the fastest in April, followed by the area change rate for July. The area change rate was the lowest in September.
The change in total area of lakes located in the Central Asian plains regions for the months of April, July and September (as shown in Fig. 2c) was the largest in April and the smallest in September. From 2001 to 2016, the change rates of the total area of the lakes in April, July and September were −716.1 km2/a, −900.5 km2/a, and −858 km2/a, with significance levels of P < 0.05 and R2 of 0.65, 0.86 and 0.81, respectively. The lake area decreased the fastest in July, followed by the area change rate for September. The area change rate was the lowest in April.
Figure 3 shows the average lake area for April, July and September as being the lake area for the entire year. From 2001 to 2016, the alpine lake area was either stable or expanding (Fig. 3, Table 2). For example, the area of Issyk-kul Lake was stable and did not pass the significance test level of P < 0.05. However, other lakes did pass the significance test level of P < 0.01. The annual change rates of Sai li-mu Lake and Karakul Lake were 0.21 km2/a and 0.81 km2/a, respectively. The change rates of Alakol Lake, Ayakkum Lake, Aqikkol Lake and Arkatag Lake were larger, ranging from 2.94 km2/a to 13.03 km2/a. According to Table 2, the seasonal variation rates of Aqikkol Lake, Arkatag Lake, Karakul Lake and Ayakkum Lake were 1.21, 1.27, 1.16 and 1.14, respectively, which were relatively large. On the other hand, the seasonal variation rates of Issyk-kul Lake, Sai li-mu Lake and Alakol Lake were 1.00, 1.07 and 1.03, respectively, indicating afairly small seasonal variation.

Interannual area variation of alpine closed lake in Central Asia in April, July and September from 2001 to 2016. (Generated by Matlab 2018a, URL: http://cn.mathworks.com/products/matlab/).
During the period under study, the area of plains lakes notably varied (Table 2 and Fig. 4). For example, the South Aral Sea, Ebi Lake and Tengiz Lake decreased, with the South Aral Sea and Ebi Lake passing the significance test of P < 0.001 and P < 0.05 and showing reduction rates of −846.47 km2/a and −7.30 km2/a, respectively. Conversely, the North Aral Sea, Sarygamysh Lake, Ulungu Lake and Balkhash Lake all exhibited an upward trend. Of these water bodies, the North Aral Sea and Sarygamysh Lake passed the significance test of P < 0.001 and showed increasing rates of 25.74 km2/a and 11.32 km2/a, respectively. According to Table 2, the seasonal variation rates of the South Aral Sea, Tengiz Lake and Ebi Lake were 1.99, 1.71 and 1.45, indicating that the seasonal variation rates of these lakes were relatively large, whereas the seasonal variation rates of Balkhash Lake, Sarygamysh Lake, Ulungu Lake and the North Aral Sea were 1.03, 1.03, 1.08 and 1.13, respectively, indicating little seasonal variation. Generally speaking, the seasonal variation rates of lakes on the Central Asian plains were larger than alpine lakes in the same region.

Interannual area variation of plain closed lake in Central Asia. in April, July and September from 2001 to 2016. (Generated by Matlab 2018a, URL: http://cn.mathworks.com/products/matlab/).
The present study used Aqqikol Lake and Alakol Lake (Fig. 5a,b), along with Tengiz Lake and the North Aral Sea and South Aral Sea (Fig. 5c,d) as examples of seasonal variation of lakes. For April, July and September from 2001 to 2016, the seasonal variation of the alpine lakes Aqqikol Lake and Alakol Lake and North Aral Sea was not significant, whereas that of Tengzi Lake and South Aral Sea were quite significant. Specifically, the seasonal variation ratios were as follows: South Aral Sea 1.99; Tengiz Lake 1.71; North Aral Sea 1.13; Aqikkol Lake 1.21; and Alakol Lake 1.03. These ratios indicated that the seasonal variation map of lake dynamics was consistent with the seasonal variation ratio of the lakes (Table 2).

Lakes season dynamics of April, July and September from 2001 to 2016. (a) Aqqikol Lake, (b) Alakol Lake, (c) Tengiz Lake, and (d) South Aral Sea and North Aral Sea (Generated by ArcGIS 10.2, URL: http://www.esri.com/sofware/arcgis/arcgis-for-desktop).
Analysis of factors influencing lake area change
Seven alpine lakes in the study area experienced an average warming rate of 0.053 °C/a, with the exception of Karakul Lake (Fig. 6a, Table 3). Precipitation also charted a general upward trend, (with the exception of Karakul Lake), with an average increase rate of 1.15 mm/a. The temperature rise in the lake basins not only accelerated the melting of snow and glaciers, but also lengthened the melting period, thus providing more water for the lakes. Additionally, the increase in rainfall supplied water directly through the lake surface as well as indirectly through runoff, which also played a role in the increase of lake area.

Trends of temperature and precipitation in Central Asia from 2001 to 2016. (a) Trend of Temperature change (b). Trend of precipitation change; Point presents the significance level p < 0.05). (Generated by ArcGIS 10.2, URL: http://www.esri.com/sofware/arcgis/arcgis-for-desktop).
However, as indicated above, the precipitation and temperature in the Karakul Lake basin showed a downward trend which did not pass the significance test. As the precipitation was mainly concentrated in spring and summer22, the expansion of the lake may have been due to wintertime and springtime precipitation that melted in spring to form runoff as a source of water to recharge the lake. Karakul Lake was desiccative and strong evaporation due to temperature rise so runoff was mainly formed from glacier melt water in summer. Thus, lake area for spring was larger than summer and expanding.
In the alpine lakes of Central Asia, the agricultural land area in the Issyk-kul basin showed a marked decrease, while the area of the Alakol Lake basin noticeably expanded (Table 3). However, the significance test of P < 0.001 indicated that changes in the area of Alakol Lake were mainly influenced by climate. By analyzing the relationship between lake area change rate and recharge coefficient, this study found a positive correlation, indicating that the relationship between lake area change and precipitation underwent significant changes12,23 (Fig. 7, Table 3). The correlation coefficient was r = 0.92. Furthermore, analysis of the glacier area/lake area (correlation coefficient r = 0.43) indicated that the ratio of glacier area/lake area was smaller than that of the lake recharge coefficient, pointing to precipitation being more obvious than glacier recharge (Fig. 7, Table 3).
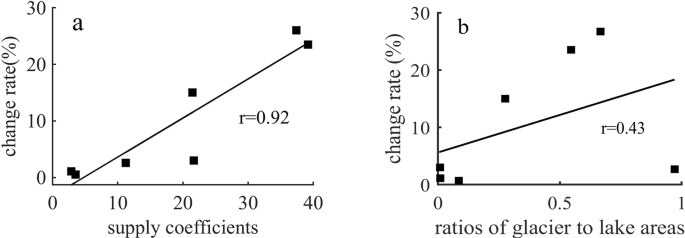
Relationship between alpine lake area change and supply coefficients, ratios of glacier to lake areas. (Generated by Matlab 2018a, URL: http://cn.mathworks.com/products/matlab/).
North Aral Sea and South Aral Sea, along with the Sarygamysh Lake, Balkhash Lake, Ebi Lake, and Ulungu Lake basins, all experienced a warming trend (Fig. 6, Table 3), with an average warming rate of 0.018 C/a. During the same time period, temperatures in the Tengiz Lake basin showed a downward trend of −0.019 C/a. Meanwhile, precipitation in the South Aral Sea and Balkhash Lake, Ebi Lake and Ulungu Lake charted an increasing trend with an average increase rate of 1.38 mm/a, whereas the North Aral Sea and Sarygamysh Lake started a downward trend of −0.243 mm/a and −0.036 mm/a, respectively, with none of these water bodies passing the significance test. Agricultural land area in the South Aral Sea and North Aral Sea and Tengiz Lake and Balkhash Lake basins also exhibited a downward trend of −150.1 km2/a, −60.37 km2/a, −46.65 km2/a and −18.31 km2/a, respectively, again with none of these locations passing the significance test. In contrast, agricultural land in Sarygamysh Lake, Ebi Lake and Ulungu Lake showed a clear upward trend, with rising rates of 19.55 km2/a, 194 km2/a and 11.23 km2/a, respectively, which passed the significance test of P < 0.05. Under the dual climate conditions of rising temperature and rising precipitation, the plains lakes demonstrated a downward trend in area, indicating that they were affected by climate change and human activities. Human activities have different impacts on the utilization of water resources in the lake basin in different seasons, and it is difficult to obtain data on the amount of water consumed in each season. Therefore, we can only use cropland area to indirectly reflect the agricultural water consumption and analyze the reasons for yearly changes of lakes area.
Discussion
In this paper, 14 Central Asian lakes with a combined area of more than 200 km2 were studied during the months of April, July and September to determine the seasonal variations in area. The freezing of the lakes in winter greatly affected their extraction accuracy21, so the winter season was not included in the study data. By comparing and analyzing the total area of lakes in April, July and September (representing changes in lake area during spring, summer and autumn), the study found a clear downward trend in the total area of the lakes, with alpine lakes showing an upward trend and plains lakes a downward trend.
It was concluded that the change of alpine lake area was generally increasing, while plain lake area was generally decreasing. The research conclusion was consistent with Tan et al.3 on the changes of lake area in Central Asia along the Silk Road, the plain lakes tended to shrink, such as Aral Sea, Ebi Lake and Sarygamysh Lake. The seasonal variation trend was similar as lake area obtained by Jing et al.17, such as Ebi Lake, Ulungu Lake and Ayakkum Lake. Bai et al.24 used Landsat images to study the changes in lake area of 9 inland lakes in Central Asia from 1975 to 2007, and found that the area of lakes in plain areas decreased significantly, while alpine lakes were relatively stable. These results were consistent with the research conclusions in this paper.
A dam between the North and South Aral seas was built in 2005 in the Berg Strait, completely controlling the water resources of the North Aral Sea. As a result, the recharge of the Syr Darya River into the North Aral Sea remained stable, meaning that the evaporation was in balance with lake precipitation and the runoff of the Syr Darya River into the lake25. However, the surface area remained stable only at certain times of the year. Snow melt water is an important water recharge source26, so the runoff in spring is higher than in summer and autumn. This finding was consistent with changes in lake area studied in this paper (Fig. 4).
The South Aral Sea experienced shrinking, followed by an increase. The springtime flooding of the Amu Darya River occurred frequently after early 2012, causing the surface of the South Aral Sea to rise2. At the same time, precipitation in the South Aral Sea region showed an increasing trend (Table 4), and rainy season from October to April27, leading to the South Aral Sea area being larger in spring than in summer or autumn due to frequent spring floods.
It is worth noting that the surface area of Sarygamysh Lake did not decrease but instead indicated an upward trend. The main reason for this seeming anomaly is that the farmland irrigation in the lower reaches of the Amu River did not flow into the Amu Darya River. Rather, Sarygamysh Lake was recharged by some of the water sources of the Amu Darya River28. Analysis of the relationship between lake area change and temperature and precipitation showed no obvious relationship among these factors, but there was a significant positive correlation between agricultural area expansion and lake area expansion (Table 4). The main reason was that the inflow of the external water source (the Amu Darya River) into Sarygamysh Lake caused expansion of the lake area. Thus, the changes which occurred to the lake’s surface area was primarily the result of human activities.
The main recharge sources of Tengiz Lake was inflow from snow-melt in Spring29. Thus area of Tengiz Lake for April was larger than July and September, and changed greatly. During the study’s time frame (2001–2016), the lake area decreased from 2001 to 2012, then enlarged from 2013 to 2015.The reasons may be climatic due to area reduction of cropland (−46.65 km2/a)in the Tengiz basin (Table 3). Precipitation in the Tengiz Lake basin from 2001 to 2016 was increasing indistinctively (2.813 mm/a), decrease of temperature (−0.019 °C/a) may cause drop in evaporation (Table 3), thus lake area change due to precipitation minus evaporation. The winter snow water equivalent in the Tengiz basin decreased from 2001 to 2012, and then began to increase subsequently2,30. Some small lakes changed with analogical trend in northern Kazakhstan due to increasing precipitation from 2013 to 201631, these were consistent with our study.
Despite increasing trends for temperature and precipitation in the Ebi Lake basin, cultivated land area increased significantly and lake area decreased significantly. These changes were obviously influenced by human activities, which was consistent with the findings of the present study32. The development of irrigation agriculture in the upper reaches of the basin consumed water from rivers, directly affected the inflow of lakes, and reduced the area of lakes in the lower reaches. Plain lakes are mainly recharged by rivers, and lake surface area varies greatly according to the amount of river runoff. However, due to the lack of runoff data for lakes basin, this study had difficulty quantitatively analyzing the impact of runoff for lakes.
Precipitation and temperature in Ayakkum Lake, Aqikkol Lake, Arkatag Lake and Sai-limu Lake basins also showed an upward trend33. According to the findings of a recent study, Alakol and Issyk-kul lakes were either stable or expanding in area due to rising temperatures in the nearby mountain region34. For Karakul Lake, which is situated in the Pamir Plateau, precipitation and temperature were slightly decreasing, thus inhibiting evaporation. Moreover, because Karakul Lake is surrounded by mountains, it is difficult for the wet vapor flow of west wind circulation to enter the basin35, which left the lake area in a stable state.
Lake ice was identified as part of lake area for April in this paper, the present study noted that lakes area were larger than that reported in the existing literature due to different reflectivity for ice and water2,17. There may be also some uncertainty with large water bodies, as the spatial resolution of MODIS is 500 m each day, which is relatively low.
Conclusion
The present work studied area changes occurring from 2001 to 2016 in 14 typical lakes in Central Asia during the months of April, July and September. Using daily 500 m resolution water product data, the interannual and seasonal variation characteristics of lakes were analyzed. Overall, the total area of the 14 lakes under study showed a significant decreasing trend. Specifically, the change rates for lake area in April, July and September were −684.9 km2/a, −870.6 km2/a and −827.5 km2/a, respectively. The total area of lakes situated in plains regions showed a significant decreasing trend during the months of April, July and September, with change rates of −716.1 km2/a, −900.5 km2/a and −858 km2/a, respectively. However, the total area of lakes situated in alpine regions showed a significant increasing trend, with change rates of 31.1 km2/a, 29.8 km2/a and 30.6 km2/a for the same three months, respectively.
The study findings also showed that the area change rate of alpine lakes was less than that of plains lakes. The seasonal variation rates of lakes in the plains region of Central Asia ranged from 1.03 to 1.99, with seasonal variation rates for the South Aral Sea, Tengiz Lake and Ebi Lake being1.99, 1.72 and 1.45, respectively. The seasonal variation of alpine lakes was smaller than that of plains lakes, ranging from 1 to 1.27. The seasonal variation rates of Issyk-kul Lake, Sai-limu Lake and Alakol Lake (in the Tianshan Mountains) were slightly less, ranging from 1 to 1.07, while the rates for Aqikkum Lake, Aqikkol Lake, Arkatag Lake and Karakul Lake (in the Kunlun Mountains and Pamir Plateau)were between 1.14 and 1.27.
Analysis of the factors influencing alpine lake area changes points to the warm and humid climate likely being the main cause for the expansion. Hence, seasonal variations in lake area differed according to recharge source and the proportion of the components. For instance, alpine lake area changes were highly positively correlated with the lake basin recharge coefficient (r = 0.92), whereas the changes showed only a slight correlation with glacier area/lake area (r = 0.43) (Fig. 7). The recharge of precipitation to lakes may be greater than glaciers.
For the plains lakes, the shrinkage of surface area was primarily the result of climate change and human activities. Furthermore, even though the area of agricultural land in the South Aral Sea basin declined, the decrease in the area of the lake was due to a portion of the runoff from the Amu Darya River recharging the Sarygamysh Lake and subsequently increasing the lake area. The North Aral Sea situation differed substantially from that of the South Aral Sea, as the truncation of surface water sources caused by the Berg Strait dam resulted in the basin basically achieving water balance, with only a slight increase in area. In the same region, Ebi Lake was directly affected by human activities of agricultural irrigation water consumption and the decrease of water inflow into the lake. In contrast, Balkhash and Ulungu lakes saw an increase in their lake areas due to the warm and humid climate surrounding them. Finally, the Tengiz Lake basin underwent a slight cooling and humidifying change in climate, which may be related to an increase inlake area after year of 2013. Through the analysis of the causes of lake changes, this paper provided suggestions for water resources management in lake basins.
Methods
Annual change rate of lake area
Least Squares Method (LSM)3 was used to calculate annual change rate of lake area, as follows:
where n represents the number of years, xi represents the annual average, and y represents the slope of the linear regression equation. A positive rate of change indicates an upward trend, whereas a negative rate of change indicates a downward trend.
Trend changes of temperature and precipitation
Mann-Kendall test was used to calculate the climate change rate and significance level36. The result (P < 0.05) indicates that the trend passed the significance test.
Extraction of lakes area
The downloaded MODIS product data were sinusoidal projection, which required projection transformation to Albers equal area with Python, with projection parameters for the central longitude 105°E, two standard parallel latitudes 25°N and 47°N, respectively, and a resampling resolution of 500 m. The vector mask file of 14 lakes was used as a buffer to obtain an area about three times the size of each lake. Water files were then extracted through the buffer zone, with the extraction process batch processed in Python. After extraction, attribute values of the.tif data with code of 61 (water) and 62 (lake ice) was assigned to 1, then.tif data were binarized to remove small water bodies outside the lakes, and monthly mean values were obtained through daily area statistics.
Data sources
Precipitation and temperature data for the study area were sourced from GPCC V8 (https://www.dwd.de/EN/ourservices/gpcc/gpcc.html) and GHCN_CAMS (https://www.esrl.noaa.gov/psd/data/gridded/data.ghcncams.html), both with spatial resolution of 0.5°and monthly temporal resolution.
Daily water body product data for the lake from 2001 to 2016, with spatial resolution of 500 m (http://data.ess.tsinghua.edu.cn/modis_500_2001_2016_waterbody.html), which was generated from MOD09GA.006 with the processing algorithm21. The MODIS tiles corresponding to lakes in this paper are h22v03, h22v04, h23v05, h23v04 and h25v05.The monthly data for lake area were calculated by means of the daily data of lake water in April, July and September, and include 14 closed lakes (7 alpine and 7 plains) with an area larger than 200 km2 (Table 1). We considered that alpine lakes were mainly located in alpine regions with small watershed areas and deep lakes12,37. Lake boundary and basin boundaries shapefiles were sourced from USGSHydroSHEDS (https://hydrosheds.cr.usgs.gov/datadownload.php?). Randolph Glacier Inventory6.0(RGI6.0) was used for the glacier lake basin (http://www.glims.org/RGI/rgi60_dl.html). MCD12Q1.006 from 2001 to 2016 (https://ladsweb.modaps.eosdis.nasa.gov/search/)with a resolution of 500 m was also employed. Landsat TM/Oil 30 m lakes data38 for validation were download from http://www.sciencedb.cn/dataSet/handle/621.
Precision evaluation of Lake water
In order to evaluate the data accuracy, we compared the results from the Landsat image explanation and MODIS product data of the Ayyakum Lake, Ebi Lake and Ulungu Lake. Landsat lake files were resampled to 500 m spatial resolution as Modis, keeping the same projection with Modis Albers projection, Modis raster data were compared with Landsat data pixel by pixel. The comparison results were shown in Table 4. The overall accuracy were all above 0.90, and the Kappa coefficient was above 0.90. Only Ebi Lake Kappa coefficient was 0.87, which may be a mixed pixel with great uncertainty in classification39.
References
Che, X. et al. Landsat-Based Estimation of Seasonal Water Cover and Change in Arid and Semi-Arid Central Asia (2000–2015). Remote Sensing 11, 1323 (2019).
Klein, I. et al. Evaluation of seasonal water body extents in Central Asia over the past 27 years derived from medium-resolution remote sensing data. International Journal of Applied Earth Observation and Geoinformation 26, 335–349, https://doi.org/10.1016/j.jag.2013.08.004 (2014).
Tan, C., Guo, B., Kuang, H., Yang, H. & Ma, M. Lake Area Changes and Their Influence on Factors in Arid and Semi-Arid Regions along the Silk Road. Remote Sensing 10, 595, https://doi.org/10.3390/rs10040595 (2018).
Bai, J., Chen, X., Yang, L. & Fang, H. Monitoring variations of inland lakes in the arid region of Central. Asia. Frontiers of Earth Science 6, 147–156, https://doi.org/10.1007/s11707-012-0316-0 (2012).
Dai, Y., Yao, T., Li, X. & Ping, F. The impact of lake effects on the temporal and spatial distribution of precipitation in the Nam Co basin, Tibetan Plateau. Quaternary International 475, 63–69, https://doi.org/10.1016/j.quaint.2016.01.075 (2018).
Hu, Z., Zhang, C., Hu, Q. & Tian, H. Temperature Changes in Central Asia from 1979 to 2011 Based on Multiple Datasets. Journal of Climate 27, 1143–1167 (2013).
Hu, Z. et al. Evaluation of three global gridded precipitation data sets in central Asia based on rain gauge observations. International Journal of Climatology, https://doi.org/10.1002/joc.5510 (2018).
Sorg, A., Bolch, T., Stoffel, M., Solomina, O. & Beniston, M. Climate change impacts on glaciers and runoff in Tien Shan (Central Asia). Nature Climate Change 2, 725–731, https://doi.org/10.1038/nclimate1592 (2012).
Duan, W., Chen, Y., Zou, S. & Nover, D. Managing the water-climate- food nexus for sustainable development in Turkmenistan. Journal of Cleaner Production 220, 212–224, https://doi.org/10.1016/j.jclepro.2019.02.040 (2019).
Zou, S., Jilili, A., Duan, W., Maeyer, P. D. & de Voorde, T. V. Human and Natural Impacts on the Water Resources in the Syr Darya River Basin, Central Asia. Sustainability 11, 3084 (2019).
Adrian, R. et al. Lakes as sentinels of climate change. Limnology and Oceanography 54,438 2283–2297, https://doi.org/10.4319/lo.2009.54.6_part_2.2283 (2009).
Yapiyev, V., Sagintayev, Z., Inglezakis, V., Samarkhanov, K. & Verhoef, A. Essentials of Endorheic Basins and Lakes: A Review in the Context of Current and Future Water Resource Management and Mitigation Activities in Central Asia. Water 9, 798, https://doi.org/10.3390/w9100798 (2017).
Duan, W. et al. Impacts of climate change on the hydro-climatology of the upper Ishikari river basin, Japan. Environmental Earth Sciences 76, 490, https://doi.org/10.1007/s12665-017-6805-4 (2017).
Duan, W. et al. Evaluation and Future Projection of Chinese Precipitation Extremes Using Large Ensemble High-Resolution Climate Simulations. Journal of Climate 32, 2169–2183, https://doi.org/10.1175/jcli-d-18-0465.1 (2019).
Tao, S. et al. Rapid loss of lakes on the Mongolian Plateau. Proc Natl Acad Sci USA 112, 2281–2286, https://doi.org/10.1073/pnas.1411748112 (2015).
Zhang, G. et al. Regional differences of lake evolution across China during 1960s–2015 and its natural and anthropogenic causes. Remote Sensing of Environment 221, 386–404, https://doi.org/10.1016/j.rse.2018.11.038 (2019).
Jing, Y., Zhang, F. & Wang, X. Monitoring dynamics and driving forces of lake changes in different seasons in Xinjiang using multi-source remote sensing. European Journal of Remote Sensing 51, 150–165, https://doi.org/10.1080/22797254.2017.1413955 (2017).
Li, J., Li, H., Wang, S. & Yang, Y. Changes of Major Lakes in Central Asia and Analysis of Key Influencing Factors. Remote sensing Technology and application (in Chinese). 34, 639–646 (2019).
Fang, L., Tao, S., Zhu, J. & Liu, Y. Impacts of climate change and irrigation on lakes in arid northwest China. Journal of Arid Environments 154, 34–39, https://doi.org/10.1016/j.jaridenv.2018.03.008 (2018).
Zhang, G. et al. Extensive and drastically different alpine lake changes on Asia’s high plateaus during the past four decades. Geophysical Research Letters 44 (2017).
Ji, L. Y., Gong, P., Wang, J., Shi, J. C. & Zhu, Z. L. Construction of the 500-m resolution daily global surface water change database (2001-2016). Water Resour Res 54, 10270–10292, https://doi.org/10.1029/2018WR023060 (2018).
Zhang, Q. & Kang, S. Glacier snowline altitude variations in the Pamirs, Tajikistan, 1998–2013: insights from remote sensing images. Remote Sensing Letters, 1220–1229, https://doi.org/10.1080/2150704x.2017.1375611 (2017).
Song, C., Huang, B. & Ke, L. Inter-annual changes of alpine inland lake water storage on the Tibetan Plateau: Detection and analysis by integrating satellite altimetry and optical imagery. Hydrological Processes 28, 2411–2418, https://doi.org/10.1002/hyp.9798 (2014).
Bai, J., Chen, X., Li, J. L. & Yang, L. Changes of inland lake area in arid Central Asia during 1975–2007:a remote-sensing analysis. Journal of Lake Sciences (in Chinese) 23(1), 80–88 (2011).
Cretaux, J. F., Kostianoy, A., Bergé-Nguyen, M. & Kouraev, A. Present-Day Water Balance of the Aral Sea Seen from Satellite. 523–539, https://doi.org/10.1007/978-3-319-94067-0_29 (2011).
Chen, Y. N., Li, Z., Fang, G. H. & Li, W. H. Large Hydrological Processes Changes in the Transboundary Rivers of Central Asia. J Geophys Res-Atmos 123, 5059–5069, https://doi.org/10.1029/2017JD028184 (2018).
Gessner, U. et al. The relationship between precipitation anomalies and satellite-derived vegetation activity in Central Asia. Global and Planetary Change 110, 74–87, https://doi.org/10.1016/j.gloplacha.2012.09.007 (2013).
Conrad, C., Kaiser, B. O. & Lamers, J. P. A. Quantifying water volumes of small lakes in the inner Aral Sea Basin, Central Asia, and their potential for reaching water and food security. Environmental Earth Sciences 75, https://doi.org/10.1007/s12665-016-5753-8 (2016).
Aladin, N. V. & Plotnikov, I. S. Large Saline Lakes of Former Ussr - a Summary Review. Hydrobiologia 267, 1–12, https://doi.org/10.1007/Bf00018787 (1993).
Che, X. H. Study on extraction and spatial and temporal change of lakes based on remote sensing data – a case study of Asia central area.Dissertation, Institute of Geographic Sciences and Natural Resources Research, Chinese Academy of Sciences. (2018)
Yapiyev, V. et al. Estimation of water storage changes in small endorheic lakes in Northern Kazakhstan. Journal of Arid Environments 160, 42–55, https://doi.org/10.1016/j.jaridenv.2018.09.008 (2019).
Wang, J. et al. Dynamic detection of water surface area of Ebinur Lake using multi-source satellite data (Landsat and Sentinel-1A) and its responses to changing environment. Catena 177, 189–201, https://doi.org/10.1016/j.catena.2019.02.020 (2019).
Liu, Y., Yang, J., Chen, Y., Fang, G. & Li, W. The Temporal and Spatial Variations in Lake Surface Areas in Xinjiang, China. Water 10, 431 (2018).
Alifujiang, Y., Abuduwaili, J., Ma, L., Samat, A. & Groll, M. System Dynamics Modeling of Water Level Variations of Lake Issyk-Kul, Kyrgyzstan. Water 9 (2017).
Komatsu, T. & Tsukamoto, S. Late Glacial Lake-Level Changes in the Lake Karakul Basin (a Closed Glacierized-Basin), eastern Pamirs, Tajikistan. Quaternary Research 83, 137–149, https://doi.org/10.1016/j.yqres.2014.09.001 (2017).
Sen, P. K. Estimates of the regression coefficient based on Kendall’s Tau. J Am Stat Assoc. 63, 1379–1389 (1968).
Catalan, J. & Donato Rondón, J. C. Perspectives for an integrated understanding of tropical and temperate high-mountain lakes. Journal of Limnology 75, https://doi.org/10.4081/jlimnol.2016.1372 (2016).
Zhang, D., Li, X. & Yao, X. The data set of lake boundary in northwest China was ≥10 km2 from 2000 to 2014. Science Data Bank (in Chinese), https://doi.org/10.11922/sciencedb.621 (2018).
Khandelwal, A. et al. An approach for global monitoring of surface water extent variations in reservoirs using MODIS data. Remote Sensing of Environment 202, 113–128, https://doi.org/10.1016/j.rse.2017.05.039 (2017).
Messager, M. L., Lehner, B., Grill, G., Nedeva, I. & Schmitt, O. Estimating the volume and age of water stored in global lakes using a geo-statistical approach. Nature Communications, 13603, https://doi.org/10.1038/ncomms13603 (2016).
Li, J. L., Chen, X. & Bao, A. Spatial-temporal characteristics of lake level changes in central Asia during 2003–2009. Acta Geographica Sinica (in Chinese) 66, 1219–1229 (2011).
Feng, L. et al. Assessment of inundation changes of Poyang Lake using MODIS observations between 2000 and 2010. Remote Sensing of Environment 121, 80–92, https://doi.org/10.1016/j.rse.2012.01.014 (2012).
Song, C., Huang, B., Richards, K., Ke, L. & Hien Phan, V. Accelerated lake expansion on the Tibetan Plateau in the 2000s: Induced by glacial melting or other processes? Water Resour Res 50, 3170–3186, https://doi.org/10.1002/2013wr014724 (2014).
Acknowledgements
The research is supported by the National Natural Science Foundation of China (41630859) and Supported by the Strategic Priority Research Program of the Chinese Academy of Sciences (XDA19030204).
Author information
Authors and Affiliations
Contributions
L.H.J. conceived and wrote the main manuscript text, C.Y.N. and Y.Z.X. revised the manuscript text, L.Y. P. and Z.Q.F. contributed to some suggestions about softwares usage.
Corresponding author
Ethics declarations
Competing interests
The authors declare no competing interests.
Additional information
Publisher’s note Springer Nature remains neutral with regard to jurisdictional claims in published maps and institutional affiliations.
Rights and permissions
Open Access This article is licensed under a Creative Commons Attribution 4.0 International License, which permits use, sharing, adaptation, distribution and reproduction in any medium or format, as long as you give appropriate credit to the original author(s) and the source, provide a link to the Creative Commons license, and indicate if changes were made. The images or other third party material in this article are included in the article’s Creative Commons license, unless indicated otherwise in a credit line to the material. If material is not included in the article’s Creative Commons license and your intended use is not permitted by statutory regulation or exceeds the permitted use, you will need to obtain permission directly from the copyright holder. To view a copy of this license, visit http://creativecommons.org/licenses/by/4.0/.
About this article

Cite this article
Liu, H., Chen, Y., Ye, Z. et al. Recent Lake Area Changes in Central Asia. Sci Rep 9, 16277 (2019). https://doi.org/10.1038/s41598-019-52396-y
Received:
Accepted:
Published:
DOI: https://doi.org/10.1038/s41598-019-52396-y
This article is cited by
-
A four-band index for both liquid and solid water and its applications in the Aral Sea Basin
Science China Earth Sciences (2024)
-
Hydrological processes and water quality in arid regions of Central Asia: insights from stable isotopes and hydrochemistry of precipitation, river water, and groundwater
Hydrogeology Journal (2024)
-
Correlation analysis between the Aral Sea shrinkage and the Amu Darya River
Journal of Arid Land (2023)
-
Mountain surface processes and regulation
Scientific Reports (2021)
-
Dynamic change and spatial analysis of Great Lakes in China based on Hydroweb and Landsat data
Arabian Journal of Geosciences (2021)
Comments
By submitting a comment you agree to abide by our Terms and Community Guidelines. If you find something abusive or that does not comply with our terms or guidelines please flag it as inappropriate.
