
Abstract
In the central nervous system of vertebrates, cell bodies of neurons are often assembled as nuclei or cellular layers that play specific roles as functional units. The purpose of this work was to selectively highlight such cell assemblies by magnetic resonance imaging using signals from water protons that are associated with intracellular paramagnetic ions, while saturating lipid-associated water protons as well as extracellular free water protons. Given the significant correlation between image signal intensity and water proton density, the high signal intensities observed for such cell assemblies must be attributed to their abundant paramagnetic-ion-associated water protons. In the hippocampal formation, the technique visualized cell assemblies that were so far not depicted in human in vivo. In the brainstem, the technique delineated noradrenergic neuron groups such as the locus coeruleus in human and mice in vivo. Their reduced magnetization-transfer ratios together with their prolonged relaxation times compared to other gray matter indicate that the source of their high signal intensity is not the presence of T1-shortening molecules, e.g., neuromelanin, but their high water content. Given the general absence of neuromelanin in noradrenergic neurons of rodents, their high signal intensity in mice in vivo further supports this view.
Introduction
In the central nervous system of vertebrates, cell bodies of neurons are often assembled as nuclei or cellular layers that play specific roles as functional units, e.g. in the hippocampal formation as shown in Fig. 1 (top left, arrowheads). Magnetic resonance imaging (MRI) can readily differentiate large cell assemblies from surrounding tissue. This is because intracellular water protons exhibit T1 and T2 relaxation times which are generally smaller than those of bulk water protons in extracellular spaces1 (denoted “Free“ in Fig. 1), but larger than those of (intra- and extra-cellular) water protons that interact with lipid bilayers2 (denoted “Lipid-associated“ in Fig. 1). After administration of exogenous contrast agents3, also small cell assemblies in the hippocampal formation (Fig. 1, top left, arrowheads) can be identified and distinguished from the neuropil (Fig. 1, top left, asterisks) and spaces filled with cerebrospinal fluid (CSF).

(Top) (left) Nissl stain and (middle) T1-weighted MR images of the hippocampal formation of mice in vivo (9.4T, spoiled 3D FLASH, TR/TE 22/7.6 ms, flip angle α 25°, 25 × 25 × 250 µm3 resolution) after intraventricular injection of gadolinium-diethylenetriamine pentaacetic acid (Gd-DTPA), and (right) after systemic administration of manganese (Adapted from3,49). After Gd-DTPA the signal intensities in the cellular layer are lower than in the neuropil (and higher after Mn2+) indicating that the cellular layer (arrowheads) has a lower content of extracellular water protons than the neuropil (asterisks). (Bottom) Schematic drawing of three major brain water pools that contribute to MRI: “Lipid-associated” (purple) water protons which may be affected by cross-relaxation or magnetization transfer, “paramagnetic-ion-associated” (green) water protons in intracellular spaces, and “free” (red) bulk water protons in extracellular spaces.
Here we attempt to gain signals selectively from the water protons that are associated with intracellular paramagnetic ions by saturating extracellular free water protons by direct on-resonance irradiation, as well as by eliminating signal contributions from lipid-associated protons by off-resonance irradiation of short T2 lipid protons with broad linewidths. The latter method indirectly saturates lipid-associated water protons through magnetization transfer4 (MT). The concept neither runs counter to previous studies showing fast water exchange between extra- and intra-cellular spaces relative to T1 relaxation times1 nor attempts to differentiate between extra- and intra-cellular pools of water protons. Instead, we propose a new strategy to preferentially image the fraction of intracellular water protons (“Paramagnetic-ion-associated“ in Fig. 1).
Results
Magnetization-transfer MRI of the brain provides proton-density contrast while saturating extracellular free water protons
Figure 2a and Supplementary Fig. 1 compare various quantitative maps of the human brain. The M0 map (M0), proton-density-weighted MRI with MT (α15 MT), and T1-weighted MRI with MT (α70 MT) reveal a similar contrast except for CSF. The MT ratio maps (α15 MTR and α70 MTR) and the R1 map (R1) also show similar contrast. Quantitative evaluations (Fig. 2b–f, Supplementary Table 2) confirm these observations. Mean regional MT ratios (α70 MTR) of gray matter (GM) structures correlate linearly with their longitudinal relaxation rate R1 (Fig. 2b). The deviation of the MT ratios of white matter (WM) and CSF from the linear relationship is attributable to their lower R2/R1 ratio (Fig. 2c) and thus to a weaker direct-saturation effect. Here, the WM shows a similar downward deviation because of its lower paramagnetic ion content5 (i.e., low R2) and its strong interaction with water protons2 (i.e., high R1). CSF, with its high water content, is also exposed to a lower direct-saturation effect because other molecules increase the R2 of the water protons more than R1. In vitro experiments of solutions with 6 different R1 and R2 values confirmed that direct-saturation effects correlate linearly with R2/R1 ratios (Supplementary Fig. 2a–c).
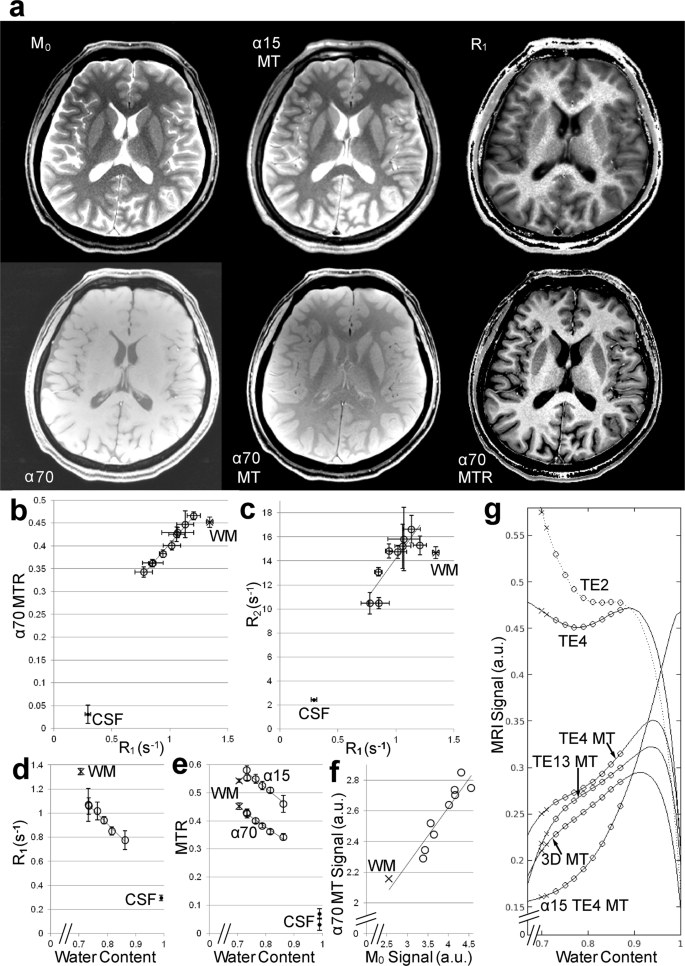
Magnetization-transfer MRI provides proton-density contrast in brain while saturating extracellular free water protons. (a) Comparison of M0 map (M0), proton-density-weighted MRI with MT (α15MT), R1 map (R1), T1-weighted MRI without (α70) and with MT (α70MT), MT ratio map (α70MTR). (b) Mean MT ratios (α70MTR) and (c) R2 of various regions in the brain plotted vs. their R1 as well as (d) R1 and (e) MT ratios (α15 MTR and α70 MTR) plotted vs. their water content. Functions and correlation coefficients are: (b) y = 0.2936x + 0.1116, r = 0.99b (d) y = −2.3556x + 2.796, r = −0.99, (e) y = −0.8181x + 1.1706, r = −0.97 for α15 and y = −0.6843x + 0.9263, r = −0.99 for α70. (f) Regional signal intensities in α70 MT plotted vs. those in M0 in a subject. They correlate significantly (r = 0.94, p < 0.0005). (g) Calculated signal intensities for RF-spoiled gradient-echo MRI as a function of the water content in human brain. (TE2) 2D, TR/TE = 250/2.46 ms, α 70°, (TE4 and TE4MT) 2D, TR/TE = 863/4.4 ms, α 70° without and with magnetization transfer, (TE13MT) 2D, TR/TE = 715/13.2 ms, α 70° with magnetization transfer, (3DMT) 3D, TR/TE = 47/7.5 ms, α 22°, (α15TE4MT) 2D, TR/TE = 863/4.4 ms, α 15° with magnetization transfer. Here, for a selected combination of acquisition parameters α, TR, and TE, the variables R1, R2*, and MTR used for the calculation of MRI signal can be described as a function of tissue water content as shown in Supplementary Fig. 3. The R1 and R2* are obtained from the functions given in the legend of Supplementary Fig. 3a and 3d, respectively. The MTRs for “TE4MT”, “TE13MT”, “3DMT”, and “α15TE4MT” are obtained from the functions given in the legend of Supplementary Fig. 3b, 3c, 3e, and 3f, respectively. ◦ = gray matter structure (prefrontal cortex, caudate nucleus, putamen, thalamus, globus pallidus, and substantia nigra for (d) and (e). In addition, subthalamic nucleus, red nucleus, and locus coeruleus for (b), (c), and (f), × = WM = frontal subcortical white matter, ∙ = CSF = cerebrospinal fluid, error bars = standard deviation.
Mean regional R1 of GM structures correlate linearly with their water content (Fig. 2d). The upward deviation of the WM R1 from the linear relationship is again attributable to its large interaction with water protons2. This effective cross-relaxation in WM is apparently cancelled out by the more pronounced direct-saturation effect on GM structures, which results in an apparent linear relationship between the MT ratio (α70) and the water content including both GM and WM (Fig. 2e). Accordingly, the even more pronounced direct-saturation effect by a weaker on-resonance irradiation (α15) brings them again out of the apparent linear relationship. The values of the GM structures with significantly higher iron content, e.g., the globus pallidus and red nucleus, and those with significantly higher copper content, e.g., the substantia nigra (SN) and locus coeruleus (LC), are well in line with those of other GM structures. Paramagnetic ion concentrations correlate neither with R1 nor with MT ratios (Supplementary Fig. 2d–i). These findings indicate that the regional water content determines both MT ratio and R1. Accordingly, regional signal intensities in T1-weighted MRI with MT (α70 MT) correlate significantly (p < 0.005) with those in M0 in every subject (Fig. 2f), which also indicates that the regional spin density of intracellular water protons correlate significantly with the regional water content.
Figure 2g shows calculated signal intensities for gradient-echo MRI as a function of water content in human brain based on the obtained MT ratios as well as R1 and R2* values (Supplementary Fig. 3). A strong on-resonance irradiation with short TE and TR (TE2 in Fig. 2g) saturates the free water protons in the extracellular fluid with a water content6 of 0.99. This results in a typical T1-weighted MRI contrast and a high signal intensity for WM. A prolongation of echo time (TE4) reduces the T1-weighting and thus the WM signal. The addition of MT (TE4MT) suppresses the MRI signal in proportion to the macromolecular content (i.e., in inverse proportion to the water content), while the saturation of the free water protons is preserved. As a result, the MT effect dominates for brain tissue (water content < 0.9), while the T1 effect dominates for extracellular fluid (water content > 0.95). When saturating extracellular free water protons, the significant correlation between the signal intensities in MT-MRI and the proton density (Fig. 2f) indicates that the signal intensities reflect the spin density of intracellular water protons with short T1 values. This relationship between the MT-MRI signal intensity and the water content remains unaffected by a further prolongation of TE (TE13MT) or by a three-dimensional acquisition (3DMT). In contrast, a weak on-resonance irradiation in combination with MT (α15TE4 MT) leaves the extracellular free water protons unsaturated and provides a typical proton-density MRI contrast for both intra- and extra-cellular water (c.f., α15MT in Fig. 2a).
The highly significant correlations in pixel-by-pixel plots (Fig. 3) confirm that the water protons whose T1 is shortened by diamagnetic molecules are proportionally saturated by off-resonance irradiation (Fig. 3b) and that magnetization transfer generates proton-density contrast (Fig. 3c). A pool of pixels with high signal intensity in M0 as well as in α15MT can be identified in Fig. 3c. With stronger on-resonance irradiation (Fig. 3d,e), a pool of comparable size deviates from the otherwise clearly correlated plots. These pools are supposed to consist of pixels that are dominated by free water protons because the exclusion of CSF from the analysis (see regions-of-interest in Fig. 3a) results in a clear correlation again (Fig. 3f,g).

Magnetization-transfer MRI provides proton-density contrast in brain while saturating extracellular free water protons. (a) Comparison of M0 map and (α15MT) proton-density-weighted as well as (α70MT) T1-weighted MRI with magnetization transfer. Note the similar contrast between M0 and α15MT for the entire intracranial tissue, the similar contrast for all three images within the regions-of-interest selected in brain (white lines), as well as the saturation of free water protons in the cerebrospinal fluid (arrows) in α70MT. (b) Pixel-by-pixel plots of α70MTR vs. T1, (c) of signal intensities in α15MT vs. M0, (d) of signal intensities in α70MT vs. M0, (e) of signal intensities in α70MT vs. α15MT for the entire intracranial tissue, (f) of signal intensities in α70MT vs. M0, and (g) of signal intensities in α70MT vs. α15MT for the regions-of-interest shown in (a). Note the significant (p < 0.0005) correlation in (b), (c), (f), and (g). A pool of pixels (arrows) with high signal intensity in M0 as well as in α15MT can be identified in (c). Strong on-resonance irradiation (d,e) results in a downward deviation of a pool of comparable size. These pixels are supposed to be dominated by free water protons. Functions and correlation coefficients are: (b) y = −0.0157x + 58.4, r = −0.84, (c) y = 0.3396x + 2.86, r = 0.87, (f) y = 0.3423x + 169.2, r = 0.80, and (g) y = 1.2925x + 145.4, r = 0.77.
Magnetization transfer delineates small cell assemblies in the central nervous system of human and mice in vivo
Figure 4 shows images obtained with the parameters given in Fig. 2g as “TE4”, “TE4 MT”, and “TE13 MT”. Repetitive on-resonance irradiation (TE4 in Fig. 4) saturates the CSF water protons while providing the brain tissue with high signal intensities. The magnified image of the hippocampal formation reveals high signal intensities for myelinated layers such as the alveus and the stratum lacunosum-moleculare. There is hardly a structure identifiable within the spinal cord. Magnetization transfer (TE4 MT in Fig. 4) predominantly suppresses the WM signal and shows the H-shaped cell assemblies as bright structures. A prolongation of TE (TE13 MT in Fig. 4) further enhances the image contrast and delineates the small cell assemblies in the hippocampal formation and the spinal cord even more clearly. The MRI pattern of high signal intensity in the hippocampal formation corresponds to the distribution pattern of the acetylcholinesterase reaction product (Fig. 4). This suggests that the MRI signals originate from cytoplasms and proximal dendrites of the neurons in the dentate gyrus as well as in the stratum oriens, pyramidale, and radiatum of the CA1~CA4~prosubiculum7,8. The pyramidal and polymorphic neurons that are rich in acetylcholine esterase play a critical role in establishing complicated neural networks9.

Magnetization transfer delineates cell assemblies in the central nervous system of human in vivo. (a) (Top row) (TE4) Coronal in vivo T1-weighted MRI (TR/TE = 473/4.4 ms, α 70) without magnetization transfer, (TE4 MT) with magnetization transfer, and (TE13 MT) with magnetization transfer and prolonged echo time (TR/TE = 715/13.2 ms). Arrows indicate gray matter structures, i.e., (from top to bottom) the cerebral cortex, caudate nucleus, putamen, and cerebellar cortex. (Bottom row) (TE4 and TE13 MT) Magnified MR images of the hippocampal formation in vivo indicated as dotted rectangles in top row images in comparison with (right) a light microscopic image of the acetylcholine esterase ex vivo7 (contrast inverted). Arrows indicate myelinated layers such as the alveus (black arrows) and the stratum lacunosum-moleculare (dotted arrows). In the light microscopic image, the cytoplasm and proximal dendrites of the neurons in the dentate gyrus as well as those in the stratum oriens, pyramidale, and radiatum of the CA1~CA4-prosubiculum are highlighted by the reaction products7,8. CA1~4 = Subfields 1~4 of the Ammon´s horn, DG = dentate gyrus, mf = mossy fibers, ProS = prosubiculum, Sub = subiculum. (b) (TE4) Axial MRI of the upper cervical spinal cord of a human subject without magnetization transfer, (TE4 MT) with magnetization transfer, and (TE13 MT) with magnetization transfer and prolonged echo time. Predominant saturation of the white matter by magnetization transfer preserves the bright H-shaped cell assemblies.
Similarly, in the brain of mice (Fig. 5a), magnetization transfer suppresses the signal intensities of the myelinated tissue and highlights cell assemblies as bright structures. In the spinal cord, MT distinguishes the unmyelinated cell layers of the Rexed lamina II (white arrows), the myelinated GM, and WM. These observations suggest unmyelinated layers that are tightly packed with nerve cell bodies which are responsible for the highest signal intensity. This assumption was verified by an additional experiment which compares a placebo-treated and a lesioned mouse (Fig. 5b). In agreement with previous observations of this well-established model for nerve cell death10, the histologic staining reveals a marked loss of pyramidal cell bodies in the affected animal. The corresponding loss of MRI signal intensity therefore supports the assignment of the high signal intensity to the presence of viable pyramidal cell bodies. As a consequence, the bright structure in T1-weighted MRI of the Ammon´s horn of the hippocampus with or without MT (Fig. 5a) must be ascribed to the densely packed layer of pyramidal cell bodies.

Magnetization transfer delineates cell assemblies in the central nervous system of mice in vivo. (a) (Top row) Horizontal sections of the forebrain as well as (bottom row) axial sections of the upper cervical spinal cord of mice obtained by (left column) in vivo T1-weighted MRI (2.35T, RF-spoiled 3D FLASH, TR/TE = 30/7.6 ms, α 25°, Δf = 5000 Hz, ωSAT = 1045°/12 ms, 117 µm isotropic resolution, measuring time = 4 hours) without and (middle collumn) with magnetization transfer in comparison with (right column) light microscopy of cell bodies49 (contrast inverted). Magnetization transfer suppresses the signal intensities of the myelinated tissue and leaves the cell waters as bright structures. The white arrows indicate the unmyelinated cell layers of the Rexed lamina II of the spinal cord. Black arrows = myelinated tissue, Hb = habenular nucleus, DG and CA3 = dentate gyrus and CA3 of the hippocampal formation. (b) (Left) horizontal MRI in vivo (2.35T, RF-spoiled 3D FLASH, TR/TE = 22/8.2 ms, α 30°, 100 × 100 × 500 μm3 resolution) and corresponding histology (cresyl violet staining for cell bodies, contrast inverted) of the hippocampus of a placebo-treated FVB/N mouse and (right) a mouse 4 days after administration of kainic acid. The lack of pyramidal cells in the CA3 subfield of the lesioned animal corresponds to the lack of MRI contrast.
Magnetization transfer delineates noradrenergic neuron groups in the brainstem of human and mice in vivo
In the brainstem, we delineated assemblies of noradrenergic neurons (Fig. 6a, Supplementary Fig. 4). Noradrenaline, also called norepinephrine, is a catecholamine that acts as hormone and neurotransmitter. Noradrenergic neurons, which produce the neuromodulator and release it from axonal terminals that spread widely throughout the brain, are assembled in the brainstem as A1 to A7 cell groups11. The major groups12 are A2, i.e., the dorsal motor vagus nucleus and nucleus tractus solitarius, in the medulla oblongata and A6, i.e., LC, in the pons. Here, we observed that the noradrenergic cell groups have low MT ratios and high T1 and T2 values compared to other GM structures (Supplementary Fig. 4, Supplementary Table 2). These findings indicate that the noradrenergic cell groups have high water content and that their high concentration of copper is not the source of the high MRI signal intensity.

Magnetization transfer delineates noradrenergic neuron groups in the brainstem of human and mice in vivo. (a) (Top row) Transversal T1-weighted MRI (3T, spoiled 2D FLASH, TR/TE = 863/4.4 ms, α 70°, (0.66 mm)2 in-plane resolution, 2.5 mm slice thickness, 21 slices, total acquisition = 9 min 11 s) of the locus coeruleus and (bottom row) A2 cell groups of an adult human (left column) without magnetization transfer, (middle column) with magnetization transfer, and (right column) magnetization-transfer ratio map (scale: 34–53%). (b) (Left) Coronal MRI (spoiled 3D FLASH, TR/TE = 30/7.6 ms, flip angle 22°, Δf = 2500 Hz, ωSAT = 523°/12 ms, 117 µm isotropic resolution) of the locus coeruleus of a 4-week-old female mouse in comparison with (right column) corresponding Nissl-stained sections (adapted from50). (c) Coronal MRI sections of the A2 cell groups of a 4-week-old female wild-type mouse.
Similarly, with optimized parameters (Supplementary Tables 1a–h) we also delineated LC and A2 in mice (Fig. 6b,c, and Fig. 7). In T1 map, neither LC nor A2 group was delineated from surrounding brainstem. The T1 values (mean ± SD) of the brainstem at 2.35T are 0.93 ± 0.01 s at the level of LC and 0.95 ± 0.03 s at the level of A2 in males (n = 5), or 0.97 ± 0.02 s at the LC level and 1.0 ± 0.03 s at the A2 level in females (n = 4). The absence of T1 contrast and the T1 values are in line with data obtained in human brain at 3T (Supplementary Table 2). The lack of delineation does not result from the partial volume effect because T1-weighted MRI with MT at the same spatial resolution (117 × 117 × 234 µm3) delineates the LC and A2.

(a) (Upper row) Parasagittal T1-weighted MRI (2.35T, RF-spoiled 3D FLASH, TR/TE = 30/7.6 ms, α 25°, 117 µm isotropic resolution, total acquisition = 4 hours) of the locus coeruleus and (lower row) the A2 cell groups of an 8-week-old female NMRI mouse (left column) without magnetization transfer, (middle column) with magnetization transfer (Δf = 5000 Hz, ωSAT = 1045°/12 ms), and (right column) magnetization-transfer ratio map (scale: 0–50%). (b) Parasagittal MRI (2.35T, RF-spoiled 3D FLASH, TR/TE = 30/7.6 ms, flip angle 22°, Δf = 2500 Hz, ωSAT = 523°/12 ms, 117 µm isotropic resolution) of the locus coeruleus and (c) A2 cell group of a 3-week-old male NMRI mouse. (d) Horizontal and (e–g) coronal MRI of the same animal showing the planes indicated in (b,c). A2 = A2 cell group, Hp = pyramidal cell layer of the hippocampus, LC = locus coeruleus, PCL = Purkinje cell layer of the cerebellum, arrowheads = marginal nuclei of the brachium conjunctivum.
Magnetization-transfer MRI detects signal enhancement of specific cell assemblies after administration of manganese
As mentioned earlier, physiological concentrations of endogenous paramagnetic ions have no significant effect on R1 or MT ratio (Supplementary Fig. 2d–i). On the other hand, as shown in Fig. 8 and Supplementary Table 3, we observed significant MT ratio reduction as well as significant signal increase in MT-MRI of the brain of mice after administration of Mn2+ in agreement with a number of previous studies13. The Mn2+-induced signal-to-noise ratio (SNR) increase for the pyramidal cell layers (81%, p < 0.01) and habenular nuclei (79%, p < 0.05) is significantly greater than for LC (49%). These findings indicate that the uptake and/or storage capacity of LC neurons for Mn2+ ions is limited and suggest that these mechanisms may be preferentially oriented towards Cu2+ ions.

(a) (T1W) Horizontal T1-weighted images of the brain of a female young adult NMRI mouse, (+MT) with magnetization transfer, (+Mn) after Mn2+ injection, and (+MT + Mn) with MT after Mn2+ injection. Magnetization transfer delineates nerve cell assemblies that are further enhanced by the accumulation of intracellular Mn2+. (b) (Top row) Coronal MRI of the locus coeruleus and (bottom row) A2 cell groups of the same mouse (left) before and (right) after Mn2+ injection. The effect of Mn2+ on noradrenergic neurons is less pronounced than that on other nerve cell assemblies such as the cerebellar Purkinje cell layers or the superior olivary complexes. A2 = noradrenergic cell group 2, Hb = habenular nucleus, CA3 = CA3 of the hippocampal formation, LC = locus coeruleus, PCL = Purkinje cell layer of the cerebellum, SOC = superior olivary complex.
Discussion
Generation of image contrast
In order to visualize cell assemblies by in vivo MRI, we exploited differences in spin density, T1, and T2* of water protons among different tissue compartments because these properties determine the observable magnetization in spoiled gradient-echo MRI. First of all, saturation of extracellular free water protons was accomplished by repetitive strong on-resonance irradiation which provides images where intracellular water protons exhibit high signals. Secondly, we used MT to exploit the spin-density difference between intracellular and lipid-associated water protons as the degree of MT saturation primarily depends on the relative concentrations of water and macromolecules14 (Fig. 2e). Thirdly, prolongation of TE further adds to the spin-density contrast because T2 and T2* are also largely a function of macromolecule concentration15 (Supplementary Fig. 3d). Potentially more pronounced off-resonance artifacts due to TE prolongation may be minimized by increasing the spatial resolution with only mild SNR reductions because the receiver bandwidth may be reduced accordingly. Taken together, we cancelled the T1 contrast in gradient-echo MRI with the use of MT and TE prolongation, which results in an image contrast that primarily reflects proton density (c.f., equations in the Methods and Fig. 2g) and only secondarily T1 or T2* relaxation. The proton-density effect dominates the observable signal for lipid-associated water protons (<0.9), while the T1 effect applies to the extracellular free water protons (>0.95).
In principle, signal intensity in gradient-echo MRI with strong on-resonance and off-resonance irradiation reflects the density of water protons whose T1 is shortened by paramagnetic ions. This is because water protons with exposure to diamagnetic molecules become proportionally saturated by off-resonance irradiation (Figs 2b and 3), while the free water protons remain saturated by on-resonance irradiation (Fig. 2g). In other words, the effect of water proton T1-shortening on MRI signal intensity (i.e., signal increase) induced by diamagnetic molecules is cancelled by the effect induced by off-resonance irradiation (i.e., signal reduction due to saturation transfer), whereas the effect of water proton T1-shortening on MRI signal intensity (i.e., signal increase) induced by paramagnetic ions is not. Accordingly, T1-shortening by paramagnetic ions increases the MT-MRI signal intensity. On the other hand, shortening of T2 or T2* by paramagnetic ions reduces the signal intensity not only as a result of the more pronounced dephasing, but also by the more pronounced direct-saturation effect2. Therefore, the relaxation enhancement factor16 of paramagnetic ions as well as their local concentration must be considered, because it has a great influence on T1 and T2 relaxation times of affected water protons as well as their ratio. Upon binding to macromolecules, the ions with a higher factor provide more efficient T1 shortening, more efficient T1/T2 ratio reduction, weaker direct-saturation effect, and thus more efficient signal enhancement in MT-MRI. With regard to the most concentrated paramagnetic ions in brain, the relaxation enhancement factor16 of Fe3+ on binding to a macromolecule is only 0.3 while that of Cu2+ is 10 and that of Mn2+ is 8. This is because Fe3+ ion has a much shorter electron relaxation time than Cu2+ or Mn2+ ion17. Given their high relaxation enhancement factors as well as their high intracellular concentration5 which meets their high metabolic demand, it is possible that Cu2+ and Mn2+ together play a role in high MT-MRI signal intensity of some specific cell assemblies, although we showed that the water proton density plays the central role (Fig. 2d–e, Supplementary Fig. 2). In fact, we demonstrated that administration of Mn2+ shortens T1 relaxation times, reduces MT ratio, and increases the signal intensity in MT-MRI18.
Within a cellular structure, water proton exchange is fast compared to T1 so that all water protons have the same T1. Moreover, the diffusion is efficient at mixing multiple pools within a cellular structure. However, in brain there are regions that restrict the diffusion of the water, that possess less cellular structure (i.e., the neuropil), or that represent CSF spaces. These contributions cause contrast in T1 maps of the brain (e.g., GM, WM, CSF spaces). If diffusion were efficient at mixing multiple pools of water protons throughout the brain, then it would eliminate all T1 differences. Instead, the observed T1 contrast indicates that there are brain regions where the diffusion is not efficient to mix multiple pools. In this regard, the present approach is advantageous because it readily provides higher spatial resolution compared to conventional T1 mapping and thus is expected to distinguish cellular structures in an unprecedented way. Nevertheless, we do not entirely exclude the contribution of extracellular water protons to the MRI signal by the present method.
In general, the direct-saturation effect alters the image contrast beyond the change caused by “pure MT” alone. This effect occurs during application of strong off-resonance irradiation, e.g., several kHz off the water resonance. In this scenario, samples with shorter T2 times lead to broader resonance linewidths, more direct radiofrequency saturation, and a larger MTR (Supplementary Fig. 2a–c). The fact that the slope of this line is smaller at higher flip angles is simply due to greater saturation by on-resonance irradiation and thus reduced residual magnetization for absorbing off-resonance irradiation.
Paramagnetic ions in brain in vivo
Iron, the most concentrated transition metal in the brain, is not sufficiently concentrated to interfere with the interaction between the much more concentrated macromolecules and water protons. Even in the globus pallidus, the structure with the highest iron concentration, the MT ratios and T1 relaxation times are both within the range (Fig. 2b, Supplementary Fig. 2d,g) expected solely by the macromolecule and water content. In addition, Fe3+ has a short electron spin relaxation time. Thus, a potential binding interaction with macromolecules in vivo may further reduce its relaxivity16 by 70%. In fact, the T1 relaxivity of free Fe3+ of 7–13 L∙mmol−1∙ sec−1 is reduced19 to about 4 L∙mmol−1∙ sec−1 upon binding to ferritin. Brain iron, 90% of which is bound as Fe3+ to ferritin20, can thus be considered as poor T1-shortening ion acting primarily on T2 relaxation time21 because of its great magnetic moment (5.9). Accordingly, the globus pallidus and red nucleus as the structure with the highest iron content provide low MT-MRI signal intensity in proportion to their low proton density (Supplementary Fig. 1).
Copper, a transition metal with a capacity to gain and donate electrons, serves as a cofactor for electron transfer by important enzymes. In the brain of mammals, they include cellular respiration (cytochrome-c oxygenase), anti-oxidant defense (superoxide dismutase), and catecholamine synthesis/metabolism (tyrosine hydroxylase and dopamine β-hydroxylase). In addition, copper is involved in glutamate-dependent activity of hippocampal neurons22,23. Accordingly, copper is most concentrated in the noradrenergic5,24, dopaminergic, and glutamatergic neurons, which reflects their high metabolic demands for the metal25. Most copper ions in brain are bound to proteins and thus their distribution among different sub-cellular compartments is tightly regulated24,25. Therefore, the T1 relaxivity of Cu2+ in brain in vivo may be higher than that of Fe3+, because Cu2+ has a long electron spin relaxation time17. At 50 MHz, T1 relaxivity of free Cu2+ is19 about 0.5 L∙mmol−1∙ sec−1 that may be enhanced upon binding16 to be about 5 L∙mmol−1∙ sec−1 in vivo, whereas that of free Fe3+ is19 6.9 L∙mmol−1∙ sec−1 that may be reduced16 to about 3 L∙mmol−1∙ sec−1. T2 relaxivity of Cu2+ is much lower than Fe3+ because of its small magnetic moment19,26 (1.7–2.2). Given (i) these favourable properties for Cu2+ to efficiently reduce T1 and T1/T2 ratio as well as (ii) the high MT-MRI signal intensities of LC, A2, SN, and hippocampal neurons that may correspond to the high metabolic demand for copper25 in their noradrenergic, dopaminergic, or glutamatergic neurons, it is possible that intracellular copper concentration plays a role in MT-MRI signal intensity, although we showed that it is their high proton density that plays the central role.
Manganese is less concentrated in brain than iron or copper as long as its uptake into the systemic blood circulation is physiologically regulated by the hepatic portal system. Thus, the physiological brain concentration of manganese has no effect on MT ratios or T1 (Supplementary Fig. 2f,i). After administration of exogenous Mn2+ ions, however, the T1 relaxation times, MT ratio, and MRI signal intensity in brain alter significantly18. After entering the systemic blood circulation and crossing the capillary endothelium, Mn2+ ions are supposed to accumulate in the cytosol, mitochondria, lysosomes, and microsomes of brain cells, where they may bind to cytosolic proteins and inner mitochondrial membranes13. The resulting immobilization of Mn2+ ions may increase their T1 relaxivity16 in vivo, which reduces the T1/T2 ratio efficiently.
It is unlikely that the MT contrast of specific cellular assemblies shown in the present study is due to unique lipid or protein structures. If the high signal intensity of those structures were due to the presence of T1-shortening molecules, then the T1 of those structures would have been shorter than other gray matter or surrounding structures. The present study showed that exactly the opposite is the case (Supplementary Table 2). Given the long T1 and low MTR for those structures compared to other GM, the high MRI signal must be attributed to abundant water protons interacting with any T1-shortening paramagnetic ions rather than to abundant T1-shortening molecules. It is not the T1-relaxation but the proton density that determines the in vivo MT-MRI contrast within the brain (Figs 2, 3). Theoretically (c.f., equations in Methods section), T1-shortening plays a role, but the MRI signal intensity is dominated by M0. In this regard, low MT ratios and high T1 and T2 values of SN, LC, and A2 as well as of caudate nucleus and putamen (Supplementary Table 2) indicate that these structures have high water content and thus yield high signal intensities in MT-MRI (Supplementary Figs 1, 4). Conversely, high MT ratios and low T1 and T2 values of thalamus, globus pallidus, red nucleus, and subthalamic nucleus (Supplementary Table 2) indicate that these structures have low water content and thus yield low signal intensities in MT-MRI (Supplementary Fig. 1).
More specifically, the similar MRI contrast described for SN and LC in human brain so far has been attributed to a T1-shortening of intracellular water protons induced by neuromelanin27,28. Here we showed that cell assemblies like caudate nucleus and putamen that contain no neuromelanin yield as high intensities as SN and LC. Further, we demonstrated high MRI signal intensities in LC and A2 of 3-week-old mice as well (Fig. 7b-g). Given the lack of neuromelanin in rodents29,30, the high intensities of the catecholaminergic neurons are not attributable to neuromelanin but reflect their high water content. Even when assuming that paramagnetic ions contributed to their high signal intensities, the neuromelanin is unlikely to play a major role. The concentration of neuromelanin Fe in LC (SN) is only about 3.6 (20) ng/mg wet tissue, whereas the concentration of Fe in LC (SN) is as much as about 25 (150) ng/mg wet tissue31. The concentration of neuromelanin Cu in LC (SN) is only about 1.2 (0.4) ng/mg wet tissue, whereas the concentration of Cu in LC (SN) is as much as 31 (16) ng/mg wet tissue.
Conclusions
To summarize, this is the first report about the in vivo MRI visibility of hippocampal and A2 cell assemblies in human as well as of noradrenergic neurons in animals. The generation of image contrast relies upon a simultaneous saturation of extracellular free water protons and lipid-associated water protons, preserving the signals from the water protons that are associated with intracellular paramagnetic ions. The image signal intensity is thus largely attributable to the density of the paramagnetic-ion-associated intracellular water protons and is shown to be unaffected by physiological concentrations of endogenous paramagnetic ions. Only when exogenous Mn2+ ions with their high relaxation enhancement factor are delivered to the brain in high concentration, the signal intensity showed its T1-dependence. Given that the decline of LC neuron numbers and the resulting noradrenalin shortage in brain are associated with aging, dementia, Aβ plaque load, and the progression of Alzheimer’s disease32, it is foreseeable that MRI of noradrenergic neuron groups as well as of the hippocampal cell assemblies in both laboratory animals and humans will play an increasing role in translational biomedical research of neurodegenerative diseases and beyond.
Methods
MRI of human brain and spinal cord
At 3T (Magnetom Prisma, Siemens Healthcare, Erlangen, Germany) transversal MRI (2D FLASH, TR/TE = 863/4.4 ms, pixel bandwidth = 140 Hz, (0.66 mm)2 resolution, 2.5 mm slice thickness, 21 slices, total acquisition = 4 min 35 s) was performed with the use of a 64-channel head coil. An on-resonance flip angle α of 70° was used for T1-weighted MRI while α of 15° was used for proton-density-weighted MRI. For off-resonance irradiation, magnetization transfer (10 ms Gaussian pulse, frequency offset = 1200 Hz, flip angle = 208.5°, amplitude = 27.9 V) and fat saturation were applied at every interleaved slice (every 41 ms) as provided by the manufacturer. T1 mapping33,34 as well as T2 and M0 mapping (Model-based Accelerated T2 Mapping, Siemens) were performed at the same spatial resolution. Regions-of-interests are selected in the frontal subcortical white matter, prefrontal cortex, caudate nucleus, putamen, thalamus, globus pallidus, subthalamic nucleus, red nucleus, and substantia nigra. Regional values are compared to each other and to the mean regional R2* values35,36,37 as well as to the mean regional content of water38,39, iron40, copper41, and manganese42.
For magnitization-transfer MRI of LC and A2, the data were accumulated twice (TR/TE = 863/4.4 ms, total acquisition = 9 min 10 s). The slices are positioned perpendicular to the anterior wall of the fourth ventricle. The LC is observable in the 5–7th slices from the top, while A2 is observable in the 16–18th.
For high-resolution magnetization-transfer MRI of the hippocampal formation and the upper cervical spinal cord, T1-weighted MRI (2D FLASH, α 70°, 0.38 × 0.76 mm2 in-plane resolution, 2.5 mm slice thickness, 11 slices) was performed with moderate echo time (TR/TE = 473/4.4 ms, pixel bandwidth = 140 Hz, two averages, total acquisition = 8 min 49 s) or with prolonged echo time (TR/TE = 715/13.2 ms, pixel bandwidth = 30 Hz, total acquisition = 8 min). For off-resonance irradiation, magnetization transfer (10 ms Gaussian pulse, frequency offset = 1200 Hz, flip angle = 208.5°, amplitude = 27.9 V) and fat saturation were applied at every interleaved slice (every 43 ms and 65 ms, respectively) as provided by the manufacturer.
Calculation of signal intensity in gradient-echo MRI of the brain
In MRI of the brain in vivo, the signal originates exclusively from water protons. With signal contribution from T2 coherence being negligible, the observable magnetization in the steady state of spoiled gradient-echo MRI yields:
with flip angle α, repetition time TR, echo time TE, spin-lattice relaxation rate R1, effective spin-spin relaxation rate R2*, and initial magnetization M0, while the observable magnetization in magnetization-transfer MRI yields
with the observable magnetization in gradient-echo MRI without magnetization transfer So and magnetization-transfer ratio MTR.
Animals and anesthesia
Mice were housed in groups under standard conditions at a temperature of 22 °C and a 12 h light/dark cycle with ad libitum access to standard food and water. A total of 32 mice were used. Firstly, 24 mice (NMRI, 6 male and 18 female, 3–8 weeks old) were used for the optimization of magnetization transfer. Secondly, to elucidate the nature of MRI contrast in the hippocampus, FVB/N mice (n = 2, male, 9 weeks old) were treated with a kainic acid lesion model43. FVB/N mice received a single subcutaneous injection of kainic acid (30 mg/kg, pH 7.3) or placebo (saline). During a subsequent 3 h observation period for behavioral symptoms, the lesioned animal showed signs of epileptic activity, including staring, decreased motility, twitching, rearing, and falling. MRI was performed before administration of kainic acid or placebo as well as 4 days later. Immediately after the second MRI examination, animals were transcardially perfused with neutral phosphate-buffered formalin (10%). Horizontal brain sections were cut at a thickness of 40 μm. Every third section was stained with cresyl violet to determine nerve cell loss. Thirdly, six mice (NMRI, female, 8–12 weeks old) were used for the manganese uptake study.
After induction of anesthesia with 5% isoflurane, animals were intubated with a purpose-built polyethylene endotracheal tube (0.58 mm inner diameter, 0.96 mm outer diameter) and artificially ventilated using an animal respirator (TSE, Bad Homberg, Germany) with a respiratory rate of 25 breaths per minute and an estimated tidal volume of 0.35 ml as previously described44,45,46. The animals were then placed in a prone position on a purpose-built palate holder equipped with an adjustable nose cone. The Göttingen animal bed47 secured a reproducible and reliable fixation of the mouse head and receiver coil in the magnet isocenter. Respiratory movement of the abdomen as well as rectal temperature was monitored by a unit supplied by the manufacturer (Bruker Biospin MRI GmbH, Ettlingen, Germany).
Optimization of magnetization transfer in mouse brain
At 2.35T, MRI measurements were carried out using a 4.7/400 mm magnet (Magnex Scientific, Abingdon, UK) equipped with 200 mT m−1 gradients (Bruker Biospin MRI GmbH, Ettlingen, Germany). RF excitation and signal reception was accomplished with the use of a Helmholtz coil (inner diameter 100 mm) and an elliptical surface coil (inner diameter 20 mm × 14 mm), respectively. For the optimization of MT MRI, an off-resonance Gaussian RF pulse with a duration of 12 ms, a frequency offset of 2200–5000 Hz, and a mean amplitude of 50–200 Hz (flip angle 261°–1045°) was incorporated into a gradient-echo MRI sequence (RF-spoiled 3D FLASH, TR/TE = 30/7.6 ms, flip angle = 10°–30°, field-of-view = 30 × 18.75 × 22.5 mm3, matrix = 256 × 160 × 192 interpolated to 512 × 512 × 512, 8 averages, measuring time = 123 minutes) at 117 µm isotropic resolution. MTR was obtained from acquisitions with and without off-resonance irradiation.
We started with the use of 12 ms off-resonance pulse with mean amplitude of 200 Hz and a frequency offset of 5000 Hz, because this was found to be optimal for magnetization transfer in mouse brain in vivo48. With the use of this off-resonance pulse, we first tried to find out an optimal flip angle for the on-resonance pulse in 3D gradient echo MRI in order to delineate the LC and A2. As shown in Supplementary Table 1a, a flip angle of 22° turned out to be optimal. A flip angle of 18°~22° turned out also to be optimal for 12 ms off-resonance pulse with a mean amplitude of 100 Hz and a frequency offset of 2500 Hz (Supplementary Table 1b). Next, we found out that for the off-resonance pulse with a mean amplitude of 200 Hz, a frequency offset turned out to play no major role within the range between 3000 and 7000 Hz (Supplementary Table 1c). For amplitude of 100 Hz (Supplementary Table 1d), 2500–2800 Hz offset turned out to be optimal. For each respective optimal frequency offsets, the use of a lower amplitude resulted in a lower contrast-to-noise ratio (Supplementary Table 1e,f). The comparison of these two different amplitudes with respective optimal offsets (Supplementary Table 1g) shows that there was no substantial difference between them as far as contrast-to-noise ratio is concerned, because the greater amplitude generally resulted in lower signal-to-noise ratio. The use of the off-resonance pulse with a mean amplitude of 200 Hz and a frequency offset of 5000 Hz yielded the mean signal-to-noise ratio of LC to be 33.9–36.0 and of A2 to be 35.2–36.4, while with a mean amplitude of 100 Hz and a frequency offset of 2500 Hz yielded the mean signal-to-noise ratio of LC to be 36.7–39.2 and of A2 to be 37.8–39.6 (Supplementary Table 1a–g). There was also no difference between males and females (Supplementary Table 1h).
T1 mapping of mouse brain
T1 relaxation times of LC and A2 were determined using a spin-echo multiple TR saturation recovery method (TE 16 ms, field of view 30 mm × 30 mm, matrix 256 × 256, in-plane resolution 117 µm × 117 µm, slice thickness 234 µm, five slices). TR was varied through 200, 400, 800, 1500, 3000, 5000 ms, six averages, and the total measuring time 209 min. Coronal MRI slices were selected to include LC and A2. The mean MRI signal intensity of each pixel was fitted for each TR value with the standard single exponential function to yield T1 values.
Manganese uptake study
Each mouse received manganese chloride (0.12 mmol/kg body weight) via subcutaneous injection. The mice were returned to a chamber with unlimited access to food and water. Before and 3 days after Mn2+ injection, MRI measurements were carried out at 2.35T. An off-resonance RF irradiation with a frequency offset of 5 kHz and a mean amplitude of 200 Hz (flip angle 1045°) was incorporated into a T1-weighted gradient-echo MRI sequence (RF-spoiled 3D FLASH, TR/TE 30/7.6 ms, α 25°) at 117 µm isotropic resolution. For evaluation of signal intensities, regions-of-interest were selected in LC, other nerve cell assemblies (hippocampal formation, habenula, cerebellar cortex), cerebral cortex, and in the white matter (corpus callosum, cerebellar white matter).
Mouse brain MRI evaluation
For evaluation of signal intensities, anatomically defined cross-sections were obtained from the original 3D MRI data sets by multiplanar reconstructions using software supplied by the manufacturer (Paravision 5.0, Bruker Biospin MRI GmbH, Ettlingen, Germany). The plane of the anterior commissure – posterior commissure served as a reference for the selection of standardized sections to facilitate comparisons with minimized intra- and inter-individual variability. For LC or A2, a rectangular region-of-interest of 6 pixels was taken in the center of the structures. For the brainstem, a circular region-of-interest of 1004 pixels was taken in the brainstem between LC and A2. SNR was defined as the mean MRI signal intensity divided by the standard deviation of the noise. The contrast-to-noise ratio was obtained by taking the difference between the SNR values. The analysis followed a strategy previously developed for intra-individual comparisons of MR images obtained after manganese administration45. Statistical evaluation was performed using SPSS® (version 21.0, IBM®) and Microsoft Excel software. Significant differences between two groups of data were determined by the Mann-Whitney’s U-test.
Compliance with Ethical Standards
All procedures involving human participants in this study were approved by the institutional committee of the Georg-August-Universität Göttingen and performed in accordance with the ethical standards of the institutional and national research committee and with the 1964 Helsinki declaration and its later amendments. All participants gave written informed consent before each examination.
All animal experiments were performed in accordance with German animal protection laws after approval by the responsible governmental authority (Landesamt für Verbraucherschutz und Ernährungssicherheit, Braunschweig, Germany) as well as by the institutional review board for animal protection.
Third party rights
Images and drawings were taken or created by an author of the paper.
Data Availability
The datasets generated during and/or analysed during the current study are available from the corresponding author on reasonable request.
References
Schoeniger, J. S., Aiken, N., Hsu, E. & Blackband, S. J. Relaxation-time and diffusion NMR microscopy of single neurons. J Magn. Reson. B 103, 261–273 (1994).
Koenig, S. H., Brown, R. D., Spiller, M. & Lundbom, N. Relaxometry of brain: why white matter appears bright in MRI. Magn. Reson. Med. 14, 482–495 (1990).
Watanabe, T., Frahm, J. & Michaelis, T. Cell layers and neuropil: contrast‐enhanced MRI of mouse brain in vivo. NMR Biomed. 26, 1870–1878 (2013).
Henkelman, R. M., Stanisz, G. J. & Graham, S. J. Magnetization transfer in MRI: a review. NMR Biomed. 14, 57–64 (2001).
Prohaska, J. R. Functions of trace elements in brain metabolism. Physiol. Rev. 67, 858–901 (1987).
Wood, J. H. In Handbook of Neurochemistry: Chemical and cellular architecture. 415–419 (Plenum Press, 1982).
Rosene, D. L. & Van Hoesen, G. W. In Cerebral Cortex. Vol. 2. 387–399 (Plenum Press, 1987).
Janeczek, M. et al. Variations in acetylcholinesterase activity within human cortical pyramidal neurons across age and cognitive trajectories. Cereb. Cortex 1, 1–9 (2017).
Mesulam, M. & Geula, C. Acetylcholinesterase‐rich pyramidal neurons in the human neocortex and hippocampus: Absence at birth, development during the life span, and dissolution in Alzheimer’s disease. Ann. Neurol. 24, 765–773 (1988).
Ben-Ari, Y. & Cossart, R. Kainate, a double agent that generates seizures: two decates of progress. Trends Neurosci. 23, 580–587 (2000).
Dahlström, A. & Fuxe, K. Evidence for the existence of monoamine-containing neurons in the central nervous system. Demonstration of monoamines in the cell bodies of brain stem neurons. Acta Physiol. Scand. Suppl. 232, 1–55 (1964).
Moore, R. Y. & Bloom, F. E. Central catecholamine neuron systems: anatomy and physiology of the dopamine systems. Ann Rev Neurosci. 1, 129–169 (1978).
Watanabe, T., Frahm, J. & Michaelis, T. Reduced intracellular mobility underlies manganese relaxivity in mouse brain in vivo: MRI at 2.35 and 9.4 T. Brain Struct. Funct. 220, 1529–1538 (2015).
Fralix, T. A., Ceckler, T. L., Wolff, S. D., Simon, S. A. & Balaban, R. S. Lipid bilayer and water proton magnetization transfer: effect of cholesterol. Magn. Reson. Med. 18, 214–223 (1991).
Kraft, K. A., Fatouros, P. P., Clarke, G. D. & Kishore, P. R. S. An MRI phantom material for quantitative relaxometry. Magn. Reson. Med. 5, 555–562 (1987).
Eisinger, J., Shulman, R. G. & Blumberg, W. E. Relaxation enhancement by paramagnetic ion binding in deoxyribonucleic acid solutions. Nature 192, 963–964 (1961).
Burton, D. R., Forsen, S., Karlstrom, G. & Dwek, R. A. Proton relaxation enhancement (PRE) in biochemistry: a critical survey. Prog. Nucl. Magn. Reson. Spectrosc. 13, 1–45 (1979).
Watanabe, T., Frahm, J. & Michaelis, T. Myelin mapping in the central nervous system of living mice using contrast-enhanced magnetization transfer MRI. Neuroimage 63, 812–817 (2012).
Vymazal, J., Brooks, R. A., Bulte, J. W. M., Gordon, D. & Aisen, P. Iron uptake by ferritin: NMR relaxometry studies at low iron loads. J. Inorg. Biochem. 71, 153–157 (1998).
Double, K. L., Maywald, M., Schmittel, M., Riederer, P. & Gerlach, M. In vitro studies of ferritin iron release and neurotoxicity. J. Neurochem. 70, 2492–2499 (1998).
Gossuin, Y., Muller, R. N. & Gillis, P. Relaxation induced by ferritin: a better understanding for an improved MRI iron quantification. NMR Biomed. 17, 427–432 (2004).
Schlief, M. L., Craig, A. M. & Gitlin, J. D. NMDA receptor activation mediates copper homeostasis in hippocampal neurons. J. Neurosci. 25, 239–246 (2005).
Dodani, S. C. et al. Calcium-dependent copper redistributions in neuronal cells revealed by a fluorescent copper sensor and X-ray fluorescence microscopy. Proc. Nat. Acad. Sci. USA 108, 5980–5985 (2011).
Que, E. L., Domaille, D. W. & Chang, C. J. Metals in neurobiology: probing their chemistry and biology with molecular imaging. Chem. Rev. 108, 1517–1549 (2008).
Lutsenko, S., Bhattacharjee, A. & Hubbard, A. L. Copper handling machinery of the brain. Metallomics 2, 596–608 (2010).
Gore, J. In Magnetic Resonance Imaging of the Brain and Spine. 69–85 (Raven Press, 1991).
Sasaki, M. et al. Neuromelanin magnetic resonance imaging of locus ceruleus and substantia nigra in Parkinson’s disease. Neuroreport 17, 1215–1218 (2006).
Clewett, D. et al. Neuromelanin marks the spot: identifying a locus coeruleus biomarker of cognitive reserve in healthy aging. Neurobiol. Aging 37, 117–126 (2016).
Barden, H. & Levine, S. Histochemical observations on rodent brain melanin. Brain Res. Bulletin 10, 847–851 (1983).
Schroeder, R. L., Double, K. L. & Gerber, J. P. Using Sepia melanin as a PD model to describe the binding characteristics of neuromelanin–A critical review. J. Chem. Neuroanat. 64, 20–32 (2015).
Zecca, L. et al. The role of iron and copper molecules in the neuronal vulnerability of locus coeruleus and substantia nigra during aging. Proc. Natl. Acad. Sci.USA 101, 9843–9848 (2004).
Kummer, M. P. et al. Ear2 deletion causes early memory and learning deficits in APP/PS1 mice. J. Neurosci. 34, 8845–8854 (2014).
Wang, X. et al. Single-shot multi-slice T1 mapping at high spatial resolution – inversion-recovery FLASH with radial undersampling and iterative reconstruction. Open Med. Imaging J. 9, 1–8 (2015).
Wang, X. et al. Model-based T1 mapping with sparsity constraints using single-shot inversion-recovery radial FLASH. Magn. Reson. Med., https://doi.org/10.1002/mrm.26726 (2017).
Tan, Z. Advances in Real-Time Phase-Contrast Flow MRI and Multi-Echo Radial FLASH. Dissertation. University of Göttingen, 73–76 (2016).
Wansapura, J. P., Holland, S. K., Dunn, R. S. & Ball, W. S. NMR relaxation times in the human brain at 3.0 tesla. J. Magn. Reson. Imag. 9, 531–538 (1999).
Yao, B. et al. Susceptibility contrast in high field MRI of human brain as a function of tissue iron content. Neuroimage 44, 1259–1266 (2009).
Gelman, N., Ewing, J. R., Gorell, J. M., Spickler, E. M. & Solomon, E. G. Interregional variation of longitudinal relaxation rates in human brain at 3.0 T: relation to estimated iron and water contents. Magn. Reson. Med. 45, 71–79 (2001).
Wood, J. H. In Handbook of Neurochemistry: Chemical and cellular architecture. 415–419 (Plenum Press, 1982).
Hallgren, B. & Sourander, P. The effect of age on the non‐haemin iron in the human brain. J. Neurochem. 3, 41–51 (1958).
Warren, P., Earl, C. & Thompson, R. The distribution of copper in human brain. Brain 83, 709–717 (1960).
Duflou, H., Maenhaut, W. & De Reuck, J. Regional distribution of potassium, calcium, and six trace elements in normal human brain. Neurochem. Res. 14, 1099–1112 (1989).
Schauwecker, P. E. & Steward, O. Genetic determinants of susceptibility to excitotoxic cell death: implications for gene targeting approaches. Proc. Natl. Acad. Sci. USA 94, 4103–4108 (1997).
Schulz, H. et al. Respiratory mechanics in mice: strain and sex specific differences. Acta Physiol. Scand. 174, 367–75 (2002).
Watanabe, T. et al. In vivo 3D MRI staining of the mouse hippocampal system using intracerebral injection of MnCl2. Neuroimage 22, 860–867 (2004).
Watanabe, T., Frahm, J. & Michaelis, T. Amide proton signals as pH indicator for in vivo MRS and MRI of the brain—Responses to hypercapnia and hypothermia. Neuroimage 133, 390–398 (2016).
Tammer, R., Boretius, S., Michaelis, T. & Pucher-Diehl, A. European patent No. 2174154, US patent No. 8,334,698 B2 (2007).
Natt, O., Watanabe, T., Boretius, B., Frahm, J. & Michaelis, T. Magnetization transfer MRI of mouse brain reveals areas of high neural density. Magn. Reson. Imaging 21, 1113–1120 (2003).
Mikula, S., Trotts, I., Stone, J. M. & Jones, E. G. Internet-enabled high-resolution brain mapping and virtual microscopy. Neuroimage 35, 9–15 (2007).
Warnecke, M., Oster, H. & Revelli, J. P. Alvarez-Bolado& G., Eichele, G. Abnormal development of the locus coeruleus in Ear2 (Nr2f6)-deficient mice impairs the functionality of the forebrain clock and affects nociception. Genes Dev. 19, 614–625 (2005).
Acknowledgements
The authors wish to thank Dr. Thomas Michaelis and Dr. Dirk Voit for helpful discussion.
Author information
Authors and Affiliations
Contributions
T.W. designed the study, performed the experiments, evaluated the data, and wrote the manuscript. X.W. and J.F. developed the T1-mapping method at 3T. Z.T. and X.W. contributed significantly to the acquisition and the analysis of the human MRI data. J.F. finalized the manuscript.
Corresponding author
Ethics declarations
Competing Interests
The authors declare no competing interests.
Additional information
Publisher’s note: Springer Nature remains neutral with regard to jurisdictional claims in published maps and institutional affiliations.
Supplementary information
Rights and permissions
Open Access This article is licensed under a Creative Commons Attribution 4.0 International License, which permits use, sharing, adaptation, distribution and reproduction in any medium or format, as long as you give appropriate credit to the original author(s) and the source, provide a link to the Creative Commons license, and indicate if changes were made. The images or other third party material in this article are included in the article’s Creative Commons license, unless indicated otherwise in a credit line to the material. If material is not included in the article’s Creative Commons license and your intended use is not permitted by statutory regulation or exceeds the permitted use, you will need to obtain permission directly from the copyright holder. To view a copy of this license, visit http://creativecommons.org/licenses/by/4.0/.
About this article

Cite this article
Watanabe, T., Wang, X., Tan, Z. et al. Magnetic resonance imaging of brain cell water. Sci Rep 9, 5084 (2019). https://doi.org/10.1038/s41598-019-41587-2
Received:
Accepted:
Published:
DOI: https://doi.org/10.1038/s41598-019-41587-2
This article is cited by
-
Use of machine learning to improve the estimation of conductivity and permittivity based on longitudinal relaxation time T1 in magnetic resonance at 7 T
Scientific Reports (2023)
-
Locus coeruleus degeneration and cerebellar gray matter changes in essential tremor
Journal of Neurology (2023)
-
CYP2C19 expression modulates affective functioning and hippocampal subiculum volume—a large single-center community-dwelling cohort study
Translational Psychiatry (2022)
-
Unraveling the contributions to the neuromelanin-MRI contrast
Brain Structure and Function (2020)
Comments
By submitting a comment you agree to abide by our Terms and Community Guidelines. If you find something abusive or that does not comply with our terms or guidelines please flag it as inappropriate.
