
Abstract
The canonical approach to exploring brain-behaviour relationships is to group individuals according to a phenotype of interest, and then explore the neural correlates of this grouping. A limitation of this approach is that multiple aetiological pathways could result in a similar phenotype, so the role of any one brain mechanism may be substantially underestimated. Building on advances in network analysis, we used a data-driven community-clustering algorithm to identify robust subgroups based on white-matter microstructure in childhood and adolescence (total N = 313, mean age: 11.24 years). The algorithm indicated the presence of two equal-size groups that show a critical difference in fractional anisotropy (FA) of the left and right cingulum. Applying the brain-based grouping in independent samples, we find that these different ‘brain types’ had profoundly different cognitive abilities with higher performance in the higher FA group. Further, a connectomics analysis indicated reduced structural connectivity in the low FA subgroup that was strongly related to reduced functional activation of the default mode network. These results provide a proof-of-concept that bottom-up brain-based groupings can be identified that relate to cognitive performance. This provides a first demonstration of a complimentary approach for investigating individual differences in brain structure and function, particularly for neurodevelopmental disorders where researchers are often faced with phenotypes that are difficult to define at the cognitive or behavioural level.
Introduction
Differential psychology is an influential strand of modern psychology, concerned with identifying dimensions upon which individuals differ. This approach has been applied at different points across development, from childhood to old adulthood, and has been central to our understanding of typical and atypical behaviour and psychopathology1,2. Our understanding of the brain mechanisms associated with these differences is based almost entirely on mapping them via correlations with brain differences. This has established many consistent and significant brain-behaviour relationships in health and disease. But understanding neurobiology only through our prior understanding of cognition or behaviour has drawbacks. Firstly, our understanding of the neurobiology is entirely constrained by the choice of cognitive measures. Secondly, brain-behaviour relationships established using this logic are difficult to replicate3,4. This partly reflects the dependency on task selection, which differs across research groups and may only partially tap the dimensions of interest. But more critically, multiple aetiological pathways could lead to disorders with superficially similar phenotypes5,6. In short, grouping purely by cognitive or behavioural phenotype is no guarantee of common underlying neurobiology.
At present, there are few alternatives to complement this standard approach. Applying a data-driven clustering method that has proven useful for identifying consistent clusters of behavioural or cognitive performance7,8,9,10,11, the current study shows that it is possible to group individuals by brain organization itself rather than by cognitive or behavioural phenotype. That is, we identified stable subgroups of individuals with similar profiles of white matter microstructure across 20 major white matter tracts using a consensus community clustering algorithm. In doing so, we hoped to identify the elements of neurobiology most critical for dividing individuals into their respective subgroups and their wider functional consequences. Identifying mechanisms of brain difference a priori has the potential to highlight key organizational principles that we may never capture by only looking for neural correlates of messy pre-defined phenotypes.
The Importance of White Matter in Cognitive Development
White matter makes up around half of the human brain and plays a critical role as the main conductor of neural signalling. White matter also shows prolonged post-natal changes that extend into the third decade of life12 with pronounced development during mid-childhood and adolescence13. In humans, the method of choice for measuring differences in white matter in vivo is diffusion-weighted imaging (DWI). It quantifies the degree to which diffusion of water molecules is restricted by the tightly-packed parallel axons that make up white matter. Differences in DWI-derived measures have been found to relate to individual differences across a range of cognitive domains. For instance, language processing is related to the maturation of the arcuate fasciculus, a white matter tract that connects the frontal and superior temporal lobe14; working memory performance is associated with the integrity of the superior longitudinal fasciculus, a tract connecting frontal and parietal regions15; executive control is linked to the integrity of frontal and parietal connections alongside additional connections to motor control regions16. Differences in white matter organisation have also been identified in various neurodevelopmental disorders. For instance, dyslexia is associated with a reduced organisation in white matter pathways along the left dorsal and ventral language pathways17; children with Attention Deficit Hyperactivity Disorder (ADHD) show reduced white matter organisation of the corpus callosum and major tracts of the right hemisphere18, and reduced integrity of connections between the limbic system and frontal and temporal cortex has been reported for autism spectrum disorder (ASD)19. In summary, DWI measures of white matter organisation are sensitive to typical variation in cognitive abilities and show differences in common neurodevelopmental disorders.
Using Community Detection to Identify Subgroups with Similar White Matter Organisation
Many different methods have been proposed for identifying patterns of similarity between data points20, i.e. clustering. These methods differ in the definition of similarity between data points, e.g. correlation or Euclidean distance, and the definition of a clusters, e.g. similar distance from a cluster centre or shared variance. There is no general consensus regarding which clustering assumptions are most appropriate for a particular application. In the absence of such guidance, the current study applied a method from network science that has proven useful for distinguishing individual differences in behavioural and cognitive profiles7,8,9. Network science provides a versatile framework for any data that can be described as a collection of entities (nodes) that share quantifiable relationships (edges)21. Mathematical tools can be applied for the analysis of these networks. One area of intense research is the identification of highly-connected subdivision within the network called communities in analogy to communities within a social network. The community detection approach is able to detect subgroups of participants that are the most similar to each other while being as distinct as possible from other subgroups. Network science tools for community detection have been successfully used to identify social groups in phone networks and to identify brain regions with similar function22. This approach has also been successfully applied to distinguish differences in behaviour within heterogeneous groups, such as subgroups of neuropsychological function in typically-developing children8 and subgroups of executive function-related behavioural problems in children who struggle in school9. In summary, community-clustering provides a promising method to identify subgroups of individuals with similar characteristics. In the current analysis, community detection was applied to detect subgroups of participants with similar microstructure in 20 major tracts.
Participants and Methods
Please see Fig. 1 for an overview of the different parts of the analysis.
Overview of the parts of the analysis.
Participants
The participants were drawn from three separate studies of development. The participants included in each study are characterized in the following sections.
The Nathan-Kline Institute Rockland Sample (NKI-RS)
The enhanced Nathan Kline Institute-Rockland Sample (NKI-RS) is an ongoing, institutionally-centred endeavour aimed at creating a large-scale community sample of participants across the lifespan. Details about the sample are described on the NKI website (http://fcon_1000.projects.nitrc.org/indi/enhanced/). NKI sample data is available to researchers upon request. For the current study, data from all participants who had structural imaging (T1, diffusion-weighted) and age information available was requested (date of data access: 18 July 2017). The study was approved by the NKI institutional review board and all adult and child subjects provided informed consent23. Original Ethical Review and consent procedures for the NKI-Rockland Sample were described as follows: “Institutional Review Board Approval was obtained for this project at the Nathan Kline Institute (Phase I #226781 and Phase II #239708) and at Montclair State University (Phase I #000983A and Phase II #000983B). Written informed consent was obtained for all study participants. Written consent and assent was also obtained from minor/child participants and their legal guardian”23.
Centre for Attention, Learning, and Memory (CALM)
For this sample, children aged between 5 and 18 years were recruited on the basis of ongoing problems in attention, learning, language and memory, as identified by professionals working in schools or specialist children’s services in the community. Following an initial referral, the CALM staff then contacted referrers to discuss the nature of the children’s problems24. If difficulties in one or more areas of attention, learning, language or memory were indicated by the referrer, the family were invited to the CALM clinic at the MRC Cognition and Brain Sciences Unit in Cambridge for a 3-hour assessment. This assessment included the cognitive assessments reported here. Children were excluded if they had significant problems with vision or hearing that were not corrected or if they did not have English as a native language. Written consent was obtained from parents and verbal assent from children. Families were also invited to participate in MRI scanning on a separate visit. Participation in the MRI part of the study was optional and required separate parental consent and child assent. Contra-indications for MRI were metal implants, claustrophobia, or distress during a practice session with a realistic mock MRI scanner. This study was approved by the National Health Service (NHS) Health Research Authority NRES Committee East of England (REC approval reference: 13/EE/0157, IRAS 127675) and was conducted in accordance with the Declaration of Helsinki.
Attention and Cognition in Education (ACE)
This sample was collected for a study investigating the neural, cognitive, and environmental markers of risk and resilience in children. Children between 7 and 12 years attending mainstream school in the UK, with normal or corrected-to-normal vision or hearing, and no history of brain injury were recruited via local schools and through advertisement in public places (childcare and community centres, libraries). Participating families were invited to the MRC Cognition and Brain Sciences Unit for a 2-hour assessment, which included the cognitive assessments reported here, and structural MRI scanning. Participants received monetary compensation for taking part in the study. This study was approved by the Psychology Research Ethics Committee at the University of Cambridge (Reference: Pre.2015.11) and was carried out in accordance with the Declaration of Helsinki. Parents or guardians provided written informed consent and children verbal assent.
Cognitive assessments
Procedure
All children for whom we have cognitive data were tested on a one-to-one basis with a researcher in a dedicated child-friendly testing room at the MRC CBU. The battery included a wide range of standardized assessments of learning and cognition. Regular breaks were included throughout the session. Testing was split into two sessions for children who struggled to complete the assessments in one sitting. Measures relating a cognitive performance across different domains are included in this analysis. Tasks that were based on reaction times were not included in this analysis due to their different psychometric properties compared to the included tasks that were based on performance measures.
Fluid Intelligence
Fluid intelligence was assessed on the Reasoning task of the Wechsler Abbreviated Scale of Intelligence, 2nd edition25. Both children in the CALM and ACE sample completed this assessment.
Working Memory
The Digit Recall, Backward Digit Recall, Dot Matrix, and Mr. X task of the Automatic Working Memory Assessment (AWMA)26 were administered individually. In Digit Recall, children repeat sequences of single-digit numbers presented in an audio format. In Backward Digit Recall, children repeat the sequence in backwards order. These tasks were selected to engage verbal short-term and working memory, respectively. For the Dot Matrix task, the child was shown the position of a red dot for 2 seconds in a series of four by four matrices and had to recall this position by tapping the squares on the computer screen. In the Mr X task, the child retains spatial locations whilst performing interleaved mental rotation decisions. These tasks were selected to engage visual short-term and working memory, respectively. These assessments were the same in the CALM and ACE sample.
Vocabulary
For the CALM sample, the Peabody Picture Vocabulary Test, Fourth Edition (PPVT-4)27 was used to assess receptive vocabulary knowledge. Children were required to select one of four pictures showing the meaning of a spoken word. In the ACE sample, the Vocabulary subtest of the Wechsler Abbreviated Scale of Intelligence, 2nd edition25 was used. For this task, children had to define words that were presented verbally and visually, and correct definitions were scored.
Long-Term Memory
For the CALM sample, the Stories task of the Children’s Memory Scale28 was used to assess long-term memory. Children were read two short stories and were asked to recall these stories after a delay of 10 min. No long-term memory task was used in the ACE sample.
MRI data acquisition
All three large-scale datasets contributed to the MRI analysis. The datasets were selected because they included similar neuroimaging data (diffusion-weighted data with a high number of directions).
NKI-RS
Subjects in the NKI sample underwent a scan session using a Siemens TrioTM 3.0T MRI scanner. T1-weighted images were acquired a magnetization-prepared rapid gradient echo (MPRAGE) sequence with 1 mm isotropic resolution. Diffusion scans were acquired with an isotopic set of gradients with 64 directions using a weighting factor of b = 1000 s * mm−2 and an isotropic resolution of 2 mm. Details about the scan sequences are described elsewhere (http://fcon_1000.projects.nitrc.org/indi/enhanced/mri_protocol.html).
CALM and ACE
Magnetic resonance imaging data were acquired at the MRC Cognition and Brain Sciences Unit, Cambridge U.K., on the Siemens 3 T Tim Trio system (Siemens Healthcare, Erlangen, Germany) with a 32-channel quadrature head coil. For ACE, the imaging protocol consisted of a T1-weighted anatomical sequence and a diffusion-weighted sequence. The CALM protocol also included a resting-state functional MRI (rs-fMRI) scan. The T1-weighted anatomical images were acquired using a 3D Magnetisation Prepared Rapid Acquisition Gradient Echo (MP-RAGE) sequence with 1 mm3 image resolution and covered the whole brain (echo time: 2.98 ms; repetition time: 2250 ms). The diffusion sequence consisted of 60 axial images that covered the whole brain with 2 mm3 resolution and used non-collinear directions at a weighting factor of b = 1000 s * mm−2 and an interleaved T2-weighted image at b = 0 s * mm−2 (echo time: 90 ms; repetition time: 8400 ms). For functional scans, a total of 270 T2*-weighted whole-brain echo planar images (EPIs) were acquired (time repetition[TR] = 2 s; time echo [TE] = 30 ms; flip angle = 78 degrees, 3 × 3 × 3 mm). During this scan, participants were instructed to lie still with their eyes closed and not fall asleep.
MRI Quality Control
Participant movement may significantly affect the quality of MRI data and may bias statistical comparisons. The quality of the diffusion-weighted and resting-state data were assessed by calculating the displacement between subsequent volumes in the sequence. Only dwi data with between-volume displacement below 3 mm and resting-state data with displacement below 0.5 mm were included in the analysis (see Table 1 for attainment). Further, all T1-weighted images and fractional anisotropy (FA) maps were visually inspected by a trained researcher (J.B.) to remove low quality scans. For ACE and CALM, several steps were taken during data acquisition to minimize participant movement. Children were instructed to lie still and were trained to do so in a realistic mock scanner prior to the actual scan.
Microstructural integrity of major white matter tracts
This analysis aimed to identify white matter tracts that show robust inter-individual differences during development (see Fig. 2A). Diffusion-weighted images were pre-processed to create a brain mask based on the b0-weighted image (FSL BET)29 and to correct for movement and eddy current-induced distortions (eddy)30. Subsequently, the diffusion tensor model was fitted and fractional anisotropy (FA) maps were calculated (dtifit). Images with a between-image displacement greater than 3 mm as indicated by FSL eddy were excluded from further analysis. All steps were carried out with FSL v5.0.9 and were implemented in a pipeline using NiPyPe v0.13.031. To extract FA values for major white matter tracts, FA images were registered to the FMRIB58 FA template in MNI space using symmetric diffeomorphic image registration (SyN) as implemented in ANTS v1.932. Visual inspection indicated good image registration for all participants. Subsequently, binary masks from a white matter atlas in MNI space33 were applied to extract FA values for 20 major white matter tracts33. An additional analysis was carried out to account for crossing fibres by calculating Generalized FA (GFA)34, from a constant solid angle model (details see connectome processing).

(A) Illustration of processing steps to obtain estimates of similarity between individuals across major white matter tracts. (B) Overview of processing steps to derive structural connectivity of the cingulum. (C) Illustration of the ROI used for tractography of the cingulum. The ROI is marked with a dotted line on consecutive FA maps coloured according to the direction of diffusion. The left side of each figure shows the FA values.
Accounting for differences in age and gender
The current study aimed to identify important features of individual differences in brain white matter and then investigate potential cognitive differences in independent samples. In order to account for differences in the age and gender composition between samples, the current study focused on age- and gender-invariant features of white matter. To account for age- and gender-related effect, age (linear, squared) and gender were regressed from the FA values of each tract. Further, FA values were scaled to zero-mean and unit variance to account for differences in absolute FA values arising from different scanning protocols.
Community detection
Community detection is an optimisation clustering method that aims to identify nodes within a network that are more closely connected to each other than the rest of the network. In the current analysis, the networks represented the child-by-child Pearson correlations across the FA values for the 20 white matter tracts, i.e. the correlation of FA across all tracts between children was calculated to create the child-by-child correlation matrix (see Fig. 2A).
Here, we employed the Louvain method first described by Blondel et al.35, because it has been found to provide robust community solutions in studies comparing different algorithms36 and because it has been successfully employed to investigate heterogeneity in cognition and behaviour before7,8,9. The current study used an extension of the Louvain method by Rubinov and Sporns37 that can incorporate negative edge weights as implemented in the Brain Connectivity Toolbox (https://sites.google.com/site/bctnet/ accessed August 2017). Initially, each node, here participant, is assigned to its own community. Subsequently, communities are merged across iterations if merging increases the quality index (Q), which quantifies the separation of communities and their internal consistency. The formal definition as described in Rubinov and Sporns38 is as follows: “The connection between nodes i and j with positive weight is \({w}_{ij}^{+}\in (0,1]\) and with negative weight is \({w}_{ij}^{-}\in [\,-\,1,0)\). The total sum of all positive connections is \({v}^{+}=\sum _{ij}\,{w}_{ij}^{+}\) and all negative connections is \({v}^{-}=\sum _{ij}\,{w}_{ij}^{-}\). The strength of the node i is \({s}_{i}^{\pm }=\sum _{j}\,{w}_{ij}^{\pm }\). The chance-expected within-module connection weight is \({e}_{ij}^{+}=\frac{{s}_{i}^{+}{s}_{j}^{+}}{{v}^{+}}\) for positive connections and \({e}_{ij}^{-}=\frac{{s}_{i}^{-}{s}_{j}^{-}}{{v}^{-}}\) for negative connections. \({\delta }_{{M}_{i}{M}_{j}}\) is 1 when i and j are in the same module and 0 otherwise. The quality index is defined as \(Q=\frac{1}{{v}^{+}}\sum _{ij}\,({w}_{ij}^{+}-{e}_{ij}^{+})\,{\delta }_{{M}_{i}{M}_{j}}-\frac{1}{{v}^{+}+{v}^{-}}\sum _{ij}\,({w}_{ij}^{-}-{e}_{ij}^{-})\,{\delta }_{{M}_{i}{M}_{j}}\)” [paraphrased quote].
Due to the non-deterministic nature of the algorithm, it may provide different solutions on different runs. Lancichinetti and Fortunato39 provide a consensus community method to obtain a stable solution. In an initial step, an average community solution across 100 instantiations of the community clustering algorithm is generated. Then, the community clustering is further repeated until there is not change between successive iterations.
We tested the ability of the algorithm to resolve clusters in simulated networks with a known community structure under different conditions including varying within- and between-community connection strength and with added noise. These results are available elsewhere9. The parameters of within- and between-community connection strength in the participant-by-participant correlation network in the current study fell within the range that can be reliably resolved according to our simulations.
To provide a comparison with an alternative clustering method, we compared the consensus community clustering solution to solutions provided by agglomerative clustering as implemented in sklearn v0.19.240. Pearson correlation was used as the affinity metric for agglomerative clustering. The agglomerative clustering by itself does not optimize the number of clusters. Instead, we used the number of clusters that maximized the silhouette coefficient41. Further, there are several alternative linkage methods to merge clusters, specifically Ward, average, maximal, and single linkage. Across all linkage definition, the silhouette coefficient was maximal with two clusters (k = 2). We compared the agreement between the consensus community clustering solution with agglomerative clustering at k = 2 for all linkage definitions.
Applying the community solution to other samples
In order to relate the grouping identified in the discovery sample (NKI) to other samples (ACE, CALM), we assigned participants to their age-regressed cingulum FA values fell within the 5–95%ile confidence interval of C1 or C2 in the NKI sample. Participants who fell outside of both ranges were labelled as C0. We further investigated an optimal cingulum-based split for generalizable prediction of behavioural scores. For this purpose, we employed a hold-out cross-validation procedure. The data in each sample were split into a training, a test, and a validation sample of equal size. In the test set, we assigned the participants to one of the groups identified in the discovery sample (NKI) according to the strength of their correlation with either group. The cut-off for correlation strength was tuned to maximize generalizability in the test set. Finally, we estimated how predictive these assignments were of cognitive differences in the validation set and determined the optimal percentile split for age-regressed cingulum FA. The performance of behavioural prediction was measured as the percentage of participants who were accurately predicted to perform above or below the median of the distribution based on their group assignment. For statistical analysis, we compared the performance of this behavioural prediction to a random group assignment with 1000 permutations.
Tractography of the cingulum
To foreshadow our results, the clustering algorithm identified the cingulum as critical for determining subgroup membership. We subsequently followed this up with tractography. For the tractography, a virtual in-vivo dissection approach was applied42 (see Fig. 2B for an overview of the processing steps). For this purpose, MRI scans were converted to compressed NIfTI-1 format with the dcm2nii tool (http://www.mccauslandcenter.sc.edu/mricro/mricron/dcm2nii.html). Subsequently, the images were submitted to the DiPy v0.8.0 implementation43 of a non-local means de-noising algorithm44 to boost signal-to-noise ratio. Next, a brain mask of the b0 image was created using the brain extraction tool (BET) of the FMRIB Software Library (FSL) v5.0.8. Motion and eddy current correction was applied to the masked images using FSL routines. Finally, fractional anisotropy maps were calculated using FSL dtifit45. A constant solid angle (CSA) model as implemented in DiPy was fitted to the diffusion-weighted images with a maximum harmonic order of 8. Next, we created a whole-brain connectome through probabilistic tractography with 8 streamline seeds in all voxels with a GFA >0.1, a step size 0.5, and a maximum number of 2 crossing fibres per voxel. The cingulum in the left and right hemisphere was reconstructed in the native space of each participant by drawing a single region of interest (ROI) on 10–15 consecutive axial slices that followed the anatomy of the cingulum as described in42 (see Fig. 2C). To check the reliability of the cingulum tractography, two researchers performed tractography independently on 40 datasets. The spatial correlation between the density maps indicated very good inter-rater agreement (left: mean = 0.95, SE = 0.005, range = 0.86–0.990; right: mean = 0.95, SE = 0.005, range = 0.87–0.990).
Structural connectivity of the cingulum
To estimate the structural connectivity of the cingulum, streamlines included in the cingulum tractography that intersected with cortical and subcortical ROIs were counted. The ROIs were defined using the T1-weighted anatomical images. For this purpose, the T1-weighted images were submitted to a preprocessing pipeline that adjusted the field of view (FSL robustfov), corrected local noise (DiPy non-local means denoising), and created a brain mask (Advanced Normalization Tools (ANTs) v1.946 BrainExtraction). The preprocessed images were then submitted to the FreeSurfer v5.3 recon-all pipeline (http://surfer.nmr.mgh.harvard.edu). Regions of the Desikan-Killiany atlas47 with 32 cortical and 17 subcortical (amygdala, brain stem, caudate, cerebellum, hippocampus, nucleus accumbens, pallidum, putamen, thalamus) were used as ROIs. The surface-based representation of the cortical ROIs was transformed to volume representation using FreeSurfers’ aparc2aseg tool. To create an intersection between the ROIs and the white matter streamlines, we expended the cortical parcellation 2 mm into the subcortical white matter using an in-house implementation. Next, we calculated the transformation between the T1-weighted anatomical image and the diffusion-weighted image using FreeSurfers’ bbregister and applied the transformation to the ROI volume to move the ROIs into the diffusion space. For the connectome construction, we calculated the number of streamlines intersection both ROIs in each pairwise combination of ROIs. We averaged streamlines starting and ending in each ROI to create a symmetric adjacency matrix.
In order to minimize false positive connections, the streamline density matrices were thresholded so that only connections with more than 5 streamlines were retained. Further, the matrices were consensus-thresholded to only contain connections that were found in at least 60% of the sample48. Subsequently, the streamline density matrices were log10-scaled.
Individual connections that consistently differed between the groups were identified through hold-out cross-validation in a dataset combining tractography results from the ACE and CALM sample (n = 239). The dataset was randomly split into a training (80%, n = 188) and a test set (20%, n = 47). Within the training set, connections that showed a significant difference between cingulum-defined groups on a Mann-Whitney-U test that were consistently observed across 4 random split of the training data (n = 47) were selected. Subsequently, differences between groups in the strength of the selected connections were checked in the hold-out test set. Only connections that showed consistent differences in the training and test set are presented in the Results section.
Default mode network activation
Resting-state functional MRI data were processed to obtain functional activation within the default mode network. Only participants who completed the full resting-state sequence, had full coverage of the brain in the resting-state sequence, and also had useable T1-weighted data were included in the analysis. For motion and eddy current correction, volumes were co-registered to the middle volume using mcflirt49. For quality control, the frame-wise displacement was calculated as the weighted average of the rotation and translation parameters50 using fsl_motion_outliers. Participants with a frame-wise displacement above 0.5 on this measure were excluded from the analysis. Complete data was available for 124 participants (78 male, Age: mean = 10.00, SE = 0.196, group1: n = 59, group2: n = 58, no group: n = 6). There was no significant difference in age between the sample included in the rsfMRI analysis and the sample included in the main analysis (t(284) = −0.74, p = 0.458). The samples did not differ on any of the cognitive measures (MR: t = −0.85, p = 0.396, Vocab: t = −0.80, p = 0.423; DR: t = −0.73, p = 0.465; DM: t = −0.62, p = 0.539; BR: t = −0.80, p = 0.427; MX: t = −0.23, p = 0.820; CM: t = −0.74, p = 0.461). Regarding data quality, there was no difference in frame-wise displacement between the groups defined through data-driven clustering (group 1: mean = 0.01, SE = 0.001; group2: mean = 0.01, SE = 0.004, t(122) = −0.71, p = 0.480). The groups also did not differ in the number of motion outliers (group 1: mean = 18.05, SE = 1.007; group 2: mean = 17.08, SE = 1.154, t(122) = 0.63, p = 0.529). There was no significant correlation between the framewise displacement and any of the cognitive measures (Pearson correlation, MR: r = −0.12, p = 0.188; Vocab: r = 0.09, p = 0.349; DR: r = −0.00, p = 0.986; DM: r = −0.11, p = 0.226; BR: r = 0.07, p = 0.456; MX: r = 0.05, p = 0.570; CM: r = 0.11, p = 0.207).
Functional connectivity was assessed using independent component analysis by means of the multivariate exploratory linear decomposition into a fixed set of 25 independent components (MELODIC)51,52. The correspondence between the independent components derived in the data and the canonical networks described by Yeo et al.53 was established by calculating the spatial correlation between the maps. Two maps showed a high spatial correlation with the canonical default mode network (IC3: r = 0.303, IC9: r = 0.493). Two additional component maps also had a high spatial correlation with the default mode network map (r = 0.286, r = 0.276), but showed activation within the white matter and CSF and were therefore dismissed as artefacts. The default mode network in individual participants was calculated as described by Supekar and colleagues54. In brief, ICA with automatic dimensionality detection was performed for each participant. The groups did not differ in the number of ICA components generated (C1: mean = 100.70, SE = 1.821; C2: mean = 102.19, SE = 1.862; U = 1549, p = 0.254). Subsequently, a goodness-of-fit measure was calculated based on the average z-scored activation within the DMN-mask minus the activation outside of the DMN-mask and the component with the largest score was selected. To compare the spatial extent of activation within the individual DMN components between the groups, a permutation procedure with 5,000 repetitions and cluster-free threshold enhancement for correction of multiple comparisons as implemented in FSL randomise was used. To compare functional connectivity between groups, the average bandpass-filtered (0.01–0.1 Hz) signal for a 8 mm-sphere placed on the posterior cingulate cortex (PCC, MNI: 0, −52, 18), medial prefrontal cortex (mPFC, MNI: 1, 50, −5), and the left and right temporoparietal junction (TPJ, MNI: −46, −68, 32; 46, −68, 32) and the partial correlation between mPFC and PCC was calculated controlling for the signals in the left and right TPJ55.
Statistical analysis
Shapiro-Wilk tests were used to test if data were normally distributed. If a significant deviation from normality was indicated (p > 0.05), non-parametric tests were used. Specifically, Mann-Whitney U tests were used instead of independent t-tests. The Bonferroni method was used to correct for multiple comparisons unless otherwise stated.
Results
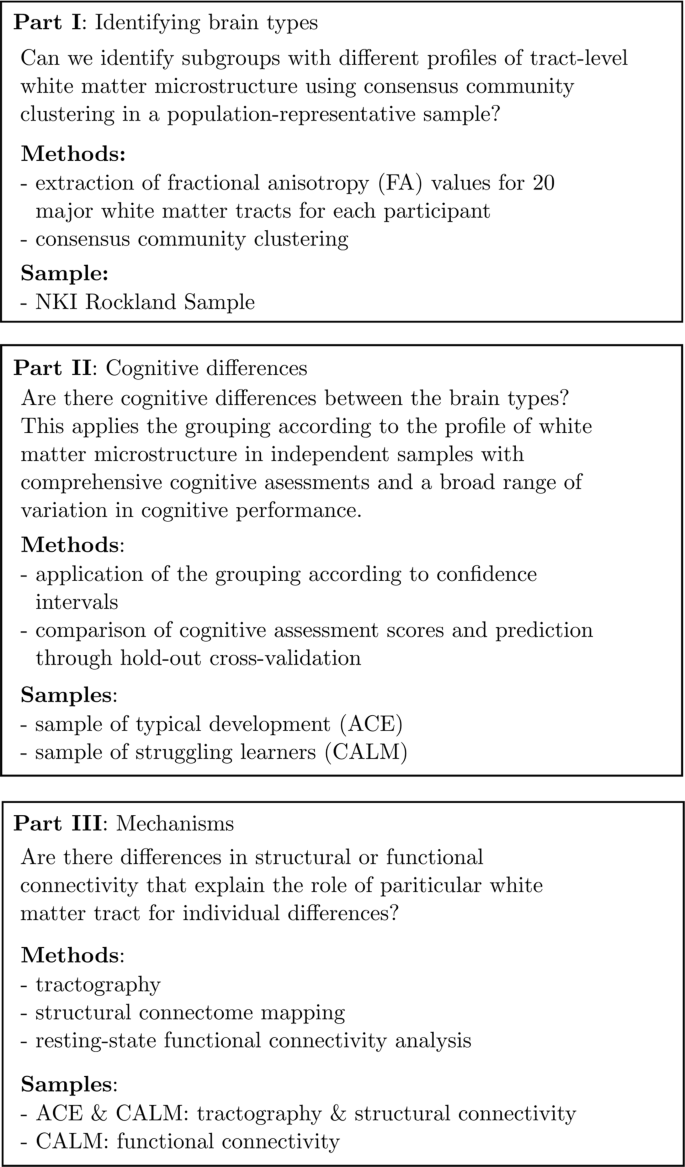
The analysis followed a three-step sequential logic (see Fig. 1):
-
The first aim was to determine subgroups of maximally similar white matter organisation using community detection in a population-representative sample of typical development (NKI sample).
-
The second aim was to investigate potential cognitive correlates of white matter tracts that distinguished groups identified in the first part of the analysis. This was carried out in large developmental samples that had detailed cognitive assessments and showed large variation in cognitive abilities (ACE & CALM sample).
-
The third aim was to investigate potential driving mechanisms that distinguish the brain types by mapping the particular connections mediated by the tract that distinguished the brain types (ACE & CALM sample) and by relating differences in white matter microstructure to differences in functional connectivity (CALM sample).
Community clustering indicates the presence of two groups that differ in FA of the cingulum
Grouping children in the NKI sample according to their similarity of FA values within major white matter tracts using consensus clustering indicated the presence of two groups. The quality index indicated a good separation between groups (Q = 0.47, Fig. 3A,B). The groups defined through community clustering did not differ in age (C1: n = 34, mean = 13.568, SE = 0.59; C2: n = 40, mean = 14.23, SE = 0.470; t-test: t(72) = −0.89, p = 0.375; Equivalence test: tlower(65.94) = 1.355, p = 0.09, tupper(65.94), p = 0.001 with δ = 1.684) and did also not differ from the whole sample in proportion of males and females (C1: 24/10 male/female, χ2 = 0.06, p = 0.800; C2: 21/19, χ2 = 0.05, p = 0.825). Comparison of group assignment with an alternative clustering method (Kernighan-Lin algorithm) indicated very high agreement with an equal number of clusters using both methods and only 6 out 74 children being assigned to a different cluster depending on the algorithm. Agglomerative clustering as an alternative clustering approach provided the same results as the consensus community detection algorithm with two clusters across different linkage definitions (Ward, average, maximal, single).

Overview of clustering based on fractional anisotropy (FA) in major white matter tracts in the NKI sample. (A) Correlation within groups defined through community-based clustering of FA values in the NKI sample showing two distinct groups with high correlation within the cluster. (B) FA values in the left and right anterior cingulum in the ACE and CALM with grouping according to the ranges identified in the NKI sample clusters. The bottom figure show the percentage of participants in each cluster range with orange for C1, yellow for C2, and grey for participants that fell outside of both ranges. (C) Differences in FA for each major white matter tract between the clusters identified through community clustering. The error bars show one standard error, the middle of the bar indicates the median. Significant differences between clusters were found for the left and right anterior Cingulum. Abbreviations: IFOF: inferior fronto-occipital fasciculus, ILF: inferior longitudinal fasciculus, SLF: superior longitudinal fasciculus.
Next, FA values for all tracts were compared between the groups defined through community clustering. The groups differed on the FA of the left and right anterior cingulum (cingulate gyrus region) (left anterior cingulum: C1: mean = 0.49, SE = 0.179, C2: mean = −0.42, SE = 0.121, Man-Whitney: U = 304, p < 0.001, pcorrected < 0.001; right anterior cingulum: mean = 0.50, SE = 0.167, C2: mean = −0.42, SE = 0.132 Man-Whitney: U = 300, p < 0.001, pcorrected < 0.001, see Supplementary Information Table S1 for raw FA values). There were no significant differences between the groups for any other tract (all other pcorrected > 0.1, see Fig. 3C). To establish the potential influence of crossing fibres, we repeated the analysis with GFA values. This comparison indicated a significantly lower GFA in C2 for the left and right anterior cingulum (left: C1: mean = 0.20, SE = 0.004, C2: mean = 0.19, SE = 0.003, U = 426, p = 0.003, pcorrected = 0.03, right: C1: mean = 0.22, SE = 0.004, C2: mean = 0.21, SE = 0.003, U = 430, p = 0.003, pcorrected = 0.034). There were no significant differences in GFA for any other tract (all other pcorrected > 0.1).
The range of age-regressed, z-transformed values for the left and right cingulum in each group was used to group children in the CALM and ACE sample (see Fig. 3D). A majority of the samples fell within the range for C1 or C2 (ACE: C1: n = 36 (42%), C2: n = 43 (51%), not categorized: n = 5 (6%); CALM: C1: n = 95 (49%), C2: n = 87 (45%), not categorized: n = 11 (6%), see Supplementary Information Table S2 and S3 for raw FA values). The proportion of participants being assigned to C1 or C2 was equal (ACE: χ2 = 0.64, p = 0.423; CALM: χ2 = 0.01, p = 0.943). Comparison of the within-group versus between-group connection strength indicated that the grouping based on the clusters identified in the NKI sample provided a good account of the data for both the ACE and the CALM sample that significantly differed from random group assignments (ACE: intra-cluster = 64.85, p < 0.001; inter-cluster: −58.95, p = 0.001; CALM: intra-cluster = 521.17, p < 0.001; inter-cluster = 21.10, p < 0.001).
Brain-defined subgroups differ in cognitive performance
Next, differences in cognitive performance between the clustering-defined groups were investigated. For the CALM sample, children who fell within the C1 range showed significantly higher performance across all cognitive assessments (all pcorrected < 0.05, see Fig. 4A). For the ACE sample, C1 showed significantly higher performance across all cognitive measures, apart from visuospatial working memory (p = 0.207, pcorrected > 0.999, see Fig. 4B).

Comparison of cognitive scores between the groups defined based on cingulum FA in the CALM sample (A) and the ACE sample. (B) Legend: Comparison between C1 and C2; C0: not assigned to C1 or C2, ***pcorrected < 0.001, **pcorrected < 0.01, *pcorrected < 0.05.
We further investigated the reliability of the clustering-defined grouping for predicting behavioural performance. For the CALM sample, predictive performance in unseen data was above chance for scores on Matrix Reasoning, Vocabulary, Mr. X, and Delayed Story Recall with prediction accuracy between 60 and 75% (see Table 1). The optimal percentile cut-off identified in the training data set and the training performance are listed in the columns %ile and train. The fraction of participants who were accurately predicted to score above or below the median of all cases based on their group assignment is listed for the train and test set column. A statistical comparison to random assignment (1000 permutations) is listed in the column labelled p. For the ACE sample, there was above chance prediction for unseen data for Matrix Reasoning, Vocabulary, Backward Digit Recall, and Mr. X with prediction accuracies around 70% (see Table 2).
Subgroups show differences in fronto-parietal and fronto-temporal connections of the cingulum
The groups were compared on the number of streamlines within the cingulum that connect cortical and subcortical regions (ACE & CALM sample). Streamlines associated with the cingulum were densest around in the core area of the cingulum, but also extended into the frontal, parietal, and temporal cortex in both hemispheres (see Fig. 5A). Areas that were consistently connected through streamlines of the cingulum included the orbitofrontal and superior frontal cortex, insula, inferior and superior parietal cortex, precuneus, and parahippocampal cortex (see Fig. 5B). The summed streamline density was higher in the left cingulum compared to the right cingulum (left: mean = 53.34, SE = 0.449; right: mean = 45.80, SE = 0.435, U = 7959, p < 0.001). The total number of connections was also higher in the left compared to the right cingulum (left: mean = 44.10, SE = 0.355; right: 35.31, SE = 0.302, U = 3282, p < 0.001). Differences between groups in individual cingulum-mediated connections were selected using a cross-validation procedure, which indicated significant differences between the brain types for some cingulum connections that were also confirmed in a hold-out sample (20%). The groups showed consistent differences in the connections between the precuneus and superior frontal cortex, inferior temporal cortex and lateral orbitofrontal cortex, parahippocampal cortex and post-central cortex in the left hemisphere, and the anterior cingulate cortex and posterior cingulate cortex in the right hemisphere (see Fig. 5B). C2 had had lower streamline density in all of these connections compared to C1.

Structural connectivity of the cingulum. (A) Average streamline density of the cingulum reconstruction. (B) Connections of the cingulum. Grey lines indicate connections that were present in at least 60% of the sample. Blues lines indicate connections of the left cingulum that had fewer streamlines in C2 compared to C1 and green lines indicate fewer connections in C2 compared to C1 for the right cingulum.
Relationship between structural connectivity and default mode network activation
The default mode network (DMN) could be identified in group-level ICA (CALM sample, see Fig. 6A). The groups did not differ in the number of components identified in individual independent component decomposition (C1: mean = 100.70, SE = 1.821; C2: mean = 102.19, SE = 1.862; U = 1549, p = 0.254). Comparison of ICA-derived maps between C1 and C2 indicated that the spatial extent of the DMN was significantly reduced in the posterior cingulate cortex for C1 (MNI peak coordinates: 0, −70, 35; TCFE-corrected p < 0.05; see Fig. 6C). Next, we investigated the relationship between variation in the microstructure of the cingulum and the strength of functional connectivity between the medial prefrontal cortex (mPFC) and posterior cingulate cortex (PCC). While the clustering-defined groups did not differ in absolute mPFC-PCC partial correlation (C1: mean = 0.31, SE = 0.020; C2: mean = 0.32, SE = 0.020, U = 1511, p = 0.239), analysis of the relationship between cingulum FA and mPFC-PCC correlation indicated a significant group interaction (group x cingulum FA: t(118) = 2.01, p = 0.047). Follow-up analyses showed that cingulum FA was significantly associated with the mPFC-PCC correlation in C1 (beta = 0.38, p = 0.005), but not in C2 (beta = 0.03, p = 0.811, see Fig. 6D).

(A) Default mode network (DMN) at the group level, (B) individual DMN average in C1 and C2. (C) Results of a two-sample t-test contrasting the DMN in C1 and C2 showing a reduced spatial extent of C1 compared to C2 in the posterior cingulate cortex. (D) Relationship between the partial correlation of the medial prefrontal cortex and posterior cingulate cortex and FA of the cingulum in C1 and C2.
Discussion
The first aim of the study was to test whether it is possible to identify groups on the basis of individual differences in white matter organization. We employed data-driven community clustering to create subgroups of participants that were maximally similar in white matter organisation across 20 major white matter tracts. In theory, this could have resulted in multiple groups with a highly complex differentiation of brain organization. However, the subgrouping is dominated by the integrity of a pair of large tracts within the brain: the results indicated the presence of two groups primarily distinguished by FA of the left and right cingulum. Whilst this finding is somewhat unexpected, the cingulum has been implicated in a broad range of psychiatric and developmental disorders, including autism spectrum disorder56, attention deficit hyperactivity disorder57, schizophrenia58, major depression59, mild cognitive impairment60, and dementia61. There are several possible reasons why the cingulum may play a central role in individual differences in neurocognitive development. One explanation may lie in the prolonged development of the cingulum. The cingulum is one of the only tracts that show extended development with changes throughout childhood and adolescence, only reaching a stable level in the third decade of life12,62. Similar tracts, also involved in long-range connectivity, like the superior longitudinal fasciculus, inferior longitudinal fasciculus, and inferior fronto-occipital fasciculus already plateau by the end of the second decade of life. Consequently, individual differences may arise from differences in timing of cingulum maturation. Further, the cingulum may be particularly sensitive to environmental influences. The cingulum has been found to be particularly sensitive to neonatal complications, which, in turn, are a risk factor for unfavourable developmental outcomes later in life like a heightened risk for psychiatric disorders63,64. That said, diffusion properties of the cingulum have also been found to change following relatively short working memory or motor training interventions65,66,67 indicating that the individual differences in the cingulum may not necessarily be fixed throughout the lifespan. In sum, the inter-individual differences in cingulum FA identified in the current analysis may be a marker of accumulated differences in experience between individuals over their distant and recent lifetime.
The second aim of the study of the study was to investigate whether subgroups formed on the basis of similarity of white-matter organization differ in cognitive performance. Applying the cingulum-based grouping to two independent samples of typically-developing children or struggling learners showed that children with lower cingulum FA showed lower performance on assessments of general intelligence, vocabulary, and short-term, long-term, and working memory. This broad difference in cognitive performance clashes with previous findings that indicated a comparatively narrow association between cingulum FA and executive function, which included sustained and divided attention68, working memory69, and planning70. However, broader associations between the cingulum and cognitive abilities have been reported in different patient populations64. For instance, cingulum integrity was found to relate to memory function in mild cognitive impairment and Alzheimer’s disease71,72,73. Further, cingulum integrity was found to be associated with symptom severity in major depression, obsessive compulsive disorder (OCD), and post-traumatic stress disorder (PTSD)74,75,76. A potential explanation for the broad and inconsistent contribution of the cingulum to measures of cognitive performance and symptom severity is that it may support circuits involved in affect and motivation. Differences in affect and motivation can have a broad impact across measures of cognition and symptom severity. Areas thought to be central for decision making (anterior cingulate cortex, orbitofrontal cortex, medial thalamus) are at least in part connected through cingulum connections64. The cingulum also supports connections between limbic areas that have been linked to emotional processing77, which may be particularly important for effort-based decision making with broad consequences for performance on cognitive tasks78. Further, frontoparietal connections via the cingulum play a central role in attention79, which may also impact other assessments, e.g. attention directed to internal cues may affect symptom severity ratings or influence performance on other cognitive tasks.
In addition to the circuit-specific role of the cingulum, the importance of the cingulum may be linked to its role within the global white matter connectome, i.e. the cingulum may contribute to a network architecture that supports cognitive function optimally. The results of the connectomics analysis in the current study show that cingulum contains extensive short-range and long-range connections between cortical areas in each hemisphere. Further, the analysis of default mode network activation shows that the cingulum is important for functional integration between anterior and posterior parts (medial prefrontal cortex and posterior cingulate cortex) of this distributed cortical network. While a strong association between cingulum FA and mPFC-PCC was observed in a group of children with low cingulum FA, there was no association in children with high cingulum FA. A possible interpretation is that low cingulum FA limits the communication between these regions, but only up to a critical value. Once this critical value is reached – as in the case of the high FA group - further increases no longer influence the strength of the functional connection. Integration between parietal and prefrontal areas is central to some theories of general intelligence80,81. According to the parietal-prefrontal integration theory (P-FIT), general cognitive ability arises from the interplay between parietal areas involved in the integration and abstraction of sensory information, prefrontal areas involved in reasoning and problem-solving, and the anterior cingulate cortex involved in response selection82,83. The role of the cingulum may be to enable the efficient communication between these regions. However, the connectivity mapping in the current study indicates that the cingulum plays a broader role in structural connectivity beyond connections along the prefrontal-parietal axis. The dense short-range and longer-range connections of the cingulum may enable communication within multiple large-scale structural brain networks. Indeed, the connections implicated in the group difference involved the prefrontal and posterior parietal areas that are part of a small number of so-called hub regions that are densely connected in functional and structural brain networks84. The connectivity of these hub regions is thought to form the backbone of a network architecture that enables the efficient transfer of information and the rapid transition between different network states, both of which may be necessary for cognitive performance in complex tasks81.
There are some limitations to the current study. First, this study explored variation in white matter microstructure in pre-collected samples and was limited to the available data. Therefore, it was not possible to investigate if genetic or environmental factors, such as socio-economic background, contribute differentially to white matter microstructure in the brain types identified in the analysis. Further, the samples differed in their age range and gender distribution. Therefore, we focused on identifying brain types that are not influenced by these factors by statistically controlling for the influence of age and gender. Given the well-documented development of white matter through childhood and adolescent, it is likely that different groupings may dominate at particular stages of neurocognitive development. While it was not possible to adequately address this in the current study, it will be possible to investigate developmental effects when large-scale, longitudinal samples become available in the near future.
Another important caveat is that the grouping identified in the current study depends on the data used to inform the grouping and the definition of similarity. Just like there are multiple valid ways to characterize individual differences between people, e.g. short vs tall, young vs old, male vs female, there are multiple ways to describe individual differences in neurocognitive development. Previously identified groupings based on behavioural features9 may therefore not necessarily fully align with the white matter-based grouping identified here, even though they seem to converge on similar white matter differences, i.e. fronto-parietal connectivity. Employing a data-driven grouping has the advantage of creating groups that are maximally distinct and maximally homogeneous, which can be a powerful approach to investigate the drivers of individual differences as showcased in this analysis. Further, the homogeneity within groups is formally defined and quantified, which makes group-based analyses more objective than through traditional top-down definitions. However, there is currently no general agreement which metric captures individual differences the best, e.g. correlation-based vs distance-based metrics. The same applies to the plethora of clustering algorithms, e.g. centroid-based, hierarchical, density-based, network-based etc. Here, we focused on a methodological approach that has been previously employed for analysis at the behavioural and cognitive level7,8,9. However, this is by no means the only approach for data-driven grouping and other approaches have produced highly promising results, e.g. see85. Future research based on population-representative samples with rich phenotypic characterisation will need to establish which definition of similarity and grouping is most useful to inform our understanding of individual differences in neuroanatomy. Further, the current analysis only investigates individual differences in brain anatomy at one coarse anatomical scale. Future studies could employ data-driven methods to identify if these individual differences are apparent at different scales, e.g. through fractal topological clustering86.
In conclusion, this is the first study to investigate the relationship between individual differences in white matter connections and cognitive performance with a brain-first approach. The results indicate that consistent individual differences exist in the microstructural organization of the left and right cingulum. Lower microstructural organisation of the cingulum was related to lower cognitive performance across a range of cognitive domains and was also linked to reduced BOLD activation within the default mode network. These findings suggest that cingulum connections play an important role in brain organisation and cognitive performance in childhood and adolescence. The current study is an initial step towards a bigger goal of understanding individual differences in neuroanatomy; it illustrates the benefits of bringing together large samples, multi-modal characterisation, and machine learning approaches like community clustering to identify biologically-defined groups that are difficult to distinguish at a behavioural level. In future, this new approach may enable our field to isolate key biological mechanism that drive differences in brain organisation, allowing for more objective identification of individual needs, and open new avenues for effective interventions.
References
Lubinski, D. Scientific and social significance of assessing individual differences: “sinking shafts at a few critical points”. Annu Rev Psychol 51, 405–444 (2000).
Cronbach, L. J. The two disciplines of scientific psychology. Am Psychol 12, 671–684 (1957).
Poldrack, R. A. & Yarkoni, T. From Brain Maps to Cognitive Ontologies: Informatics and the Search for Mental Structure. Annu Rev Psychol 67, 587–612 (2016).
Uttal, W. The New Phrenology: The Limits of Localizing Cognitive Processes in the Brain. (MIT Press, 2001).
Stevens, M. C., Pearlson, G. D., Calhoun, V. D. & Bessette, K. L. Functional Neuroimaging Evidence for Distinct Neurobiological Pathways in Attention-Deficit/Hyperactivity Disorder. Biological Psychiatry: Cognitive Neuroscience and Neuroimaging 3, 675–685 (2018).
Jones, E. J. H., Gliga, T., Bedford, R., Charman, T. & Johnson, M. H. Developmental pathways to autism: a review of prospective studies of infants at risk. Neuroscience & Biobehavioral Reviews 39, 1–33 (2014).
Karalunas, S. L. et al. Subtyping Attention-Deficit/Hyperactivity Disorder Using Temperament Dimensions. JAMA Psychiatry 71, 1015–1024 (2014).
Fair, D. A., Bathula, D., Nikolas, M. A. & Nigg, J. T. Distinct neuropsychological subgroups in typically developing youth inform heterogeneity in children with ADHD. Proc. Natl. Acad. Sci. USA 109, 6769–6774 (2012).
Bathelt, J. et al. Data-Driven Subtyping of Executive Function–Related Behavioral Problems in Children. Journal of the American Academy of Child & Adolescent Psychiatry 57, 252–262.e4 (2018).
Ahmadlou, M. & Adeli, H. Functional community analysis of brain: A new approach for EEG-based investigation of the brain pathology. NeuroImage 58, 401–408 (2011).
Cantini, L., Medico, E., Fortunato, S. & Caselle, M. Detection of gene communities in multi-networks reveals cancer drivers. Sci Rep 5, 17386 (2015).
Lebel, C., Treit, S. & Beaulieu, C. A review of diffusion MRI of typical white matter development from early childhood to young adulthood. NMR Biomed 3, e3778–23 (2017).
Westlye, L. T. et al. Life-Span Changes of the Human Brain White Matter: Diffusion Tensor Imaging (DTI) and Volumetry. Cerebral Cortex 20, 2055–2068 (2009).
Skeide, M. A., Brauer, J. & Friederici, A. D. Brain Functional and Structural Predictors of Language Performance. Cereb. Cortex bhv042, https://doi.org/10.1093/cercor/bhv042 (2015).
Burzynska, A. Z. et al. Microstructure of frontoparietal connections predicts cortical responsivity and working memory performance. Cerebral Cortex 21, 2261–2271 (2011).
Chaddock-Heyman, L. et al. White matter microstructure is associated with cognitive control in children. Biological Psychology 94, 109–115 (2013).
Zhao, J. et al. Altered hemispheric lateralization of white matter pathways in developmental dyslexia: Evidence from spherical deconvolution tractography. Cortex 76, 51–62 (2016).
Wu, Z.-M. et al. White Matter Microstructural Alterations in Children with ADHD: Categorical and Dimensional Perspectives. Neuropsychopharmacology 42, 572–580 (2017).
Ameis, S. H. & Catani, M. Altered white matter connectivity as a neural substrate for social impairment in Autism Spectrum Disorder. Cortex 62, 158–181 (2015).
Aggarwal, C. C. & Reddy, C. K. Data Clustering: Algorithms and Applications. (CRC Press, 2013).
Bullmore, E. & Sporns, O. Complex brain networks: graph theoretical analysis of structural and functional systems. Nat Rev Neurosci 10, 186–198 (2009).
Barabasi, A. L. In Network Science 321–377 (2016).
Nooner, K. B. et al. The NKI-Rockland Sample: A Model for Accelerating the Pace of Discovery Science in Psychiatry. Frontiers in Neuroscience 6, 152 (2012).
Holmes, J., Bryant, A. & The Calm Team & Gathercole, S. E. A transdiagnostic study of children with problems of attention, learning and memory (CALM). bioRxiv 303826, https://doi.org/10.1101/303826 (2018).
Wechsler, D. Wechsler Abbreviated Scale of Intelligence - Second Edition. (Pearson, 2011).
Alloway, T., Gathercole, S. E., Kirkwood, H. & Elliott, J. Evaluating the validity of the automated working memory assessment. Educational Psychology 28, 725–734 (2008).
Dunn, L. M. & Whetton, C. British picture vocabulary scale. (Nfer-Nelson Windsor, 1982).
Cohen, M. J. Children’s Memory Scale. (The Psychological Corporation, 1997).
Smith, S. M. Fast robust automated brain extraction. Hum. Brain Mapp. 17, 143–155 (2002).
Graham, M. S., Drobnjak, I. & Zhang, H. Realistic simulation of artefacts in diffusion MRI for validating post-processing correction techniques. NeuroImage 125, 1079–1094 (2016).
Gorgolewski, K. et al. Nipype: a flexible, lightweight and extensible neuroimaging data processing framework in python. Front. Neuroinform. 5, 13 (2011).
Avants, B. B., Epstein, C. L., Grossman, M. & Gee, J. C. Symmetric diffeomorphic image registration with cross-correlation: evaluating automated labeling of elderly and neurodegenerative brain. Med Image Anal 12, 26–41 (2008).
Wakana, S., Jiang, H., Nagae-Poetscher, L. M., Van Zijl, P. C. M. & Mori, S. Fiber tract-based atlas of human white matter anatomy. 230, 77–87 (2004).
Tuch, D. S. Q-ball imaging. Magn. Reson. Med. 52, 1358–1372 (2004).
Blondel, V. D., Guillaume, J.-L., Lambiotte, R. & Lefebvre, E. Fast unfolding of communities in large networks. J. Stat. Mech. 2008, P10008 (2008).
Lancichinetti, A. & Fortunato, S. Community detection algorithms: a comparative analysis. Phys Rev E Stat Nonlin Soft Matter Phys 80, 056117 (2009).
Rubinov, M. & Sporns, O. Complex network measures of brain connectivity: Uses and interpretations. NeuroImage 52, 1059–1069 (2010).
Rubinov, M. & Sporns, O. Weight-conserving characterization of complex functional brain networks. NeuroImage 56, 2068–2079 (2011).
Lancichinetti, A. & Fortunato, S. Consensus clustering in complex networks. Nature Publishing Group 2, 336 (2012).
Pedregosa, F. et al. Scikit-learn: Machine learning in Python. Journal of Machine Learning Research 12, 2825–2830 (2011).
Rousseeuw, P. J. Silhouettes: A graphical aid to the interpretation and validation of cluster analysis. Journal of Computational and Applied Mathematics 20, 53–65 (1987).
Catani, M. & T de Schotten, M. A diffusion tensor imaging tractography atlas for virtual in vivo dissections. Cortex 44, 1105–1132 (2008).
Garyfallidis, E. et al. Dipy, a library for the analysis of diffusion MRI data. Front. Neuroinform. 8, 8 (2014).
Coupe, P. et al. An optimized blockwise nonlocal means denoising filter for 3-D magnetic resonance images. IEEE Trans Med Imaging 27, 425–441 (2008).
Behrens, T. E. J. et al. Characterization and propagation of uncertainty in diffusion-weighted MR imaging. Magn. Reson. Med. 50, 1077–1088 (2003).
Avants, B. B. et al. A reproducible evaluation of ANTs similarity metric performance in brain image registration. Neuro Image 54, 2033–2044 (2011).
Desikan, R. S. et al. An automated labeling system for subdividing the human cerebral cortex on MRI scans into gyral based regions of interest. Neuro Image 31, 968–980 (2006).
de Reus, M. A. & van den Heuvel, M. P. Estimating false positives and negatives in brain networks. - PubMed - NCBI. Neuro Image 70, 402–409 (2013).
Jenkinson, M., Bannister, P., Brady, M. & Smith, S. Improved optimization for the robust and accurate linear registration and motion correction of brain images. Neuro Image 17, 825–841 (2002).
Power, J. D., Barnes, K. A., Snyder, A. Z., Schlaggar, B. L. & Petersen, S. E. Spurious but systematic correlations in functional connectivity MRI networks arise from subject motion. Neuro Image 59, 2142–2154 (2012).
Beckmann, C. F., DeLuca, M., Devlin, J. T. & Smith, S. M. Investigations into resting-state connectivity using independent component analysis. Philos. Trans. R. Soc. Lond., B, Biol. Sci. 360, 1001–1013 (2005).
Beckmann, C. F. & Smith, S. M. Probabilistic independent component analysis for functional magnetic resonance imaging. Medical Imaging, IEEE Transactions on 23, 137–152 (2004).
Yeo, B. T. T. et al. The organization of the human cerebral cortex estimated by intrinsic functional connectivity. Journal of Neurophysiology 106, 1125–1165 (2011).
Supekar, K. et al. Development of functional and structural connectivity within the default mode network in young children. NeuroImage 52, 290–301 (2010).
van den Heuvel, M., Mandl, R., Luigjes, J. & Hulshoff Pol, H. Microstructural organization of the cingulum tract and the level of default mode functional connectivity. J. Neurosci. 28, 10844–10851 (2008).
Ikuta, T. et al. Abnormal cingulum bundle development in autism: a probabilistic tractography study. Psychiatry Res 221, 63–68 (2014).
Cooper, M., Thapar, A. & Jones, D. K. ADHD severity is associated with white matter microstructure in the subgenual cingulum. Neuroimage Clin 7, 653–660 (2015).
Konrad, K. & Eickhoff, S. B. Is the ADHD brain wired differently? A review on structural and functional connectivity in attention deficit hyperactivity disorder. Hum. Brain Mapp. 31, 904–916 (2010).
Schermuly, I. et al. Association between cingulum bundle structure and cognitive performance: an observational study in major depression. Eur. Psychiatry 25, 355–360 (2010).
Metzler-Baddeley, C. et al. Cingulum microstructure predicts cognitive control in older age and mild cognitive impairment. J. Neurosci. 32, 17612–17619 (2012).
Kantarci, K. et al. Diffusion tensor imaging and cognitive function in older adults with no dementia. Neurology 77, 26–34 (2011).
Tamnes, C. K. et al. Brain maturation in adolescence and young adulthood: regional age-related changes in cortical thickness and white matter volume and microstructure. Cereb. Cortex 20, 534–548 (2010).
Schiller, R. M. et al. Neonatal critical illness and development: white matter and hippocampus alterations in school-age neonatal extracorporeal membrane oxygenation survivors. Developmental Medicine & Child Neurology 59, 304–310 (2017).
Bubb, E. J., Metzler-Baddeley, C. & Aggleton, J. P. The cingulum bundle: Anatomy, function, and dysfunction. Neuroscience & Biobehavioral Reviews 92, 104–127 (2018).
Metzler-Baddeley, C. et al. Dynamics of White Matter Plasticity Underlying Working Memory Training: Multimodal Evidence from Diffusion MRI and Relaxometry. Journal of Cognitive Neuroscience 29, 1509–1520 (2017).
Caeyenberghs, K., Metzler-Baddeley, C., Foley, S. & Jones, D. K. Dynamics of the Human Structural Connectome Underlying Working Memory Training. J. Neurosci. 36, 4056–4066 (2016).
Scholz, J., Klein, M. C., Behrens, T. E. J. & Johansen-Berg, H. Training induces changes in white-matter architecture. Nature Publishing Group 12, 1370–1371 (2009).
Takahashi, M. et al. White matter microstructure of the cingulum and cerebellar peduncle is related to sustained attention and working memory: a diffusion tensor imaging study. Neuroscience Letters 477, 72–76 (2010).
Golestani, A. M. et al. Constrained by our connections: White matter’s key role in interindividual variability in visual working memory capacity. Journal of Neuroscience 34, 14913–14918 (2014).
Kubicki, M. et al. Cingulate fasciculus integrity disruption in schizophrenia: a magnetic resonance diffusion tensor imaging study. Biol. Psychiatry 54, 1171–1180 (2003).
Bozzali, M. et al. Damage to the cingulum contributes to Alzheimer’s disease pathophysiology by deafferentation mechanism. Hum. Brain Mapp. 33, 1295–1308 (2012).
Wang, Z. et al. Cortical Thickness and Microstructural White Matter Changes Detect Amnestic Mild Cognitive Impairment. J. Alzheimers Dis. 56, 415–428 (2017).
Zhang, Y. et al. Diffusion tensor imaging of cingulum fibers in mild cognitive impairment and Alzheimer disease. Neurology 68, 13–19 (2007).
Lochner, C. et al. Evidence for fractional anisotropy and mean diffusivity white matter abnormalities in the internal capsule and cingulum in patients with obsessive-compulsive disorder. J Psychiatry Neurosci 37, 193–199 (2012).
Kennis, M., Van Rooij, S. J. H., Reijnen, A. & Geuze, E. The predictive value of dorsal cingulate activity and fractional anisotropy on long-term PTSD symptom severity. Depress Anxiety 34, 410–418 (2017).
de Diego-Adeliño, J. et al. Microstructural white-matter abnormalities associated with treatment resistance, severity and duration of illness in major depression. Psychol Med 44, 1171–1182 (2014).
Dalgleish, T. The emotional brain. Nat Rev Neurosci 5, 583–589 (2004).
Husain, M. & Roiser, J. P. Neuroscience of apathy and anhedonia: a transdiagnostic approach. Nat Rev Neurosci 19, 470–484 (2018).
Corbetta, M. & Shulman, G. L. Control of goal-directed and stimulus-driven attention in the brain. Nat Rev Neurosci 3, 201–215 (2002).
Deary, I. J., Penke, L. & Johnson, W. The neuroscience of human intelligence differences. Nature Publishing Group 11, 201–211 (2010).
Barbey, A. K. Network Neuroscience Theory of Human Intelligence. Trends in Cognitive Sciences 22, 8–20 (2018).
Jung, R. E. & Haier, R. J. The Parieto-Frontal Integration Theory (P-FIT) of intelligence: converging neuroimaging evidence. Behav Brain Sci 30, 135–54, discussion 154–87 (2007).
Barbey, A. K. et al. An integrative architecture for general intelligence and executive function revealed by lesion mapping. Brain 135, 1154–1164 (2012).
Power, J. D., Schlaggar, B. L., Lessov-Schlaggar, C. N. & Petersen, S. E. Evidence for hubs in human functional brain networks. Neuron 79, 798–813 (2013).
Van Dam, N. T. et al. Data-Driven Phenotypic Categorization for Neurobiological Analyses_ Beyond DSM-5 Labels. Biol. Psychiatry 81, 484–494 (2017).
Xue, Y. & Bogdan, P. Reliable Multi-Fractal Characterization of Weighted Complex Networks: Algorithms and Implications. Sci Rep 1–22, https://doi.org/10.1038/s41598-017-07209-5 (2017).
Acknowledgements
We want to thank Dr. Edwin Dammaijer and Dr. Rogier Kievit for helpful comments on early drafts of the paper. The Centre for Attention Learning and Memory (CALM) research clinic is based at and supported by funding from the MRC Cognition and Brain Sciences Unit, University of Cambridge. The Principal Investigators are Joni Holmes (Head of CALM), Susan Gathercole (Chair of CALM Management Committee), Duncan Astle, Tom Manly and Rogier Kievit. Data collection is assisted by a team of researchers and PhD students at the CBSU that includes Sarah Bishop, Annie Bryant, Sally Butterfield, Fanchea Daily, Laura Forde, Erin Hawkins, Sinead O’Brien, Cliodhna O’Leary, Joseph Rennie, and Mengya Zhang. The authors wish to thank the many professionals working in children’s services in the South-East and East of England for their support, and to the children and their families for giving up their time to visit the clinic.
Author information
Authors and Affiliations
Contributions
J.B. devised and carried out the analysis. J.B. and D.A. wrote the manuscript. A.J. devised and carried out one of the studies that contributed data to this analysis. M.Z. assisted with part of the analysis. All authors reviewed the manuscript.
Corresponding author
Ethics declarations
Competing Interests
The authors declare no competing interests.
Additional information
Publisher’s note: Springer Nature remains neutral with regard to jurisdictional claims in published maps and institutional affiliations.
Supplementary information
Rights and permissions
Open Access This article is licensed under a Creative Commons Attribution 4.0 International License, which permits use, sharing, adaptation, distribution and reproduction in any medium or format, as long as you give appropriate credit to the original author(s) and the source, provide a link to the Creative Commons license, and indicate if changes were made. The images or other third party material in this article are included in the article’s Creative Commons license, unless indicated otherwise in a credit line to the material. If material is not included in the article’s Creative Commons license and your intended use is not permitted by statutory regulation or exceeds the permitted use, you will need to obtain permission directly from the copyright holder. To view a copy of this license, visit http://creativecommons.org/licenses/by/4.0/.
About this article

Cite this article
Bathelt, J., Johnson, A., Zhang, M. et al. The cingulum as a marker of individual differences in neurocognitive development. Sci Rep 9, 2281 (2019). https://doi.org/10.1038/s41598-019-38894-z
Received:
Accepted:
Published:
DOI: https://doi.org/10.1038/s41598-019-38894-z
This article is cited by
-
A methodological perspective on learning in the developing brain
npj Science of Learning (2022)
-
Sensory processing sensitivity and axonal microarchitecture: identifying brain structural characteristics for behavior
Brain Structure and Function (2022)
-
Cognitive deficits, clinical variables, and white matter microstructure in schizophrenia: a multisite harmonization study
Molecular Psychiatry (2022)
-
White matter microstructural differences in underweight adolescents with anorexia nervosa and a preliminary longitudinal investigation of change following short-term weight restoration
Eating and Weight Disorders - Studies on Anorexia, Bulimia and Obesity (2021)
-
The Effects of Alcohol and Cannabis Co-use on Neurocognitive Function, Brain Structure, and Brain Function
Current Behavioral Neuroscience Reports (2021)
Comments
By submitting a comment you agree to abide by our Terms and Community Guidelines. If you find something abusive or that does not comply with our terms or guidelines please flag it as inappropriate.
