
Abstract
Sub-Saharan Africa is under-represented in global biodiversity datasets, particularly regarding the impact of land use on species’ population abundances. Drawing on recent advances in expert elicitation to ensure data consistency, 200 experts were convened using a modified-Delphi process to estimate ‘intactness scores’: the remaining proportion of an ‘intact’ reference population of a species group in a particular land use, on a scale from 0 (no remaining individuals) to 1 (same abundance as the reference) and, in rare cases, to 2 (populations that thrive in human-modified landscapes). The resulting bii4africa dataset contains intactness scores representing terrestrial vertebrates (tetrapods: ±5,400 amphibians, reptiles, birds, mammals) and vascular plants (±45,000 forbs, graminoids, trees, shrubs) in sub-Saharan Africa across the region’s major land uses (urban, cropland, rangeland, plantation, protected, etc.) and intensities (e.g., large-scale vs smallholder cropland). This dataset was co-produced as part of the Biodiversity Intactness Index for Africa Project. Additional uses include assessing ecosystem condition; rectifying geographic/taxonomic biases in global biodiversity indicators and maps; and informing the Red List of Ecosystems.
Background & Summary
Accelerating socio-economic development over the past century has caused a dramatic transformation of ecosystems, through human activities such as cultivation, urbanisation, resource extraction and infrastructure development1,2. Human land use activities are major drivers of biodiversity loss3,4. As awareness grows about the scale and pace of biodiversity loss, so does our understanding of the importance of biodiversity to human well-being5. Despite this increased awareness, development agendas and policy interventions persistently overlook the critical support-system role of biodiversity in sustainable development and as a source of resilience in times of change6,7,8,9,10. This under-representation is perpetuated by the scarcity of suitable biodiversity data and the difficulty of consistently quantifying biodiversity at the scales relevant for policy, in metrics that indicate its support-system role and the impacts of human activities on that support system10,11,12.
Existing biodiversity datasets that could be used to assess human impacts on biodiversity and the support system it provides have significant limitations that hamper the mainstreaming of biodiversity into policy and planning. Firstly, these datasets are biased across taxa (towards larger, more conspicuous species, especially large mammals and birds13,14,15), regions (towards North America and Europe, with Africa being particularly under-represented13,14,15), and land uses (towards more intact land uses, notably protected areas14,16). Secondly, to consistently assess and compare anthropogenic impacts on biodiversity, the current state of biodiversity ideally needs to be compared to a reference state17. This comparison requires biodiversity data to be collected using comparable methods either over time (e.g., McRae et al.16) or across contemporary human-modified and unmodified ‘intact’ landscapes (e.g., Schipper et al.18), further curtailing data availability. Finally, the connection between common biodiversity metrics (e.g., global or regional threat status of species; representation of species distributions within protected areas14,19) and the functional dimensions of biodiversity relevant to its support-system roles is often unclear6,10. Such roles typically manifest at local scales and depend on the population abundance of species within different functional groups, and how they are impacted by human land uses in these areas11,20,21. Exemplifying these limitations, the largest global dataset of species population abundances across different land uses (the ‘PREDICTS’ database22) includes just 35 Afrotropical studies with population counts in an anthropogenically modified site compared with an ‘intact’ reference site. African decision-makers have noted data limitations as a major constraint to mainstreaming biodiversity into national sustainable development efforts23, and such limitations can bias international decision-making towards Global North solutions24.
We address this data gap through a structured expert elicitation process (Fig. 1) involving 200 experts in Afrotropical biodiversity on mainland sub-Saharan Africa. Expert elicitation is used widely in conservation and natural resource management when data are insufficient or absent25. Notable examples of where expert elicitation has been used include the International Union for Conservation of Nature (IUCN) Red List of Threatened Species26, and assessments of the Intergovernmental Panels on Climate Change27 and on Biodiversity and Ecosystem Services5. We employed the latest advances in expert elicitation to ensure data rigour and consistency25. Expanding substantially on an earlier approach that involved 16 experts in Southern Africa28, experts estimated ‘intactness scores’: the remaining proportion of an ‘intact’ reference population of a given species group (Table 1) in a particular land use (Table 2), on a scale from 0 (no remaining individuals) to 1 (same abundance as a reference population) and, in rare cases, 2 (populations that thrive in human-modified landscapes). The ‘intact’ reference is the population abundance that would likely have occurred in the area before alteration by modern industrial society. Because information on species populations from this era is virtually non-existent, standard protocol is to consider a remote wilderness area with a natural disturbance regime28 (a Hybrid-Historical approach17) where necessary. The resulting bii4africa dataset contains standardised intactness scores representing terrestrial vertebrates (tetrapods: ±5,400 amphibians, reptiles, birds and mammals) and vascular plants (±45,000 forbs, graminoids, trees and shrubs) in sub-Saharan Africa across nine major land uses of varying intensity.

Overview of the structured expert elicitation process, based on the IDEA protocol (Investigate, Discuss, Estimate, Aggregate). This process was run for each broad taxonomic group (Table 1), between November 2020 and January 2022, to elicit from 200 experts the estimated impact of nine major African land uses (Table 2) on the relative population abundances of terrestrial vertebrates and vascular plants.
The dataset was developed to enable the quantification of the Biodiversity Intactness Index28 for sub-Saharan Africa (https://bii4africa.org/). It provides an African-led alternative to a previous attempt to map the Biodiversity Intactness Index globally based on a model29, which produced inaccurate results for Africa30 (likely in part because of the under-representation of African data in the model). The bii4africa dataset that we present here has a broad range of additional uses, including assessing and mapping ecosystem condition to inform national planning and reporting on Goal A in the post-2020 Global Biodiversity Framework; alleviating geographic and taxonomic biases in global biodiversity indicators and maps; parameterising models of biodiversity in a changing world; informing the IUCN Red List of Ecosystems; supporting the United Nations Decade on Ecosystem Restoration in identifying priority ecosystems and monitoring the impact of investments into restoration; identifying the properties of novel ecosystems; and informing future research and training in African biodiversity (Table 3). Importantly, the dataset—co-produced by 200 experts—embodies context-specific knowledge on African biodiversity that contributes to inclusivity in ecology31. It is also a positive response to the recent call by the Intergovernmental Science-Policy Platform on Biodiversity and Ecosystem Services (IPBES) for African-led research that closes knowledge gaps by mobilising local data24.
Methods
Elicitation planning and expert recruitment
We implemented a published, modified-Delphi protocol (multiple rounds of individual, independent expert estimation interspersed with group discussion and review; Fig. 1), which has been shown to improve the rigour of elicitation outcomes25. The elicitation was limited to terrestrial vertebrates (tetrapods) and vascular plants – groups that comprise species with a high diversity of attributes and functions. Experts were sought with knowledge of the degree to which human land uses impact populations of these species groups in sub-Saharan Africa (or a region therein). Such expert knowledge is typically limited to one taxonomic class (e.g., birds or reptiles), or in the case of mammals, often just one or several orders (e.g., primates or bats). As such, multiple expert elicitation processes were run between November 2020 and January 2022, to cover the various broad taxonomic groups of species (see Table 1). An expert in each broad taxonomic group was invited to lead the elicitation for that taxonomic group. Each ‘lead expert’ was identified based on their relevant expertise and existing network across the continent or willingness to develop such a network. For example, several lead experts serve in the IUCN Species Survival Commission working groups and other regional networks (e.g., https://ascaris.org/; https://www.birdlife.org/our-partners-africa/). The lead expert was responsible for identifying experts and inviting them to participate, as well as proposing a draft list of species response groups and providing input into the development of the land use categories. These tasks are detailed in the subsequent sections.
Identifying and recruiting experts
A broad definition of expertise was used to identify experts, centred on experience of how sub-Saharan species are impacted by human land uses25,32. Diverse types of people can have such experience (e.g., researchers, field or tour guides, park rangers, conservation practitioners, museum curators, and consultants), and inclusion was thus not limited to specific qualifications or institutional affiliations. The aim was to include about 20 experts for each broad taxonomic group, according to guidelines based on practicality and evidence of limited improvements in group performance above 6 to 12 experts25.
The lead expert identified individuals known to have relevant expertise. If this activity did not achieve the target of 20 individuals, additional experts were identified through relevant publications (using appropriate search terms on Google Scholar) and websites (e.g., specialist nature guides or tours, conservation organisations). In some cases, participating experts were asked to recommend other experts (snowball sampling). An invitation was emailed by the lead expert to each identified expert, explaining the project and what would be required of them. Experts confirmed that they had the relevant experience and were willing to participate by returning a signed consent form, including demographic details (notably taxa, years and region of experience). Ethical clearance for the project was provided by Stellenbosch University (project number 15182).
Of the 248 experts who agreed to participate, a total of 200 (81%) participated in the full elicitation process (https://bii4africa.org/category/experts/), with an average of 24 experts per broad taxonomic group (Fig. 2). These experts were from 39 countries, including 23 African countries (59% of experts were African nationals). Most experts (72%) were resident in Africa at the time of elicitation, across 26 countries. Their experience spanned sub-Saharan Africa, with Southern Africa being best represented, followed by East Africa, and West Africa having the lowest representation. Experts worked in a range of sectors, most commonly at universities, followed by research institutes and conservation organisations. Collectively, experts had over 3,300 years of relevant accumulated experience, with a mean (±SD) of 18 ± 10 years per expert.

Attributes of the 200 participating experts. All values in white font (and black font on the cord plot) represent the number of experts. Numbers do not add up to 200 when categories are not mutually exclusive (region, taxonomic group, employment sector) or when experts did not report a certain attribute (unk = unknown; Mamm = Mammals; org. = organisation).
Identifying and describing species response groups
It was not possible for experts to estimate the impact of different human land uses on the abundance of every terrestrial vertebrate and vascular plant species in sub-Saharan Africa (±50,000 species), both because of the large number of estimates that would be required, and because there are many species for which there is limited ecological knowledge. Therefore, species that were expected to respond in a similar way to human land uses were assigned to a ‘species response group’28. These groups can be considered broadly synonymous to functional groups33, though our focus is specifically on common responses of population abundance to human land use.
Within each broad taxonomic group (Table 1), the lead expert proposed a draft set of species response groups, based on their knowledge of the key organismal attributes likely to determine the impact of different land uses on populations. These draft species response groups were presented to the participating experts for that taxonomic group during an introductory planning meeting (see Structured expert elicitation section below) and revised based on experts’ feedback. Key organismal attributes that informed species response group categorisation varied between the taxonomic groups (Table 1; Supplementary Table 1). For terrestrial vertebrates, attributes commonly included habitat requirements (e.g., forest, grassland, generalist), body size, diet and stratum (e.g., arboreal, fossorial, rupicolous). Terrestrial vascular plants were divided into three broad groups: trees and shrubs, graminoids, and forbs, and species response groups were described within each broad group based on a framework of life-history strategies shaped by disturbance34. Species response groups were thus ecologically defined, not necessarily taxonomically defined. Large mammals were an exception to the response-group approach. The elicitation was done at species level for the seven large carnivores and 95 large herbivores. While the large herbivores were initially categorised into response groups, experts decided during the introductory meeting to estimate per species rather than per species response group. Thus, for large herbivores, we present species response groups, as well as species-level estimates. Details of each response group are included in the ‘Sp_Groups’ spreadsheet in the bii4africa dataset35.
For each broad taxonomic group of terrestrial vertebrates, the lead expert allocated each IUCN-listed species (up to date at the time of the elicitation) in sub-Saharan Africa into the appropriate species response group, with input from participating experts where necessary (‘Sp_Vert’ spreadsheet in the bii4africa dataset35). Determining an average intactness score across species for a given region (country, ecoregion, biome, etc.) can thus be done including only the species that occur in that region, based on species range maps available through the IUCN Red List26. By contrast, allocating each plant species into its respective response group was not possible given the large number of species (~45,000). Because of this limitation, a biogeographical delineation was included in the elicitation process. Experts were asked to provide estimates for the plant species response groups in eight biogeographical units (forest, Caesalpinioid-miombo humid savanna, mixed-acacia savanna, grassland, shrubland, thicket, desert and fynbos). These represent the major sub-Saharan African biomes, with savanna—the most extensive biome—treated as two biomes differentiated by distinct vegetation types. This delineation ensured that only plants present in each biome were considered in the estimation process and in any subsequent data aggregations. Because biome-specific environmental and evolutionary assembly processes act as a strong filter to the set of ‘available traits’, not all plant response groups occur in all biomes (e.g., there are no fire-tolerant forbs in the forest biome). Plant experts were also asked to estimate, within the broad groups of trees and shrubs, forbs and graminoids, the proportion of species within each species response group in each biome (‘Sp_Plant’ spreadsheet in the bii4africa dataset35). These estimates provide a proxy for the distribution of species richness across the plant groups in each biome (e.g., the proportional richness of the graminoid response groups in the desert biome sums to 1). To enable data users to consistently spatialise these biomes, each ecoregion (based on Ecoregions2017© Resolve map36) was allocated to one (or two, if considered a mosaic) of these eight biomes informed by the literature37,38,39 and expert opinion (‘Biome’ spreadsheet in the bii4africa dataset35).
Identifying and describing land use categories
Intactness scores were estimated for nine distinct land uses (Table 2). These land uses with varying intensities of human modification were selected to capture the major land covers, uses and associated activities relevant to sub-Saharan Africa, while being broadly comparable with other land-use maps (e.g., Ellis et al.40; Goldewijk et al.41; Hurtt et al.42). Experts made estimates at a ‘landscape’ scale (i.e., several square kilometres). A finer ‘patch’ scale (i.e., several square metres) would be inappropriate for an expert-elicited approach because experts need to consider multiple activities in an area that impact species. For example, a patch of vegetation in a city is likely to have a different impact on a species than a patch of vegetation in a smallholder cropland or a protected area (particularly for large-bodied or wide-ranging species). Instead, the landscape of land covers, uses and activities characteristic of each land use category were described to experts (Table 2), who were asked to consider the collective impact on the abundance of a given group of species within that land use28.
Experts were provided with photographic examples of these land uses to help visualise them and promote consistency in scoring between experts (Supplementary Table 2). For each land use, experts were asked to visualise a specific landscape with which they are familiar that matched the description provided, or several such landscapes across which they could consider an average. Experts were instructed to consider the integrated impact of all characteristics of that landscape (e.g., habitat loss and fragmentation, land cover change, disturbance by people, their domestic animals, infrastructure, pollution, harvesting, persecution, introduced species and diseases, elimination of mutualistic species, altered fire and herbivory regimes) on each species response group. Integrated information at a landscape scale is also likely to be more useful for certain decision-maker needs than fine-scale, species-level data23.
Structured expert elicitation
The IDEA (‘Investigate’, ‘Discuss’, ‘Estimate’, and ‘Aggregate’) structured expert elicitation protocol25 was used (Fig. 1). It is a modified-Delphi procedure that treats each step as a process of formal data acquisition, incorporating research from mathematics, psychology, and decision theory to help reduce the influence of biases and enhance the transparency, accuracy, and repeatability of the resulting estimates25. The protocol was implemented as follows for each of the broad taxonomic groups:
-
1.
Investigate: A one-hour online meeting was held to introduce the project and explain what was expected of participating experts. Experts had an opportunity to ask questions. The lead expert also presented the draft species response groups and received feedback from the participating experts that, in many cases, led to revisions of these groupings. Afterwards, experts were emailed a recording of the meeting, written instructions, and a survey spreadsheet in which to provide estimates. Experts could provide estimated intactness scores for all species response groups (ranging from six groups for primate experts to 33 for plant experts; Table 1) in all nine land uses (Table 2) or for a subset of species response groups and land uses, depending on the extent of their knowledge. Experts were encouraged to provide any comments relevant to each estimate (e.g., land use characteristics that could influence their score, assumptions that they made, uncertainties, the likely score range across species in a group, and any other explanatory information). Experts could also add general reflections to a comments box at the bottom of the spreadsheet. This qualitative information was useful when aggregating the data (step 2), to gain insight into the reasoning behind experts’ scoring, and detect potential inconsistencies between experts. Experts were asked not to talk to other participants about their estimates to ensure that they did not influence each other’s initial scoring. Experts were encouraged to use other means available to them to inform their scoring, such as talking to colleagues, consulting literature and relevant species reference lists, drawing on experience, and acquiring and interpreting data. They were given two weeks to email their ‘Round 1’ spreadsheet to the project lead.
-
2.
Discuss: A one to 1.5-hour online meeting was convened, where aggregated (anonymised) results from Round 1 were presented to participating experts. These aggregated results included boxplots showing the range of estimates that experts provided for each response group and land use (and biome, for plants), and 95% confidence interval plots showing trends in mean intactness scores across experts for each response group–land use combination (see examples in the right-hand panels of Figs. 3, 4). Project and expert leads reflected on key trends and sources of variability, and any insights or discrepancies (e.g., when it was apparent from experts’ spreadsheet comments that they were interpreting a given land use in different ways). The project lead then facilitated a discussion among the experts, where they were encouraged to share their experiences from Round 1 (e.g., with what did they struggle; what helped them) and to reflect on the aggregated results (e.g., their insights for the species response groups they know well, or any results that surprised them). They were encouraged to discuss outlying (anonymous) expert estimates and why they may have occurred. The project lead emphasised that the purpose of the discussion was not to reach consensus. Rather, it was to interrogate sources of variability, improve the consistency with which experts were interpreting the species response groups and land uses, and cross-examine reasoning, assumptions and evidence, thereby sharing insights between experts to promote learning25. (We found this discussion meeting to be a particularly useful step in the process, with many experts providing feedback saying that they found it an enjoyable opportunity to learn from each other.)
Fig. 3 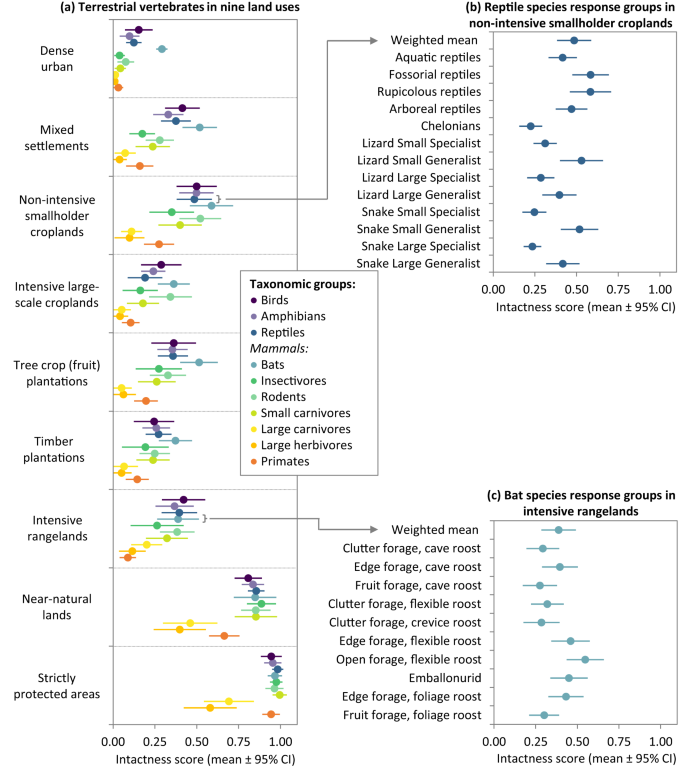
Intactness scores depicting the remaining proportions of ‘intact’ reference populations of terrestrial vertebrates (tetrapods) in different land uses, where 0 indicates that no individuals remain and 1 indicates the same number of individuals as in an ‘intact’ reference population. Average scores across experts (±95% confidence intervals; CI) are shown. The left panel (a) depicts an aggregated score for each taxonomic group and land use – an average across species response groups, weighted by species richness (i.e., response groups representing a higher number of species in a taxonomic group count more towards its aggregated score). The right panels show examples of the scores for species response groups in two taxonomic groups in different land uses: (b) reptiles in non-intensive, smallholder croplands and (c) bats in intensive rangelands.
Fig. 4 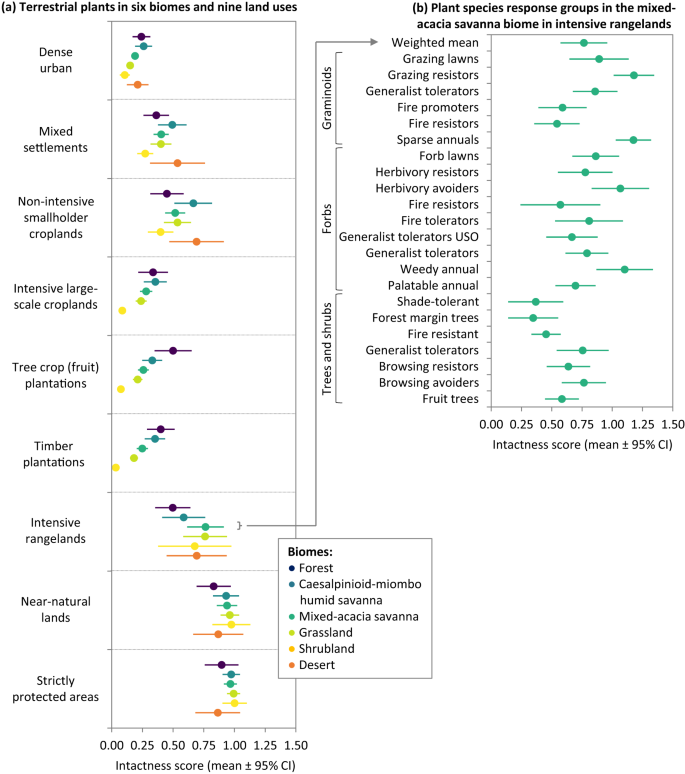
Intactness scores depicting the remaining proportions of ‘intact’ reference populations of terrestrial vascular plants in different land uses, where 0 indicates that no individuals remain and 1 indicates the same number of individuals as in an ‘intact’ reference population. Average scores across experts (±95% confidence intervals; CI) are shown. The left panel (a) depicts an aggregated score for plants in each land use in each biome – an average across species response groups, weighted by species richness (i.e., response groups representing a higher number of species in a biome count more towards its aggregated score). The right panel (b) shows an example: the scores for plant species response groups in intensive rangelands in the mixed-acacia savanna biome. (Thicket and fynbos biomes are not shown because of low sample sizes: <3 expert scores across all land uses; USO = underground storage organ).
-
3.
Estimate: An email was sent to participating experts with instructions for Round 2 of the elicitation. This email included a recording of the discussion meeting, written summary of key points, and the Round 1 aggregated results plots. Based on the meeting discussion and summary, experts were asked to revisit their initial scores and independently revise any of these scores if they deemed it necessary (again without discussing their individual scores with other participants). It was emphasised that the objective was not to revise their scores to be closer to the ‘mean’, but rather to revise scores if the discussion gave the expert additional insight that caused them to reconsider their initial estimates (which may or may not result in their revised scores being closer to the mean). Experts had one week to either send revised estimates to the project lead, or to confirm that they did not need to make any revisions.
-
4.
Aggregate: Final ‘Round 2’ estimates were aggregated by calculating the mean expert score and confidence interval across expert scores, for each species response group and landscape (and biome for plants). These final confidence interval plots were shared with experts via email. The average change from Round 1 to 2 in variation between expert estimates was assessed (see Technical Validation). The resulting dataset of intactness scores35 includes both individual experts’ Round 2 estimates and associated comments (‘Scores_Raw’ spreadsheet) and aggregated scores across experts (‘Scores_Agg’ spreadsheet).


Data Records
The bii4africa dataset is presented in a multi-spreadsheet .xlsx (Microsoft Excel Spreadsheet) file, which is freely accessible in Figshare35. The raw data spreadsheet (‘Scores_Raw’) includes 31,313 individual expert estimates of the impact of a sub-Saharan African land use (Table 2) on a species response group of terrestrial vertebrates or vascular plants (Table 1). Estimates are reported as intactness scores – the remaining proportion of an ‘intact’ reference (pre-industrial or contemporary wilderness area) population of a species response group in a land use, on a scale from 0 (no individuals remain) through 0.5 (half the individuals remain), to 1 (same as the reference population) and, in limited cases, 2 (two or more times the reference population). For species that thrive in human-modified landscapes, scores could be greater than 1 but not exceeding 2 to avoid extremely large scores biasing aggregation exercises. Such truncation is common in standardised biodiversity metrics18,28,43. Expert comments are included alongside respective estimates.
The raw dataset links, via unique species response group codes, to a spreadsheet (‘Sp_Groups’) describing the species response groups for which experts provided intactness scores (see summary in Table 1). For terrestrial vertebrates, the response group codes also link to a spreadsheet (‘Sp_Vert’) containing all IUCN-listed species in sub-Saharan Africa. Each species has been assigned to one species response group. As large herbivores were initially allocated to response groups but ultimately scored at the species level (see Identifying and describing species response groups section), each species has been assigned the appropriate response group code, with a unique letter differentiating species (e.g., African elephant and black rhinoceros, both in the ‘megaherbivore’ response group LH1 in Supplementary Table 1, are assigned codes LH1A and LH1B, respectively). For terrestrial vascular plants, the response group codes link to a spreadsheet (‘Sp_Plant’) containing aggregated expert-elicited estimates of the proportion of species in each biome that constitute each response group, within the broad groups of trees and shrubs, forbs and graminoids. Biome names also link to a spreadsheet (‘Biomes’) that includes a list of the 89 mainland Afrotropical ecoregions36, each allocated to one biome (or two biomes if considered a mosaic).
The raw dataset links via unique, anonymous expert codes to a spreadsheet (‘Experts’) listing the region(s) of expertise of each expert (Central Africa, East Africa, Horn of Africa, Southern Africa, West Africa). A summary of the attributes of the 200 participating experts (including their regions of expertise) is provided in Fig. 2. Expert codes are also linked to a spreadsheet (‘Comments’) containing general comments made by experts. The number of intactness scores provided by each expert (‘Scores_Raw’) varied based on the elicitation that they participated in (e.g., primate experts were asked to score six species response groups, while bird experts were asked to score 17 such groups, see Table 1) as well as their extent of expertise (i.e., some experts provided scores for only a subset of species response groups and/or land uses). On average, each expert provided 155 intactness scores.
The number of experts estimating an intactness score for a given species response group in a given land use (and biome for plants) varied from one to 28, with an average (±SD) of ten (±7) experts providing independent scores for a particular combination. Arithmetic means are the most widely used form of data aggregation in applications of the IDEA expert elicitation protocol25. For each species response group in each land use (per biome for plants), we report the mean intactness score across experts, the number of experts providing a score (sample size), as well as the variability in scores between experts (standard deviation, standard error, 95% confidence interval; ‘Scores_Agg’ spreadsheet). Figs. 3, 4 visualise the data at two levels of aggregation. The right-hand panels display examples of the aggregated (‘Scores_Agg’) data for reptiles and bats (Fig. 3) and mixed acacia-savanna plants (Fig. 4). These plots depict the variation in how different species response groups within a given taxonomic group are expected to be impacted by a given land use (differences between response group mean scores). They further depict variation between estimates of individual experts (95% confidence intervals around each response group mean score).
The left-hand panels in Figs. 3, 4 display a further level of data aggregation, in which intactness scores for each taxonomic group in each land use are presented. Each score is an average across the associated species response group means and confidence intervals (‘Scores_Agg’), weighted relative to the proportion of species in that response group (‘Sp_Vert’ and ‘Sp_Plant’). In other words, each species in sub-Saharan Africa counts equally in the aggregated intactness score. Such an aggregation could similarly be performed for all species in a given ecoregion, country, or other spatial unit. The dataset can be downloaded together with an R code script for performing such aggregations.
Notably, the ‘strictly protected areas’ land use does not always have an intactness score of 1 (i.e., equivalent to a pre-industrial ‘intact’ reference population; Figs. 3, 4). These lower scores are because (a) some species benefit from human-related disturbances that would have been present in a pre-industrial landscape but are no longer present in a strictly managed protected area and (b) for particularly large, wide-ranging species, even the best-managed protected area is unlikely to contain a ‘pre-industrial’ reference population (e.g., Prins et al.44; Balme et al.45). It is also worth noting that not all protected areas in the region are strictly protected in practice – these protected areas were not considered in this land use category, and intactness scores for such protected areas would likely be closer to the ‘near-natural lands’ land use or even some of the other land use categories (e.g., intensive rangelands or non-intensive smallholder croplands; Table 2), depending on the activities occurring in these areas.
Technical Validation
The reliability of expert judgement will always be sensitive to which experts participate and how questions are asked. Each step of the IDEA structured expert elicitation protocol makes use of procedures that have been demonstrated to improve elicitation rigour25. These include the identification and recruitment of experts, the framing of questions, the two rounds of independent estimation and the aggregation, review and critical appraisal of expert judgements during a facilitated group discussion (see Methods).
The purpose of the facilitated group discussion is not to reach consensus25. In our case, experts could disagree on how species are likely to respond to land uses, particularly for lesser-known species groups. Rather, the discussion in a modified-Delphi process aims to resolve linguistic ambiguity, promote critical thinking, share evidence, and improve the consistency with which experts interpret the questions25. Thus, we would expect some but not all of the variability in expert scores to reduce in the second round of the elicitation process, subsequent to the group discussion. The standard error around expert scores for each species response group in each land use (and in each biome for terrestrial vascular plants) was lower in the second, compared with the first, round of the elicitation for 85% and 88% of terrestrial vertebrate and plant intactness scores respectively (Fig. 5). On average, there was a reduction in standard error of 0.01 for vertebrates and 0.03 for vascular plants (Fig. 5). Thus, the variability in estimates between experts was generally lower following the group discussions, indicating that the elicitation process resulted in improved scoring consistency between experts.

Change in the variation (standard error) of estimated intactness scores for each species response group and land use, between the first and second round of the expert elicitation process. Boxplots show median (horizontal line in the box), interquartile range (box), and max/min values within 1.5 times the interquartile range (vertical lines). Values less than 0 (below the red-dashed horizontal line) show a decrease in score variability between experts. For terrestrial vertebrates, results are shown per taxonomic group; for terrestrial vascular plants they are shown per biome. (C-m = Caesalpinioid-miombo; Mamm = Mammals).
We would also expect a reasonable degree of consensus between experts, and therefore for the variability between their scores to be significantly lower than that of chance. To test this expectation, we generated a random estimate within the allowed range (0 to 2) for each Round 2 expert estimate. We then determined the standard error around these random estimates for each species response group and land use (and biome for terrestrial vascular plants). This process ensured comparable sample sizes between expert estimates and random estimates. The standard error in expert estimates was significantly lower than that expected by chance (paired t test: t = −54.58, d.f. = 2796, p < 0.001). On average, the standard error in expert estimates in Round 2 was 63% lower than expected by chance (0.075 compared with 0.200). These results suggest that (1) the IDEA protocol served to promote consistency in scoring between experts and (2) experts were significantly more consistent in their scoring than expected by chance.
Validating this dataset using available field-collected data is limited by a spatial and temporal scale mismatch. Most field data are collected at the ‘patch’ scale, while the landscape scale was appropriate for producing this dataset, as explained in the methods. The experts considered diverse land covers and activities characteristic of each land use type (Table 2) to estimate their collective impact on a population in that land use. For example, in an agricultural landscape there is likely to be a higher abundance of fossorial reptiles in the habitat remnants than in the surrounding croplands. This landscape composition was considered by experts when estimating the overall remaining proportion of a reference population of these reptiles in a landscape characterised by non-intensive, smallholder croplands (or intensive, large-scale croplands, with fewer remnant habitat patches). In contrast, field studies tend to report land use at the scale of the habitat or cropland patch. For example, in the PREDICTS database22—the largest global dataset of species abundances in different land uses—the only relevant cropland data46 for Afrotropical birds contains bird counts in ‘private farmhouse gardens surrounded by agricultural matrix’. This ‘patch’ scale, focused on a small subset of land covers and activities in an agricultural landscape, is incompatible with the cropland landscapes that experts considered (Table 2). The spatial and temporal scale of the reference site can also be mismatched. For example, the only relevant plantation data47 for Afrotropical birds in the PREDICTS database has a reference site of ‘forest fragments in timber plantations’, which is incompatible with the landscape-scale pre-industrial/large wilderness area reference state that experts considered in this study. While this scale mismatch limits validation using existing field data across multiple regions and taxa, future research aimed at validation could design landscape-scale data collection protocols that are more comparable (i.e., developing landscape-scale data collection protocols with multiple multi-taxa sampling sites evenly distributed across different land uses across the region). However, the absence of a ‘pre-industrial’ reference in field-collected data can still impede comparison17.
Usage Notes
A non-exhaustive list of potential uses of the bii4africa dataset is provided in Table 3. The data are best suited to broad-scale, multi-species applications, rather than finer-scale applications for which site-specific, field-collected data would be more appropriate. The standardised nature of the intactness scores (0–2 scale) means that the data (or a subset thereof) can be aggregated in several ways to meet a user’s needs, e.g., by taxonomic group, functional type, land use and/or spatial (e.g., biogeographical or political) unit (see R code provided for aggregating the data35). To assist with data aggregation, scores for response groups can be linked back to individual species for terrestrial vertebrates (noting that large mammal scores are already at species level). Spatial distributions of these species are available from the IUCN Red List26. A species list can thus be obtained for the area of interest, and those species scores then extracted from the bii4africa dataset. While the scores for terrestrial vascular plants are not connected to individual species, scores are provided per biome, meaning the data can be extracted at biome-scale, informed for example by the WWF ecoregion maps36. The proportions of terrestrial vascular plant species in each response group per biome are also provided, enabling the weighting of score aggregations relative to the proportion of species that those scores represent. Data can also be aggregated according to the regional expertise of the contributing experts (e.g., using scores from only West African experts for a West African data application, or for testing differences between regions). For some species groups such as large mammals and birds, regional considerations such as whether bushmeat harvesting is prevalent can have an influence on experts’ intactness scores.
While the data presented here are non-spatial, they can be made spatially explicit by linking the scores for different land uses to a map of those land uses (encompassing sub-Saharan Africa or a region therein). As the land uses were selected to reflect those most common in sub-Saharan Africa, the map used to spatialise the data should include those classes (urban, crop, plantation, rangeland, near-natural, protected). See Scholes and Biggs28, Newbold et al.29 and Schipper et al.18 for examples of mapping Biodiversity Intactness based on intactness scores for different land uses. Different land use intensities (e.g., dense urban vs mixed settlements; smallholder vs large-scale cropland; rangeland vs near-natural land) could also be mapped using proxies such as percentage urban cover48 and population density49 in human settlements; percentage crop cover50, nitrogen input51 and field size52 in croplands; livestock density53 in rangelands; etc. Importantly, as land use changes across the region, estimates and maps of intactness can be updated using the bii4africa dataset.
Following the IDEA protocol recommendations25, outliers were not removed from the data when determining mean intactness scores across experts (‘Scores_Agg’ spreadsheet in the dataset). Rather, anonymised outliers were flagged in the discussion meeting, after which experts who provided such scores could reconsider if they were appropriate and revise them if not. Equally weighted data aggregations (i.e., arithmetic means) can be sensitive to outliers in small groups, and we thus recommend careful consideration regarding the use of mean scores that are based on a low number of experts. This consideration is most relevant for large mammals and terrestrial vascular plants – the only groups with mean scores for some species (large mammals) or species response groups (plants) in some land uses based on fewer than the recommended six experts25. With an average of 10 contributing experts per mean score, our dataset has a considerably larger ‘sample size’ than other similar processes (e.g., n = 3)28. We report sample size and standard deviation in our aggregated dataset, as well as provide the raw data, enabling users to assess whether the degree of variability in scores is acceptable for their purposes. We also think the scores with higher variability (i.e., less consensus between experts) could identify important knowledge gaps regarding how species respond to land uses, or important regional differences, thus informing future empirical research.
Code availability
R code for calculating aggregated intactness scores for a focal region (e.g., ecoregion or country) and/or taxonomic group can be downloaded with the bii4africa dataset on Figshare35; see Data Records section.
References
Steffen, W., Broadgate, W., Deutsch, L., Gaffney, O. & Ludwig, C. The trajectory of the anthropocene: The great acceleration. Anthr. Rev. 2, 81–98 (2015).
Watson, J. E. M. & Venter, O. Mapping the continuum of humanity’s footprint on land. One Earth 1, 175–180 (2019).
Maxwell, S. L., Fuller, R. A., Brooks, T. M. & Watson, J. E. M. Biodiversity: The ravages of guns, nets and bulldozers. Nature 536, 143–145 (2016).
Dullinger, I. et al. Biodiversity models need to represent land-use intensity more comprehensively. Glob. Ecol. Biogeogr. 30, 924–932 (2021).
IPBES. Global assessment report on biodiversity and ecosystem services of the Intergovernmental Science-Policy Platform on Biodiversity and Ecosystem Services. (Secretariat of the Intergovernmental Science-Policy Platform on Biodiversity and Ecosystem services, Bonn, Germany, 2019).
Mace, G. M. et al. Approaches to defining a planetary boundary for biodiversity. Glob. Environ. Chang. 28, 289–297 (2014).
Steffen, W. et al. Planetary boundaries: guiding human development on a changing planet. Science 347, 1259855 (2015).
Manning, P. et al. Redefining ecosystem multifunctionality. Nat. Ecol. Evol. 2, 427–436 (2018).
Otu, A. et al. Africa needs to prioritize One Health approaches that focus on the environment, animal health and human health. Nat. Med. 27, 943–946 (2021).
Reyers, B. & Selig, E. R. Global targets that reveal the social–ecological interdependencies of sustainable development. Nat. Ecol. Evol. 4, 1011–1019 (2020).
Mace, G. M. et al. Aiming higher to bend the curve of biodiversity loss. Nat. Sustain. 1, 448–451 (2018).
Soto-Navarro, C. A. et al. Towards a multidimensional biodiversity index for national application. Nat. Sustain. 4, 933–942 (2021).
Hortal, J. et al. Seven Shortfalls that Beset Large-Scale Knowledge of Biodiversity. Annu. Rev. Ecol. Evol. Syst. 46, 523–549 (2015).
Stephenson, P. J. & Stengel, C. An inventory of biodiversity data sources for conservation monitoring. PLoS One 15, e0242923 (2020).
Tydecks, L., Jeschke, J. M., Wolf, M., Singer, G. & Tockner, K. Spatial and topical imbalances in biodiversity research. PLoS One 13, e0199327 (2018).
McRae, L., Deinet, S. & Freeman, R. The diversity-weighted living planet index: Controlling for taxonomic bias in a global biodiversity indicator. PLoS One 12, e0169156 (2017).
McNellie, M. J. et al. Reference state and benchmark concepts for better biodiversity conservation in contemporary ecosystems. Glob. Chang. Biol. 26, 6702–6714 (2020).
Schipper, A. et al. Projecting terrestrial biodiversity intactness with GLOBIO 4. Glob. Chang. Biol. 26, 760–771 (2020).
Tittensor, D. P. et al. A mid-term analysis of progress toward international biodiversity targets. Science 346, 241–248 (2014).
Newbold, T. et al. Global effects of land use on local terrestrial biodiversity. Nature 520, 45–50 (2015).
Oliver, T. H. et al. Declining resilience of ecosystem functions under biodiversity loss. Nat. Commun. 6, 1–8 (2015).
Hudson, L. N. et al. The database of the PREDICTS (Projecting Responses of Ecological Diversity In Changing Terrestrial Systems) project. Ecol. Evol. 4, 4701–4735 (2016).
Stephenson, P. J. et al. Unblocking the flow of biodiversity data for decision-making in Africa. Biol. Conserv. 213, 335–340 (2017).
IPBES. The IPBES regional assessment report on biodiversity and ecosystem services for Africa. (Secretariat of the Intergovernmental Science-Policy Platform on Biodiversity and Ecosystem services, Bonn, Germany, 2018).
Hemming, V., Burgman, M. A., Hanea, A. M., McBride, M. F. & Wintle, B. C. A practical guide to structured expert elicitation using the IDEA protocol. Methods Ecol. Evol. 9, 169–180 (2018).
IUCN. The IUCN Red List of Threatened Species. Version 2022-1. (2022).
Pörtner, H.-O. et al. Climate change 2022: Impacts, adaptation, and vulnerability. Contribution of Working Group II to the Sixth Assessment Report of the Intergovernmental Panel on Climate Change. (2022).
Scholes, R. J. & Biggs, R. A biodiversity intactness index. Nature 434, 45–49 (2005).
Newbold, T. et al. Has land use pushed terrestrial biodiversity beyond the planetary boundary? A global assessment. Science 351, 600–604 (2016).
Martin, P. A., Green, R. E. & Balmford, A. The biodiversity intactness index may underestimate losses. Nat. Ecol. Evol. 3, 862–863 (2019).
Trisos, C. H., Auerbach, J. & Katti, M. Decoloniality and anti-oppressive practices for a more ethical ecology. Nat. Ecol. Evol. 5, 1205–1212 (2021).
Krueger, T., Page, T., Hubacek, K., Smith, L. & Hiscock, K. The role of expert opinion in environmental modelling. Environ. Model. Softw. 36, 4–18 (2012).
de Bello, F. et al. Towards an assessment of multiple ecosystem processes and services via functional traits. Biodivers. Conserv. 19, 2873–2893 (2010).
Archibald, S., Hempson, G. P. & Lehmann, C. A unified framework for plant life-history strategies shaped by fire and herbivory. New Phytol. 224, 1490–1503 (2019).
Clements, H. S. et al. Faunal and floral population intactness estimates across sub-Saharan African land uses: The bii4africa dataset, figshare, https://doi.org/10.6084/m9.figshare.c.6710463.v1 (2023).
Olson, D. M. et al. Terrestrial Ecoregions of the World: A New Map of Life on Earth. Bioscience 51, 933 (2001).
Armani, M. et al. Enhancing climate change adaptation and mitigation actions on land in Africa. (Future Ecosystems for Africa, University of the Witwatersrand, Johannesburg, South Africa, 2022).
Sankaran, M. et al. Determinants of woody cover in African savannas. Nature 438, 846–849 (2005).
White, F. The vegetation of Africa, a descriptive memoir to accompany the UNESCO/AETFAT/UNSO vegetation map of Africa. UNESCO. Nat. Resour. Res. 20, 1–356 (1983).
Ellis, E. C., Beusen, A. H. W. & Goldewijk, K. K. Anthropogenic biomes: 10,000 BCE to 2015 CE. Land 9, 8–10 (2020).
Goldewijk, K. K., Beusen, A., Doelman, J. & Stehfest, E. Anthropogenic land use estimates for the Holocene - HYDE 3.2. Earth Syst. Sci. Data 9, 927–953 (2017).
Hurtt, G. et al. Harmonization of Global Land-Use Change and Management for the Period 850–2100 (LUH2) for CMIP6. Geosci. Model Dev. 13, 5425–5464 (2020).
Alkemade, R. et al. GLOBIO3: A framework to investigate options for reducing global terrestrial biodiversity loss. Ecosystems 12, 374–390 (2009).
Prins, H. H. & de Jong, J. F. The Ecohistory of Tanzania’s Northern Rift Valley – Can One Establish an Objective Baseline as an Endpoint for Ecosystem Restoration? in Tarangire: Human-Wildlife Coexistence in a Fragmented Ecosystem 129–161 (Springer International Publishing, 2022).
Balme, G. A., Slotow, R. & Hunter, L. T. B. Edge effects and the impact of non-protected areas in carnivore conservation: leopards in the Phinda-Mkhuze Complex, South Africa. Anim. Conserv. 13, 315–323 (2010).
Neuschulz, E. L., Botzat, A. & Farwig, N. Effects of forest modification on bird community composition and seed removal in a heterogeneous landscape in South Africa. Oikos 120, 1371–1379 (2011).
Farwig, N., Sajita, N. & Böhning-Gaese, K. Conservation value of forest plantations for bird communities in western Kenya. For. Ecol. Manage. 255, 3885–3892 (2008).
Pesaresi, M. & Politis, P. GHS-BUILT-S R2023A - GHS built-up surface grid, derived from Sentinel2 composite and Landsat, multitemporal (1975–2030). Joint Research Centre Data Catalogue https://doi.org/10.2905/9F06F36F-4B11-47EC-ABB0-4F8B7B1D72EA (2023).
Schiavina, M., Freire, S., Carioli, A. & MacManus, K. GHS-POP R2023A - GHS population grid multitemporal (1975–2030). Joint Research Centre Data Catalogue https://doi.org/10.2905/2FF68A52-5B5B-4A22-8F40-C41DA8332CFE (2023).
Potapov, P. et al. Global maps of cropland extent and change show accelerated cropland expansion in the twenty-first century. Nat. Food 3, 19–28 (2022).
Lu, C. & Tian, H. Global nitrogen and phosphorus fertilizer use for agriculture production in the past half century: Shifted hot spots and nutrient imbalance. Earth Syst. Sci. Data 9, 181–192 (2017).
Lesiv, M. et al. Estimating the global distribution of field size using crowdsourcing. Glob. Chang. Biol. 25, 174–186 (2019).
Gilbert, M. et al. Global distribution data for cattle, buffaloes, horses, sheep, goats, pigs, chickens and ducks in 2010. Sci. Data 5, 1–11 (2018).
Keith, D. A. et al. The IUCN red list of ecosystems: Motivations, challenges, and applications. Conserv. Lett. 8, 214–226 (2015).
Jetz, W. et al. Essential biodiversity variables for mapping and monitoring species populations. Nat. Ecol. Evol. 3, 539–551 (2019).
Hill, S. L. L. et al. The Ecosystem Integrity Index: a novel measure of terrestrial ecosystem integrity with global coverage. bioRxiv 2022.08 (2022).
Hansen, A. J. et al. Towards monitoring forest ecosystem integrity within the Post-2020 Global Biodiversity Framework. Conserv. Lett. 14, e12822 (2021).
Laurance, W. F., Sloan, S., Weng, L. & Sayer, J. A. Estimating the Environmental Costs of Africa’s Massive ‘Development Corridors’. Curr. Biol. 25, 3202–3208 (2015).
Hobbs, R. J., Higgs, E. & Harris, J. A. Novel ecosystems: implications for conservation and restoration. Trends Ecol. Evol. 24, 599–605 (2009).
Di Marco, M. et al. Projecting impacts of global climate and land-use scenarios on plant biodiversity using compositional-turnover modelling. Glob. Chang. Biol. 25, 2763–2778 (2019).
Harfoot, M. B. J. et al. Emergent Global Patterns of Ecosystem Structure and Function from a Mechanistic General Ecosystem Model. PLoS Biol. 12, e1001841 (2014).
Acknowledgements
This work was funded by a Jennifer Ward Oppenheimer Research Grant.
Author information
Authors and Affiliations
Contributions
H.S.C. led project conceptualisation and the expert elicitation processes, aggregated the data, ran the workshops, and drafted the manuscript. E.D.L.S. (small carnivores), G.H. (large mammals and graminoids), B.L. (primates), B.Ma. (reptiles and amphibians), A.Mon. (bats, rodents, insectivores), F.S. (forbs), C.R. (birds), and N.S. (trees and shrubs) contributed as lead experts: conceptualising and leading an elicitation process for their respective taxonomic groups, contributing their own independent expert estimates, as well as giving input during a feedback workshop and on the draft paper. R.Bi. and A.D.V. contributed to initial project conceptualisation, provided input during an inception and two feedback workshops, and provided input on the draft paper. R.Bl., M.Ch., K.J.E., M.Ham., B.R. and O.S. provided input during an inception and feedback workshop, and input on the draft manuscript. T.T. provided input during an inception and feedback workshop and assisted with data compilation. T.L. provided feedback on data structure, wrote the data aggregation code, and provided input during a feedback workshop. All other authors contributed as participating experts (see Structured expert elicitation section) and read and approved the draft manuscripts, with M.F.B., E.B., F.C., M.Co., P.M.K.C., C.De., F.D., M.D., L.G., P.Ga., J.S.G., M.Hau., C.K., M.T.K., A.l.R., A.T.K.L., A.M.L., K.Z.M., L.M., E.E.N., K.N., A.J.P., F.P., R.J.P., F.G.T.R., T.R., J.T.S., J.A.S., M.J.S., I.T., A.A.T., J.T.d.T., K.A.T., V.V.C., H.vd.M., J.A.V., N.W. and P.A.W. also providing input on the draft manuscript.
Corresponding author
Ethics declarations
Competing interests
All authors declare that they have no competing interests as defined by Nature Research, or other interests that might be perceived to influence the results and/or discussion reported in this paper.
Additional information
Publisher’s note Springer Nature remains neutral with regard to jurisdictional claims in published maps and institutional affiliations.
Supplementary information
Rights and permissions
Open Access This article is licensed under a Creative Commons Attribution 4.0 International License, which permits use, sharing, adaptation, distribution and reproduction in any medium or format, as long as you give appropriate credit to the original author(s) and the source, provide a link to the Creative Commons licence, and indicate if changes were made. The images or other third party material in this article are included in the article’s Creative Commons licence, unless indicated otherwise in a credit line to the material. If material is not included in the article’s Creative Commons licence and your intended use is not permitted by statutory regulation or exceeds the permitted use, you will need to obtain permission directly from the copyright holder. To view a copy of this licence, visit http://creativecommons.org/licenses/by/4.0/.
About this article

Cite this article
Clements, H.S., Do Linh San, E., Hempson, G. et al. The bii4africa dataset of faunal and floral population intactness estimates across Africa’s major land uses. Sci Data 11, 191 (2024). https://doi.org/10.1038/s41597-023-02832-6
Received:
Accepted:
Published:
DOI: https://doi.org/10.1038/s41597-023-02832-6
