
Abstract
This article introduces a dataset of human-machine interactions collected in a controlled and structured manner. The aim of this dataset is to provide insights into user behavior and support the development of adaptive Human-Machine Interfaces (HMIs). The dataset was generated using a custom-built application that leverages formally defined User Interfaces (UIs). The resulting interactions underwent processing and analysis to create a suitable dataset for professionals and data analysts interested in user interface adaptations. The data processing stage involved cleaning the data, ensuring its consistency and completeness. A data profiling analysis was conducted for checking the consistency of elements in the interaction sequences. Furthermore, for the benefit of researchers, the code used for data collection, data profiling, and usage notes on creating adaptive user interfaces are made available. These resources offer valuable support to those interested in exploring and utilizing the dataset for their research and development efforts in the field of human-machine interfaces.
Background & Summary
Human-machine interfaces (HMIs) serve as platforms for cognition and communication between humans and machines. They play a crucial role in transmitting information1. The study of User Experience (UX) in this field aims to enhance usability, performance, and overall user satisfaction by considering user motivation goals during interactions. According to Aranburu et al.2, users are motivated by a sense of autonomy, competence, and their emotional connection to the system. To enhance the UX, manufacturing companies should consider factors related to user motivation, such as intuitive and efficient task completion and the system’s anticipation of user needs. The latter is closely tied to the cognitive capacity of the user, which translates into the amount of memory required for the user to meet their goals3. Manufacturers can take advantage of the analysis of user interactions through artificial intelligence techniques that can respond to user motivators.
This paper presents a dataset that includes sequences of human-machine interaction with several machine elements to perform a particular process. Sequential behavior can indicate the level of expertise or familiarity with a given device or machine. In the literature, multiple authors have studied user interactions to understand user tasks and goals in a wide range of fields. For instance, in engineering design, McComb et al.4 demonstrated how to assist designers with previous design iterations using sequence learning. On the other hand, methods to analyze human-machine interactions exploit machine learning techniques. Recommendation systems can provide adaptation and personalization for users, which can help reduce the cognitive load and increase the user’s positive feelings3,5. For instance, the use of deep recurrent neural networks and collaborative filtering algorithms can perform sequential recommendation of content and control elements6. Furthermore, the analysis of interaction sequences benefits not only end-users directly but also assists UI evaluators in providing suggestions to improve the evaluated interface7. However, despite the clear contributions of these studies, the datasets are typically unavailable to practitioners and scholars.
The dataset presented in this article was collected with the primary aim to enable the development of Adaptive User Interfaces (AUIs) that can deliver benefits across a range of industrial applications. AUIs are artifacts designed to dynamically adjust to operator interaction patterns8. This means that any repetitive set of actions performed by an operator to complete a task can be considered an interaction pattern that can be automated9. Leading to more personalized interfaces that enhance productivity10. Hence, improving usability and UX overall. The dataset can also be applied to a wider range of use cases, including sequence-aware and context-aware applications that utilize data generated by devices and users to provide customized experiences and self-adaptable designs. By leveraging multiple sources of context, such as task, time and user context, these applications can provide personalized interactions that increase user productivity11. Overall, this dataset has the potential to support the development of adaptive systems that better meet the needs of users.
Methods
This section describes the data collection process. It starts by describing the design of the experiment and the setup, including a description of the acquisition and processing elements of the methodology.
Experimental set up
The experiment was conducted using a machine in which multiple operators interacted through the same HMI to perform a mixture creation task. In this scenario, an industrial mixing machine from the food sector was utilized, which offers the advantage of being regularly used throughout the day by several users across two working shifts. Each time a mixture was ordered, the operator carried out a series of individual interactions with the HMI. These interactions were related to adjusting various parameters, including additive quantity, mixture type, and the use of containers. These parameters directly influenced the properties of the final product.
Users interacted with the machine through a mobile app that was specifically designed for the experiment. Operators accessed the app by scanning a QR code, after which they proceeded to select the required mixture. The captured interactions included two key components: (i) the order and sequence of steps the user followed, and (ii) the time interval in which the user interacted with the machine.
Participants
Twenty-seven volunteer operators, aged between 23 and 45 years, participated in the experiment. Each operator granted formal consent to have their daily interactions recorded through the app. In total, 10,608 interactions were captured over a period of 151 days. All data was anonymized and does not contain sensitive user information.
Data acquisition methodology
Figure 1 illustrates the methodology for data acquisition, which begins with the preparation stage. This stage encompasses two steps: firstly, the user interface (UI) is formally described using a user interface description language (UIDL), which consists of a mark-up language that describes the entire HMI12. In this study, the JSON format was employed to represent each visual element in the HMI, with each element assigned a unique alphanumeric identifier.To provide an example of the UIDL utilized in this study, Fig. 2 displays a representation of the UI alongside its corresponding UIDL.
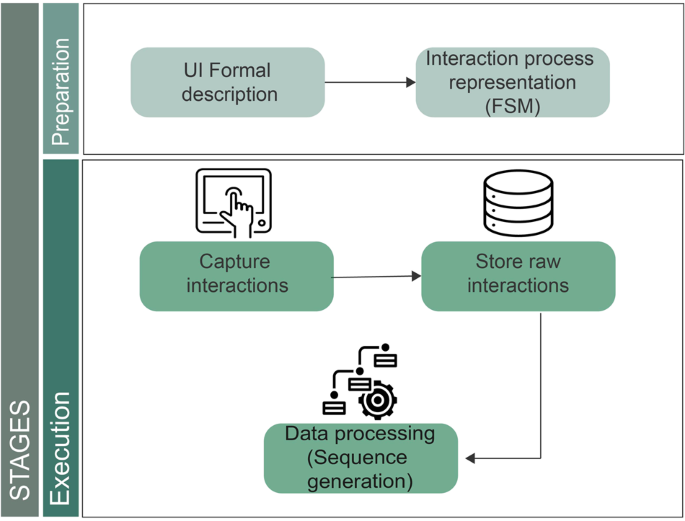
Data acquisition methodology.
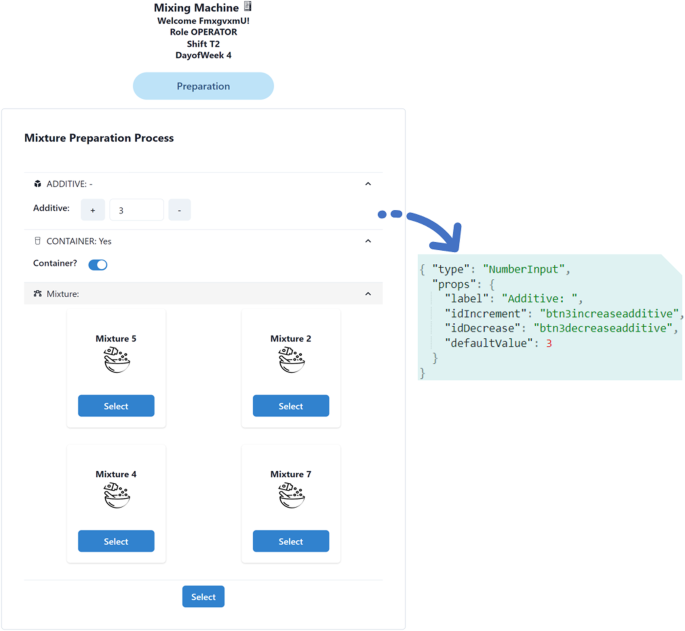
UIDL JSON description example of a UI.
The HMI was implemented using Next.js, a React framework and Chakra UI. A dedicated function was created to programmatically generate the HMI using the user interface descriptor. The interface is designed to be responsive and can be used on tactile devices.
Next, the interaction process representation required to prepare a mixture in the machine is described as a Finite State Machine (FSM), which is a model consisting of states, transitions, and inputs used to represent processes or systems. In this process, the user adjusts the parameters of a mixture until the values are considered correct (Fig. 3).
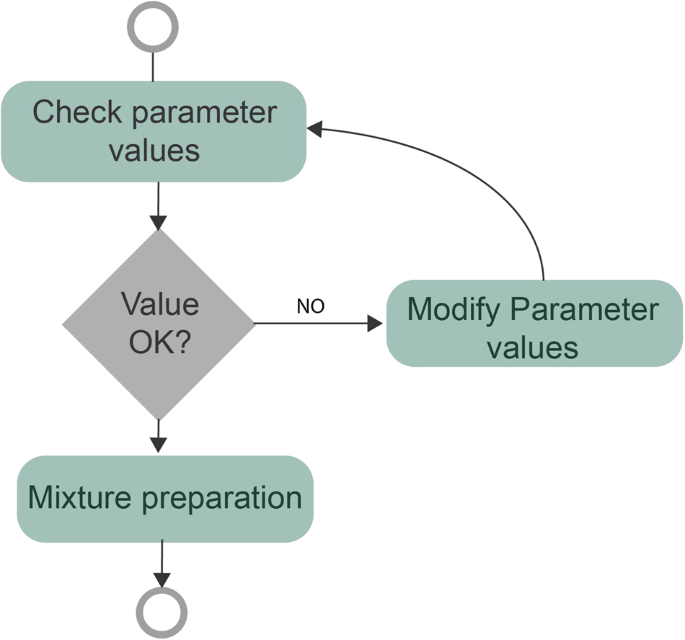
Interaction process representation (FSM).
During the active phase of the experiment, when users access the machine using the application, a non-intrusive layer captures the interactions and stores them in a database (capture interactions). The information captured includes the user identity, the timestamp of the interaction in EPOCH format, and the identification of the interacted element (store raw interactions) (see Table 1). Once this information is collected, the data processing step generates the sequences.
Data processing
The goal of this step of the methodology is to generate valid sequences of interactions for each user. Perer & Wang13 define a sequence of events \(E=\langle {e}_{1},{e}_{2},...,{e}_{m}\rangle \) (ei ∈ D) as an ordered list of events ei, where D is a set of events known and the order is defined by i. This means that the event ei occurs before the event ei+1. Additionally, in this process is considered that E must contain at least two events e to be accepted as a sequence9.
Using this definition and taking as input the raw interactions, it is possible to define valid interaction sequences as \({s}_{i}=\left[{e}_{begin},{e}_{1}^{i},\ldots ,{e}_{k}^{i},{e}_{end}\right]\) where si is a set of events and:
-
The events ebegin and eend are known, determining the beginning and the ending of the interaction sequence
-
The variable l determines the length of the interaction sequence and its value should be > = 2
The sequences are extracted using the “Valid sequences extractor” algorithm presented by Reguera-Bakhache et al.9. As demonstrated in the FSM (Fig. 3), the interaction process initializes when an interaction occurs in any of the elements that allow the parametrization of the mixture and finalizes when the user clicks the button BTN1OK.
From the 10,608 interactions recorded, 1358 valid sequence interactions were generated. The composition of each interaction sequence is described in the following section.
Data Records
The files can be downloaded from the Figshare14 data platform in a CSV format. The individual files are described below.
-
Raw interactions (raw_interactions.csv): Raw interactions represent each event performed by an user when interacting with an element of the machine, with their corresponding timestamp (see Table 1).
-
Users(users.csv): This file presents information about the profile of users that participated in the study. Table 2 presents the distribution of the participants based on age, gender and role.
Table 2 Participants distribution. Table 3 User interactions sequences descriptor.
-
-
User Interaction sequences (sequences_df_prep_EN.csv): Each row of this CSV file represents a valid interaction sequence to perform a task. This dataset was generated from the raw interactions following the “data processing” method previously described. Table 3 presents a description of the fields, classifying each field by the type of information they deliver, including some UX metrics relevant to the efficiency and effectiveness of the process. These represent more pragmatic aspects that focus on the task-oriented nature of an experience15.
-
User interface description (ui.json & hmi_elements.csv): The ui.json file serves as a JSON-formatted representation of every visual element within the study’s user interface. These elements are dynamically instantiated based on their component type. Table 4 provides a comprehensive overview of the various component types used, with the “interactive” column indicating which components are clickable for user interaction. To render the UI on the web application, we created a function in the app that reads and interprets the contents of the ui.json file. This allows to easily modify and update the UI as needed, without requiring significant changes to the underlying code (see sec:Code availability). The hmi_elements.csv is an informative file that lists the employed elements with their respective element IDs and component types.
Table 4 Type of components referenced on ui.json.
Technical Validation
Sequential analysis can serve as an indicator of human expertise and behavior when performing both highly specialized tasks and common ones. To achieve this, the data must be consistent, complete, and preprocessed. For the latter, it was necessary to clean the data and ensure that its suitability for the intended use. This involved tasks such as removing duplicate interactions and correcting errors. Subsequently, starting from the raw interactions, the next step was to generate valid sequences, a process depicted in the subsection Data processing.
To validate the resulting dataset (sequences_df_prep_EN.csv) and facilitate the reuse, a data profiling analysis was conducted. First, it was important to guarantee the consistency, which could be defined as data presented in the same standard structure and its correctness in relationship with other data16. Therefore, it was validated that the elements within the interaction sequences correspond to the elements on the UI JSON file, and the users’ IDs exist in the users.csv file.
Other general aspects were evaluated using the IBM API of Data Quality for AI17, this toolkit offers a range of quality estimation and data profiling metrics to assess the quality of ingested data in an objective and systematic manner. These metrics produce a score between 0 and 1 that quantifies the presence of data issues, with a score of 1 indicating that no problems were detected. These metrics are designed for tabular datasets and accept input in the form of comma-separated values files17. The main used metrics are described in Table 5.
The distribution of sequences was analyzed across different services, users, and time periods. Figure 4a, reflects that only a few services on the machine reach the maximum number of interactions, and the overall average of sequences per machine mixture is 84.85, whereas the median is 34.5. The data sparsity is an expected issue in applications that analyze user behavior, in which each user only interacts within a small set of items (i.e. recommendation systems)18. Similarly, in Fig. 4b there are users that engaged more with the application and record a higher number of interactions, having an average of 50.25 interaction sequences per user. These aspects must not be seen as a limitation in the utilization of the dataset but rather be a factor for data scientists to consider at the moment of developing and testing their models. Additional sources of contextual information regarding the interactions include the user roles and time periods. As the experiment was centered on machine usage, it was observed that the “operator” role accounted for the largest number of interactions (as illustrated in Fig. 4c), while weekdays exhibited a more evenly distributed pattern (Fig. 4d).
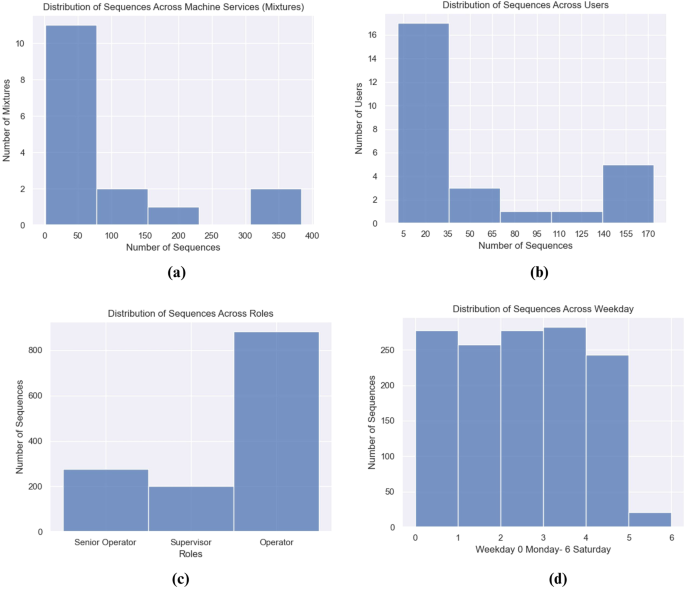
Sequences distribution (a) Distribution of Sequences Across Machine Services (b) Distribution of Sequences Across Users (c) Distribution of Sequences Across User Roles (d) Distribution of Sequences Across Weekdays.
Density-based clustering algorithms can be used to determine the hourly distribution over time for operators. This is a type of unsupervised learning technique that identifies different clusters based on the density of the points. Each detected cluster in a 1-Dimensional space determines the time interval where the interaction is most frequent.
To detect the clusters, first, we represented on a time axis each sequence from sequences_df_prep_EN.csv over time with a point. Second, MeanShift Algorithm19 is used to detect clusters and discard outliers. Figure 5a illustrates in a 1-Dimensional space the distribution of the interaction sequences from a single operator over time.
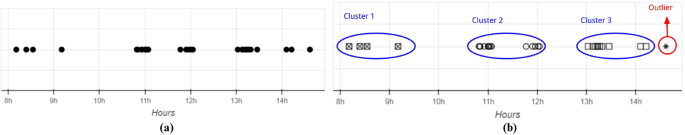
Distribution over time of interaction sequences (a) Distribution over time of interaction sequences from a single operator. (b) Identified clusters after applying Meanshift Algorithm for time interval detection.
Figure 5b shows different clusters detected by Meanshift Algorithm for previous sequences. For each cluster, the leftmost point determines the beginning of the time interval, and the rightmost point the end of the interval. Each of these clusters represents the time intervals where the interactions are more frequent.
Overall, the analysis of the dataset can provide valuable insights into user behavior and usage patterns that can aid in the development of recommendation systems, adaptive user interfaces, or other applications. The insights obtained from analyzing the distribution of sequences across different services, users, and time periods can assist data scientists in the usage of the dataset to consider these factors.
Usage Notes
Generating Adaptive HMI
When designing AUIs, several key dimensions should be taken into consideration. Oestrich et al.20 presented a morphological box that structures these dimensions. In Table 6, the aspects are related to the data available on the dataset to highlight reusability.
However, defining the adaptation goal is key, whether it focuses on enhancing performance or providing instructional support, as it guides the entire process. The goal will define the techniques that can be used. From our previous works10, the analysis of the clickstream sequences (interactionwu_prep field) aimed to provide performance support by identifying recurring operator-machine interaction patterns and automatically detecting the time intervals during which these patterns manifest most frequently. This, in turn, enables the creation of “time-based” adaptations through the generation of Event Condition Action (ECA) rules. Additionally, these adaptations extend to altering the “presentation” of interface elements, specifically the layout order automatically. This is achieved through a Python-based engine that adjusts the user interface descriptor according to the rules. Notably, our research findings have demonstrated a reduction of over 40% in operator interaction time, showcasing the practical benefits of AUIs in enhancing efficiency and productivity. Facilitating the design process, we have employed a straightforward user interface descriptor in JSON format. This descriptor simplifies the modification process necessary for generating these adaptations, thus enhancing the usability and accessibility of AUI design. However, as indicated in Table 6, the adaptation target can vary, and the methods for presenting the adaptation can include overlaying cues or highlighting elements.
For instance, in order to provide learning support, one approach is to predict the next step based on past instructions and automatically execute these instructions. In such cases, the presentation of visual elements serves a communicative purpose. We have developed an example of next-step prediction using Markov Chains, which serves as a baseline approach for researchers interested in reusing this dataset. The associated code will be made available for use, facilitating further research and development in this area. However, the discussion of the results is out of the scope of this paper.
For further processing of the Human-Machine interactions dataset, we recommend well-known Python libraries such as Pandas and Scikit-learn.
Code availability
The code to replicate the experiment is available online. The frontend of the experiment was developed using Next.js and Chakra UI. Next.js is a React framework that enables server-side rendering, automatic code splitting, and other useful features for building web applications. Chakra UI is a component library that provides a set of customizable and accessible UI components to build user interfaces quickly and easily. The UI layout is described in the file ui.json and rendered on the app through the function renderJSON. The backend was implemented using Node.js and Express, with a PostgreSQL database used to store data. The frontend and backend communicate with each other through a RESTful API, providing a secure and efficient way for data to be transmitted between the two. Researchers interested in replicating the experiment can access the code and customize it to their needs, allowing for greater flexibility and control over the experimental setup. More information can be found in the Github repository (https://github.com/mu-sse/adaptiveUIs-project/tree/main/app-mixing-machine).
The code for conducting technical validation has been developed using Python and is accessible through the GitHub repository provided in this document. To make use of the IBM API data quality for AI, a free sign-up process is necessary, which can be initiated at the following URL: https://www.ibm.com/account/reg/us-en/signup?formid=urx-50307. This sign-up process will provide access to the required API keys, as detailed in the accompanying documentation. For additional information and access to the code, please refer to the GitHub repository available online (https://gist.github.com/aicarrera/e6f99ea7f857de4c949afd2dfe1ff9be).
Code illustrating dataset usage in the context of sequential recommendation (next-step prediction) through Markov chains has been developed using Python, building upon prior research21. More information is available online in the Github repository (https://github.com/mu-sse/adaptiveUIs-project/tree/main/HMI-sequence-recommender).
References
Gong, C. Human-machine interface: Design principles of visual information in human-machine interface design. In 2009 International Conference on Intelligent Human-Machine Systems and Cybernetics, vol. 2, 262–265 (IEEE, 2009).
Aranburu, E., Lasa, G. & Kepa Gerrikagoitia, J. Evaluating the human machine interface experience in industrial workplaces. Proceedings of the 32nd International BCS Human Computer Interaction Conference 32, 1–5 (2018).
Champiri, Z. D., Mujtaba, G., Salim, S. S. & Chong, C. Y. User experience and recommender systems. In 2019 2nd International Conference on Computing, Mathematics and Engineering Technologies (iCoMET), 1–5 (IEEE, 2019).
McComb, C., Cagan, J. & Kotovsky, K. Capturing human sequence-learning abilities in configuration design tasks through markov chains. Journal of Mechanical Design 139 (2017).
Carrera-Rivera, A., Larrinaga, F., Lasa, G. & Martinez-Arellano, G. Ux- for smart-pss: Towards a context-aware framework. In Proceedings of the 6th International Conference on Computer-Human Interaction Research and Applications - Volume 1: CHIRA, 113–120, https://doi.org/10.5220/0011379700003323 INSTICC (SciTePress, 2022).
Soh, H., Sanner, S., White, M. & Jamieson, G. Deep sequential recommendation for personalized adaptive user interfaces. In Proceedings of the 22nd international conference on intelligent user interfaces, 589–593 (2017).
Charfi, S., Ezzedine, H., Kolski, C. & Moussa, F. Towards an automatic analysis of interaction data for hci evaluation application to a transport network supervision system. In International Conference on Human-Computer Interaction, 175–184 (Springer, 2011).
Miraz, M. H., Ali, M. & Excell, P. S. Adaptive user interfaces and universal usability through plasticity of user interface design. Computer Science Review 40, 100363 (2021).
Reguera-Bakhache, D., Garitano, I., Uribeetxeberria, R., Cernuda, C. & Zurutuza, U. Data-driven industrial human-machine interface temporal adaptation for process optimization. In 2020 25th IEEE International Conference on Emerging Technologies and Factory Automation (ETFA), vol. 1, 518–525 (IEEE, 2020).
Reguera-Bakhache, D. et al. An adaptive industrial human-machine interface to optimise operators working performance. In 2021 IEEE/ASME International Conference on Advanced Intelligent Mechatronics (AIM), 1213–1219 (IEEE, 2021).
Carrera-Rivera, A., Larrinaga, F. & Lasa, G. Context-awareness for the design of smart-product service systems: Literature review. Computers in Industry 142, 103730 (2022).
Guerrero-Garcia, J., Gonzalez-Calleros, J. M., Vanderdonckt, J. & Munoz-Arteaga, J. A theoretical survey of user interface description languages: Preliminary results. In 2009 Latin American web congress, 36–43 (IEEE, 2009).
Perer, A. & Wang, F. Frequence: Interactive mining and visualization of temporal frequent event sequences. In Proceedings of the 19th international conference on Intelligent User Interfaces, 153–162 (2014).
Carrera-Rivera, A. Structured dataset of human-machine interactions: Enabling Adaptive User Interfaces, Figshare, https://doi.org/10.6084/m9.figshare.c.6612805.v1 (2022).
Hassenzahl, M. The hedonic/pragmatic model of user experience. Towards a UX manifesto 10, 2007 (2007).
Elouataoui, W., El Alaoui, I., El Mendili, S. & Gahi, Y. An advanced big data quality framework based on weighted metrics. Big Data and Cognitive Computing 6, 153 (2022).
Jariwala, A., Chaudhari, A., Bhatt, C. & Le, D.-N. Data quality for ai tool: exploratory data analysis on ibm api. Int. J. Intell. Syst. Appli 14, 42–56 (2022).
Nasiri, M., Minaei, B. & Sharifi, Z. Adjusting data sparsity problem using linear algebra and machine learning algorithm. Applied Soft Computing 61, 1153–1159 (2017).
Comaniciu, D. & Meer, P. Mean shift: A robust approach toward feature space analysis. IEEE Transactions on pattern analysis and machine intelligence 24, 603–619 (2002).
Oestreich, H., Heinz-Jakobs, M., Sehr, P. & Wrede, S. Human-centered adaptive assistance systems for the shop floor. In Human-Technology Interaction: Shaping the Future of Industrial User Interfaces, 83–125 (Springer, 2022).
Carrera-Rivera, A., Reguera-Bakhache, D., Larrinaga, F. & Lasa, G. Exploring the transformation of user interactions to adaptive human-machine interfaces. In Proceedings of the XXIII International Conference on Human Computer Interaction (Interaccion 2023), September 04-06, 2023, Lleida, Spain, https://doi.org/10.1145/3612783.3612807 (2023).
Acknowledgements
This project has received funding from the Department of Education, Universities, and Research of the Basque Government under the project Ikerketa Taldeak and the European Union’s Horizon 2020 research and innovation programme under the Marie Sklodowska-Curie Grant No. 814078. Daniel Reguera-Bakhache and Iñaki Garitano are part of the Intelligent Systems for Industrial Systems research group (IT1676-22). Angela Carrera-Rivera and Felix Larrinaga are part of the Software engineering research group (IT1519- 22).
Author information
Authors and Affiliations
Contributions
A.C., D.R. and I.G. conceived the experiment(s), A.C. and D.R. conducted the experiment(s), G.L., F.L. and I.G. reviewed the manuscript and results.
Corresponding author
Ethics declarations
Competing interests
The authors declare no competing interests.
Additional information
Publisher’s note Springer Nature remains neutral with regard to jurisdictional claims in published maps and institutional affiliations.
Rights and permissions
Open Access This article is licensed under a Creative Commons Attribution 4.0 International License, which permits use, sharing, adaptation, distribution and reproduction in any medium or format, as long as you give appropriate credit to the original author(s) and the source, provide a link to the Creative Commons licence, and indicate if changes were made. The images or other third party material in this article are included in the article’s Creative Commons licence, unless indicated otherwise in a credit line to the material. If material is not included in the article’s Creative Commons licence and your intended use is not permitted by statutory regulation or exceeds the permitted use, you will need to obtain permission directly from the copyright holder. To view a copy of this licence, visit http://creativecommons.org/licenses/by/4.0/.
About this article

Cite this article
Carrera-Rivera, A., Reguera-Bakhache, D., Larrinaga, F. et al. Structured dataset of human-machine interactions enabling adaptive user interfaces. Sci Data 10, 831 (2023). https://doi.org/10.1038/s41597-023-02741-8
Received:
Accepted:
Published:
DOI: https://doi.org/10.1038/s41597-023-02741-8
