
Abstract
Detecting and tracking multiple moving objects in a video is a challenging task. For living cells, the task becomes even more arduous as cells change their morphology over time, can partially overlap, and mitosis leads to new cells. Differently from fluorescence microscopy, label-free techniques can be easily applied to almost all cell lines, reducing sample preparation complexity and phototoxicity. In this study, we present ALFI, a dataset of images and annotations for label-free microscopy, made publicly available to the scientific community, that notably extends the current panorama of expertly labeled data for detection and tracking of cultured living nontransformed and cancer human cells. It consists of 29 time-lapse image sequences from HeLa, U2OS, and hTERT RPE-1 cells under different experimental conditions, acquired by differential interference contrast microscopy, for a total of 237.9 hours. It contains various annotations (pixel-wise segmentation masks, object-wise bounding boxes, tracking information). The dataset is useful for testing and comparing methods for identifying interphase and mitotic events and reconstructing their lineage, and for discriminating different cellular phenotypes.
Background & Summary
Advances in computer in vision, imaging technologies, and computational tools have led to significant results in video event detection and recognition. Many algorithms have been developed to tackle events arising in different video domains, such as abnormality detection for surveillance1, human action detection2, and cell population monitoring3 in several biological and biomedical studies. In cell biology studies, time-lapse microscopy advanced methodologies are used to observe the dynamic behavior of single cells over time4. The analysis of image sequences enables the quantification of relevant parameters, such as the number of cells and their geometric features (e.g., perimeter, area, nuclear position and shape roundness), as well as the assessment of their movement and fate, gaining unique spatio-temporal information on dynamic biological processes5. The drug discovery and cancer research fields have largely benefited from these innovative approaches6,7. Among anti-cancer compounds, an important class is represented by anti-mitotic drugs, which arrest cell division (mitosis) and induce cell death8. Indeed, monitoring by time-lapse microscopy the single-cell response to anti-mitotic drugs in terms of cell division and cell death has allowed revealing the heterogeneity of induced events within a cell population, thus providing key information for the characterization of novel compounds of therapeutic interest9. In addition, abnormal mitotic progression detected by time-lapse microscopy may help identify mitotic regulators and/or pathways impinging on mitosis, which can widen our understanding of the genetic regulation of cell proliferation and death and can represent novel targets for anti-cancer drugs. The application of such analyses to extended datasets, such as those obtained in high-throughput experiments, requires automated approaches based on machine learning/artificial intelligence with the aim of defining complex phenotypic profiles10,11. Available automated systems for detecting cellular events such as cell division and cell death mostly rely on the use of fluorescently labeled cells12,13 limiting the flexibility of applications due to phototoxicity effects, cell lines availability, and fluorescent probe stability. One way to minimize these issues is to work with label-free imaging techniques14, such as phase-contrast and differential interference contrast (DIC), enabling long-term monitoring of live and intact cells by time-lapse experiments. In particular, the DIC technique produces a pseudo-3D effect and shadow-cast images, and is well suited for the reliable identification of cell division and cell death events, and specific mitotic phenotypes. Thus, automated systems for analyzing these cellular events under label-free microscopy and datasets of cell annotations to compare results and improve the overall procedures are of great interest.
A recent survey paper14 provides an updated summary of available annotated data for various tasks involving label-free microscopy images, including the Cell Tracking Challenge15, EVICAN16, LIVECell17, and the Phase Contrast Time-lapse Microscopy Datasets18. In this increasing amount of valuable annotated data, we noticed that DIC-acquired images, nontransformed cell lines and experimental conditions to increase the numerosity of useful examples for cell proliferation/cell death analyses, are still poorly represented. Here, we present ALFI (Annotations for Label-Free Images), a dataset of sequences and annotations for DIC microscopy imaging, made publicly available to the scientific community through figshare19. In this dataset, we collected image sequences from live samples from both nontransformed and cancer human cell lines. Experimental conditions include asynchronously growing cells, cell cycle synchronization methods, and treatments with anti-mitotic drugs. Furthermore, we focused on segmentation, tracking, and lineage of dividing cells and classification of cell division/cell death-related phenotypes. Given the relevance of detecting cellular effects of newly identified anti-mitotic compounds in pre-clinical cancer studies, increasing the amount of expertly labeled datasets may significantly contribute to the successful development of dedicated cell segmentation, detection, classification, and tracking algorithms by supervised learning.
The ALFI image dataset consists of 29 original videos and sequences (2366 DIC images) for a total of 14272 minutes from time-lapse experiments, deriving from the recording of different human nontransformed and cancer cell lines untreated or exposed to known anti-mitotic drugs. Various types of annotations are provided: (i) pixel-wise segmentation masks (796 frames, 16564 cells) for cell segmentation and for discriminating interphase and mitotic cells; (ii) object-wise bounding box annotations for the classification of interphase and mitotic cells (796 frames, 16564 cells) and for the classification of non-interphase cells into four different phenotypes (1926 frames, 7518 cells); and (iii) annotations for tracking interphase and mitotic cells (331 tracks, 16564 cells) and non-interphase cells of the four phenotypes (357 tracks, 7518 cells). Given these numbers, the ALFI dataset notably extends the panorama of existing annotated datasets14,18 for DIC time-lapse microscopy, besides providing unprecedented annotated data for classifying cells displaying division-related phenotypes.
Methods
ALFI image dataset
The ALFI image dataset is made available as an open-source dataset, which contains 29 original time-lapse microscopy videos and image sequences, named MI01-MI08, CD01-CD09, and TP01-TP12, of the following human cell lines: retinal pigment epithelial nontransformed immortalized hTERT RPE-1, uterine cervical adenocarcinoma HeLa, osteosarcoma U2OS (ATCC: HTB-96) cells and U2OS cells stably expressing histone H2B-GFP and RFP-alpha-tubulin (indicated as “U2OS fluo” in Tables 1–3). Cells were grown at 37 °C and 5% CO2 in complete DMEM (HeLa, U2OS) or DMEM/F12 (hTERT RPE-1) medium, supplemented with 10% fetal bovine serum. Cells were passaged every two-three days and kept in culture for no more than four weeks. To enrich in mitotic figures, cell cycle synchronization protocols were used. Briefly, HeLa and U2OS cells were synchronized by a 24-hour block in 2 mM thymidine. Cultures were then released from the G1/S arrest by washout of thymidine and replacement with fresh medium containing 30 μM deoxycytidine; 6 hours post-release cultures were video recorded immediately after treating them with solvent only (dimethyl sulfoxide, DMSO) or Aurora kinase inhibitor (Alisertib - MLN8237, Selleck Chemicals) at different concentrations, as specified in Figs. 1, 2, to induce mitotic abnormalities and cell death. Asynchronously growing hTERT RPE-1 were either untreated or treated with DMSO or 500 nM Taxol (Sigma Aldrich) (see Figs. 1, 2). Cells seeded in 2-4-8 wells micro-slides (Ibidi, 80286, 80426, 80826) were recorded every 5 minutes (CD01-CD09 and TP01-TP10) or every 7 minutes (MI01-MI08, TP11, and TP12), under an inverted microscope (Eclipse Ti, Nikon) equipped with a DS-Qi1Mc camera (Nikon) and stage incubator (basic WJ, Okolab) to keep constant environmental conditions during the whole registration. 40× (S Plan Fluor, N.A. 0.60, DIC) or 60× Oil (Plan Apo, N.A.1.4, DIC) Nikon objectives were used, as specified in Table 1. The videos have been generated over the years in our laboratories, with experimental conditions set up for investigating mitotic regulators and anti-mitotic compounds, and have proven highly informative in past studies6,20,21. Example frames are shown in Figs. 1, 2 and details are reported in Tables 2, 3.

The ALFI dataset: the first frame of sequences MI01-MI08 used in both Task 1 and Task 2 is shown. U2OS (MI01-MI05) or HeLa (MI06) cultures were treated with 0.1% DMSO or MLN8237 at different concentrations, as specified in the captions. MI07 and MI08 represent hTERT RPE-1 cells in untreated conditions. All the frames were equalized for better visualization. The scale bar for MI01-MI05 is shown in MI05 and that for MI06-MI08 is shown in MI08. Both scale bars represent 25 μm.

The ALFI dataset: the first frame of sequences used for Task 2 is shown. U2OS (CD01-CD09 and TP01-TP10) or HeLa (TP12) cultures were treated with DMSO 0.1% or MLN8237 at different concentrations, as specified in the captions. TP11 represents hTERT RPE-1 cells treated with 500 nM Taxol. All the frames were equalized for better visualization. Scale bar: 25 μm.
MI01-MI05 sequences also contain the fluorescence images of histone H2B-GFP and RFP-alpha-tubulin, as exemplified in Fig. 3. However, being interested in label-free non-phototoxic imaging, we considered only the DIC channel for extracting the image sequences; nonetheless, the interested user can extract the fluorescence images by the video files made available in the dataset.

Example of fluorescence images from the MI01 sequence. (a) H2B-GFP, (b) RFP-alpha-tubulin, (c) DIC, and (d) merged fluorescence signals. For better visualization, contrast enhancement has been applied to (a–c). Scale bar: 25 μm.
The videos, stored in ND2 format, have 12-bit depth and 1280 × 1024 pixel resolution. For each video, the DIC channel was automatically equalized and its frames extracted into TIFF images using the NIS-Elements Viewer software. The frames were transformed into PNG images using the Fiji22 distribution of ImageJ23. Despite the equalization step, a few frames within the sequences may display brightness variations, due to environmental undesired sporadic changes that may occur during experiments. We performed annotations on these frames too, which may help to train algorithms to manage potential illumination variations.
ALFI annotations
Annotations for the ALFI dataset have been produced for two different tasks: 1) discriminating and tracking interphases, mitoses, and their progeny, and 2) discriminating non-interphase cells into four phenotype classes.
Task 1: Discriminating interphases and mitotic cells, and their progeny
Under DIC time-lapse microscopy, interphase cells display a rounded nucleus and outstretched cytoplasm, while mitotic cells are recognized by cell rounding and chromosome condensation. If mitosis is successful, two daughter cells will emerge, and they will have the appearance of interphase cells. In this task, we discriminate between mitotic cells (that include both early and late mitosis) and interphase cells. A concise description and visualization of the cell categories analyzed in this task is given in the upper part of Fig. 4.

Description of the classes for Task 1 (discriminating interphase and mitotic cells, and their progeny) and Task 2 (discriminating non-interphase cells into four phenotype classes). The blue and red dotted lines in the example images for Task 1 represent the nuclei (for interphase cells) and the whole cell area (for mitoses) used for segmentation, respectively. One scale bar applies to Early mitosis and Late mitosis. One scale bar applies to Multipolar and Cell Death. Scale bars: 25 μm.
Three types of annotations have been produced for sequences MI01-MI08: pixel-wise segmentation masks, object-wise bounding boxes, and object-wise tracking and lineage information. Examples of these annotations superimposed over the corresponding images are given in Fig. 5 for two frames of the MI01 sequence.

Examples of ALFI dataset annotations for Task 1. Sequence MI01, frames no. 4 (first row) and 5 (second row): (a) original images; (b) segmentation masks (black = background; grey = interphase cells; white = mitotic cells); (c) bounding boxes and tracking IDs for each interphase (blue) or mitotic (red) cell. Scale bar: 25 μm.
The segmentation masks render pixel-wise labeling of interphases (nuclei) and mitoses (whole cells) for each image. Examples are given in Fig. 5b, where mitotic cells are shown in white and interphase nuclei in grey, and in Fig. 4 with blue (nuclei) and red (whole cell) dotted lines. For each frame, the segmentation masks of interphase nuclei and mitoses have been obtained by producing an initial segmentation, using Matlab or ilastik24 tools, and then manually refined. The resulting masks have been carefully checked by four expert biologists (see Technical Validation).
The bounding boxes (position and size of the smallest box containing an interphase nucleus or a whole mitotic cell) have been extracted from the segmentation masks using Matlab. Examples are given in Fig. 5c, where interphase cells are delimited with blue bounding boxes and mitotic cells with red bounding boxes.
Tracking has been obtained by associating the bounding boxes of the same object in adjacent frames based on motion, estimated by a Kalman filter, using Matlab. This association is stored using an ID assigned to each cell consistently throughout the entire sequence (see Fig. 5c).
A few criteria have been adopted for Task 1 annotations:
-
Cells close to the image boundary that are only partially visible at the beginning of the sequence (e.g., the partially visible cell in the top right corner of the images of Fig. 5) have not been annotated. This is the criterion generally adopted by biologists when examining microscopy videos.
-
Daughter cells resulting from the division of a mitotic cell (e.g., cells 7.1 and 7.2 in the bottom image row of Fig. 5c), whose morphology is very similar to that of early mitotic cells, are separately segmented and classified as mitotic for a few frames after becoming doublet, until their morphology changes to that of interphase cells. The criterion adopted for daughter cells goes toward higher generalizability of the provided annotations, which can be readily used for evaluating cell segmentation and classification in both single images (where time information is not taken into account) and time-lapse sequences. Nonetheless, the correct biological identification of daughter cells is stored via the lineage information (the “Parent” column of the annotation file, as described in the Data Records section), where daughter cells are associated with their parent cell only as soon as they become interphases, as exemplified in Fig. 6. Further lineage analysis along the following generation is feasible in our dataset using the sequence MI06 which covers 23 hours of video recording from pre-synchronized cultures.
Fig. 6 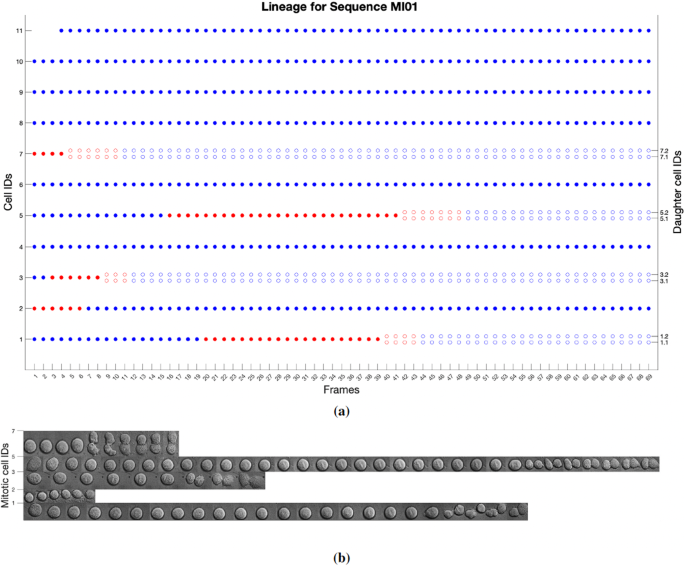
Representation of the lineage information for sequence MI01 obtained using the UseExample 2.m distributed with the dataset (see Usage Notes): (a) for each parent cell (cell IDs on the left y-axis), a full dot (blue for interphase cells, red for mitotic cells) represents its appearance in a sequence image (frame numbers on the x-axis); an empty dot represents one of its daughters (colored according to its interphase or mitotic class); e.g., the cell identified with ID 1 is interphase from frame 1 to frame 19, then it enters mitosis at frame 20 and produces two daughters that appear as cell doublets (late mitosis) from frame 40. The mitosis ends at frame 44 when the two daughter cells become interphases; (b) image crops of mitotic cells (IDs on the y-axis) in the sequence; each crop corresponds to a full red dot or a couple of empty red dots of a lineage tree in (a).

Table 2 reports detailed information on the annotations for Task 1, including cell line, sequence duration, number of frames, number of annotated frames, number of annotated cells in each of the considered mitotic and interphase classes, total number of annotated cells in all the sequence frames, and total number of tracked cells, also considering the lineage traced ones, for each sequence.
Task 2: Discriminating non-interphase cells into four phenotype classes
For this task, only non-interphase cells have been taken into account and classified as belonging to four different classes based on the cell morphology observed under DIC live imaging: Early Mitoses, including prometa- and metaphases, identified as cells which rounded-up with condensed chromosomes; Late Mitoses, including ana- and telophases identified as elongated oval cells with two chromosome sets and as rounded doublets; Multipolar division, identified as a cell that divides in more than a doublet; and Cell Death, identified by membrane blebbing and cell shrinkage. A concise description coupled with single-cell image examples of the four classes analyzed in this task is given in the lower part of Fig. 4.
The annotations for this task consist of bounding boxes and tracking information for sequences MI01-MI08 (containing only Early and Late Mitoses), CD01-CD09 (containing also several Cell Death events), and TP01-TP12 (containing also several Multipolar divisions, mainly tripolar). Examples of annotations superimposed over the corresponding images are given in Fig. 7 for the CD02 and TP01 sequences. The bounding box annotations have been produced using the makesense.ai online tool25, while tracking has been obtained using the same procedure adopted for Task 1.

Example of ALFI dataset annotations for Task 2. Sequences CD02 (frames no. 49, 50 (a,b)) and TP01 (frames no. 26, 27 (c,d)) and their annotations (second row). Bounding boxes and tracking IDs are used to identify and track cells classified as Early Mitosis (red), Late Mitosis (magenta), Multipolar (green), or Cell Death (blue). Scale bar: 25 μm.
For Task 2 too, a few criteria have been adopted for the annotations:
-
Interphase cells have not been annotated. Indeed, attention is given only to the four described phenotype classes for this task.
-
The four considered phenotype events generally last for a few consecutive frames and may not necessarily be correctly classified by looking only at single frames. However, in light of higher generalizability, annotations are provided for every single frame for the entire duration of the event.
-
As for Task 1, cells close to the image boundary that are only partially visible at the beginning of the sequence (e.g., the partially visible mitosis close to the bottom image boundary of Fig. 7a,b) have not been annotated.
-
Contrary to the annotations for Task 1, Late Mitoses (e.g., the cell with ID 5 in Fig. 7b, magenta box) are annotated with a single bounding box, and no lineage information is provided. Therefore, for sequences MI01-MI08 the two types of annotations (for Tasks 1 and 2) are slightly different.
Table 3 reports detailed information on the annotations for Task 2, including cell line, sequence duration, number of frames, number of annotated frames, number of annotated cells for each of the four considered phenotype events, total number of annotated cells in all the sequence frames, and total number of tracked cells for each sequence.
Data Records
The ALFI dataset includes videos, images, and annotations for 29 label-free microscopy sequences named MI01-MI08, CD01-CD09, and TP01-TP12, obtained as described in the Methods section. The dataset is made publicly available to the scientific community through figshare19. The main dataset directory includes the ALFI_dataset_Readme.txt file, containing detailed metadata describing the dataset structure and content, and three directories:
-
Data&Annotations, containing images and annotations for all the 29 sequences, as described below;
-
Videos, containing all the 29 videos (named CD01.nd2,…, TP12.nd2);
-
UseExamples, containing usage examples, as described in the Usage Notes.
The content for the generic sequence SeqName in the Data&Annotations directory can be described via the directory trees shown in Fig. 8:
-
All the images are included in the Images directory; they are numbered starting from 1 and are given as PNG files, 16-bit depth, and 1280 × 1024 pixel resolution.
-
The segmentation masks for Task 1, available only for sequences MI01-MI08, are included in the Masks directory; they are numbered according to the sequence image they refer to and are given as PNG files, 8-bit depth, and 1280 × 1024 pixel resolution. Background, interphase cells, and mitotic cells are labeled using values of 0, 128, and 255, respectively. The related bounding box, tracking, and lineage annotations are included in the SeqName_DTLTruth.csv file. Here, for each annotated cell, information is provided on: number of sequence image, cell ID, cell class (either Interphase or Mitosis), bounding box, specified by its upper left corner and its dimensions, and parent cell ID, as summarized in Table 4a. These annotations allow the evaluation of cell segmentation (via the segmentation masks), classification (using the cell class), tracking (using the cell ID), and lineage (using the cell parent ID).
Table 4 Annotation tags for Task 1 and Task 2. (a) Task 1 (SeqName_DTLTruth.csv). Example: the line [10, 5.1, Interphase, 3, 3, 10, 15, 5] in the SeqName_DTLTruth.csv file indicates at frame 10 the interphase cell 5.1, with bounding box having top-left corner in (3,3) and size 10 × 15 pixels, whose parent is cell 5. (b) Task 2 (SeqName_PhenoTruth.csv). Example: the line [20, 11, LateMitosis, 1, 9, 10, 18] in the SeqName_PhenoTruth.csv file indicates at frame 20 the late mitosis cell 11, with bounding box having top-left corner in (1,9) and size 10 × 18 pixels. -
Annotations for Task 2 for all the sequences are included in the SeqName_PhenoTruth.csv file. Here, for each annotated cell, information is provided on: number of sequence image, cell ID, cell class (including EarlyMitosis, LateMitosis, Multipolar, and CellDeath), and bounding box, specified by its upper left corner and its dimensions, as summarized in Table 4b. The parent cell ID is not specified, since, for these sequences, interphase cells are not tracked. These annotations allow the evaluation of cell detection (using the bounding boxes), phenotype classification (using the cell class), and tracking (using the cell ID) only for non-interphase cells.

Directory trees for the generic sequence SeqName included in the Data&Annotations directory, diversified for (a) sequences MI01-MI08, including annotations for both Task 1 (Masks and SeqName_DTLTruth.csv) and Task 2 (SeqName_PhenoTruth.csv); (b) sequences CD01-CD09 and TP01-TP12, including only annotations for Task 2 (SeqName_PhenoTruth.csv).
Technical Validation
The overall quality of ALFI videos was analyzed through the histograms of pixel intensity values reported in Fig. 9, carried out using the image processing package Fiji22. The collected intensity values distributions have a minimum value between 348 and 1285, while the maximum value ranges between 1244 and 4095. Overall mean values range between 633 and 2107. The different standard deviation values point out the different scattering to the pixel values around the minimum values of each sequence.

ALFI original videos validation. The histograms show the distribution of grey-scale pixel values of original sequences. Since a single frame has a 12-bit depth, the number of bins was set to 4096, and bin width was automatically assigned to 1 for all videos. The graphs also display the total number of pixels, minimum, maximum, mean, mode, and standard deviation values for each pixel distribution.
A board of four biologists with more than ten years of experience reviewed the quality of all the images and annotations of the ALFI dataset. For sequences where fluorescence was present, we also carefully checked that our manual segmentation of interphase nuclei precisely overlapped with the GFP signal of H2B-GFP.
Usage Notes
To assist other researchers with the reuse of our data, in the UseExamples directory, we provide two use examples:
-
1.
UseExample1.m is a Matlab script for plotting the bounding box annotations over the original sequence images, as shown in Fig. 7. This use example is available also in Python (UseExample 1.py), with the related Readme file (UseExample 1.py.readme.txt). The output for sequence TP06 is included in the UseExample1Out directory.
-
2.
UseExample2.m is a Matlab script for plotting a representation of cell lineage for sequences MI01-MI08, together with image crops of the involved cells, as shown in Fig. 6. It is optionally possible (via the OnlyMitoses input parameter) to plot the lineage representation only for mitotic cells; this can be useful for highly populated sequences, such as MI07 and MI08, where the plot of Fig. 6a would appear too dense. It should be observed that the provided lineage representation is suitable only for the first generation of daughter cells, as otherwise the plot (e.g., the one in Fig. 6a) would become too complex for multiple generations. The output images for all sequences MI01-MI08 are provided in the UseExample2Out directory.
Code availability
The NIS-Elements Viewer software (v. 4.11.0, www.microscope.healthcare.nikon.com) was used to automatically equalize the videos (AutoScale LUTs tool) and extract individual frames (see ALFI dataset), that were converted to the PNG format using the Fiji22 (https://fiji.sc) distribution of ImageJ23 (https://imagej.nih.gov/ij).
The ilastik tool (v. 1.3.3, www.ilastik.org) was used to produce initial semantic segmentations of interphase nuclei and mitotic cells for sequences MI01-MI08 (see ALFI annotations for Task 1) using the Pixel Classification workflow. The workflow performed the following steps: (1) load the selected input image sequence; (2) define three user-driven classes: mitosis, interphase, background; (3) define pixel filters, based on color, intensity, and texture, as image features at different scales; (4) learn examples for each class interactively by user-defined brushstrokes with classes colors on one or more selected input images; (5) classify image pixels for the whole sequence using output filters, and a Random Forest classifier26; (6) correct pixel classification interactively repeating steps 4-5); (7) save the output.
Matlab (v. R2020a, www.mathworks.com) was used to (1) refine the initial masks (see ALFI annotations for Task 1) using the Video Labeler App; (2) extract the bounding boxes from the masks (see ALFI annotations for Task 1) using the regionprops function; (3) associate the bounding boxes of the same object in adjacent frames based on motion, estimated by a Kalman filter (see ALFI annotations for Task 1 and Task 2); and (4) produce the use examples (see Usage Notes).
The bounding box annotations have been produced using the makesense.ai online tool25 (https://github.com/SkalskiP/make-sense).
References
Maddalena, L. & Petrosino, A. A self-organizing approach to background subtraction for visual surveillance applications. IEEE Trans. Image Processing 17, 1168–1177, https://doi.org/10.1109/TIP.2008.924285 (2008).
Nguyen, D. T., Li, W. & Ogunbona, P. O. Human detection from images and videos: A survey. Pattern Recognition 51, 148–175, https://doi.org/10.1016/j.patcog.2015.08.027 (2016).
Huh, S., Ker, D. F. E., Bise, R., Chen, M. & Kanade, T. Automated mitosis detection of stem cell populations in phase-contrast microscopy images. IEEE Trans. Med. Imaging 30, 586–596, https://doi.org/10.1109/TMI.2010.2089384 (2011).
Coutu, D. L. & Schroeder, T. Probing cellular processes by long-term live imaging–historic problems and current solutions. Journal of Cell Science 126, 3805–3815, https://doi.org/10.1242/jcs.118349 (2013).
Chessel, A. & Carazo Salas, R. From observing to predicting single-cell structure and function with high-throughput/high-content microscopy. Essays in Biochemistry 63, 197–208, https://doi.org/10.1042/EBC20180044 (2019).
Asteriti, I. A. et al. The Aurora-A inhibitor MLN8237 affects multiple mitotic processes and induces dose-dependent mitotic abnormalities and aneuploidy. Oncotarget 5, 6229–6242, https://doi.org/10.18632/oncotarget.2190 (2014).
Sebestyén, E. et al. Sammy-seq reveals early alteration of heterochromatin and deregulation of bivalent genes in Hutchinson-Gilford progeria syndrome. Nat. Commun. 11, https://doi.org/10.1038/s41467-020-20048-9 (2020).
Penna, L. S., Henriques, J. A. P. & Bonatto, D. Anti-mitotic agents: Are they emerging molecules for cancer treatment. Pharmacol. Ther. 173, 67–82, https://doi.org/10.1016/j.pharmthera.2017.02.007 (2017).
Gascoigne, K. E. & Taylor, S. S. How do anti-mitotic drugs kill cancer cells. Journal of Cell Science 122, 2579–2585, https://doi.org/10.1242/jcs.039719 (2009).
Boutros, M., Heigwer, F. & Laufer, C. Microscopy-based high-content screening. Cell 163, 1314–1325, https://doi.org/10.1016/j.cell.2015.11.007 (2015).
Mattiazzi Usaj, M. et al. High-content screening for quantitative cell biology. Trends Cell Biol. 26, 598–611, https://doi.org/10.1016/j.tcb.2016.03.008 (2016).
Neumann, B. et al. Phenotypic profiling of the human genome by time-lapse microscopy reveals cell division genes. Nature 464, 721–727, https://doi.org/10.1038/nature08869 (2010).
Funk, L. et al. The phenotypic landscape of essential human genes. Cell 185, https://doi.org/10.1016/j.cell.2022.10.017 (2022).
Maddalena, L., Antonelli, L., Albu, A., Hada, A. & Guarracino, M. R. Artificial intelligence for cell segmentation, event detection, and tracking for label-free microscopy imaging. Algorithms 15, https://doi.org/10.3390/a15090313 (2022).
Ulman, V. et al. An objective comparison of cell-tracking algorithms. Nature Methods 14, https://doi.org/10.1038/nmeth.4473 (2017).
Schwendy, M., Unger, R. E. & Parekh, S. H. EVICAN—a balanced dataset for algorithm development in cell and nucleus segmentation. Bioinformatics 36, 3863–3870, https://doi.org/10.1093/bioinformatics/btaa225 (2020).
Edlund, C. et al. LIVECell—A large-scale dataset for label-free live cell segmentation. Nature Methods 18, 1038–1045, https://doi.org/10.1038/s41592-021-01249-6 Previously included in thesis in manuscript form (2021).
Ker, D. et al. Phase contrast time-lapse microscopy datasets with automated and manual cell tracking annotations. Sci. Data 13, https://doi.org/10.1038/sdata.2018.237 (2018).
Antonelli, L. et al. ALFI: Cell cycle phenotype annotations of label-free time-lapse imaging data from cultured human cellsree time-lapse imaging data from cultured human cells, figshare, https://doi.org/10.6084/m9.figshare.c.6436958.v1 (2023).
Gallini, S. et al. NuMA Phosphorylation by Aurora-A orchestrates spindle orientation. Curr. Biol. 26, 458–469, https://doi.org/10.1016/j.cub.2015.12.051 (2016).
Naso, F. D. et al. Excess tpx2 interferes with microtubule disassembly and nuclei reformation at mitotic exit. Cells 9, 374, https://doi.org/10.3390/cells9020374 (2020).
Schindelin, J. et al. Fiji: an open-source platform for biological-image analysis. Nat Meth 9, 676–682, https://doi.org/10.1038/nmeth.2019 (2012).
Schneider, C. A., Rasband, W. S. & Eliceiri, K. W. NIH image to ImageJ: 25 years of image analysis. Nat Meth 9, 671–675, https://doi.org/10.1038/nmeth.2089 (2012).
Berg, S. et al. ilastik: interactive machine learning for (bio)image analysis. Nature Methods https://doi.org/10.1038/s41592-019-0582-9 (2019).
Skalski, P. Make Sense. https://github.com/SkalskiP/make-sense (2019).
Breiman, L. Random forests. Machine Learning 45, https://doi.org/10.1023/A:1010933404324 (2001).
Acknowledgements
We thank L. Lanzetti, Institute for Cancer Research at Candiolo, Italy, for the kind gift of U2OS H2B-GFP and RFP-alpha-tubulin cells. This work has been partially supported by the European Union PON “Ricerca e Innovazione 2014-2020” FESR (Grant no. ARS01_00734, project QUANCOM), POR-Lazio FESR 2014-2020 (project H35F21000430002 to M.R.G. and project A0375-2020-36597 to F.D. and G.G.), AIRC (IG-2021 ID:25648 to G.G.), and Consiglio Nazionale delle Ricerche - CNR (project DBA.AD005.225-NUTRAGE-FOE2021). It was carried out also within the activities of the authors as members of the INdAM Research group GNCS and the ICAR-CNR INdAM Research Unit. The work of M.R.G. was conducted within the framework of the Basic Research Program at the National Research University Higher School of Economics (HSE). The microscopy experiments were performed at the IBPM Nikon Reference Centre. The implementation of the microscopy infrastructure was supported by MUR (Ministry of University and Research) funds to the PON project “IMPARA, Imaging from molecules to the preclinics”. L.M. and L.A. would like to thank R. Mattiello and S. Sada for the technical support.
Author information
Authors and Affiliations
Contributions
G.G., F.D. and I.A.A. conceived the biological experiments, F.P. and I.A.A. conducted the experiments and produced the videos, L.A., F.P., A.A., A.H. and L.M. provided the annotations, G.G., F.D., I.A.A. and F.P. reviewed all the images and annotations. M.R.G. designed and supervised the dataset. All authors wrote the manuscript.
Corresponding authors
Ethics declarations
Competing interests
The authors declare no competing interests.
Additional information
Publisher’s note Springer Nature remains neutral with regard to jurisdictional claims in published maps and institutional affiliations.
Rights and permissions
Open Access This article is licensed under a Creative Commons Attribution 4.0 International License, which permits use, sharing, adaptation, distribution and reproduction in any medium or format, as long as you give appropriate credit to the original author(s) and the source, provide a link to the Creative Commons licence, and indicate if changes were made. The images or other third party material in this article are included in the article’s Creative Commons licence, unless indicated otherwise in a credit line to the material. If material is not included in the article’s Creative Commons licence and your intended use is not permitted by statutory regulation or exceeds the permitted use, you will need to obtain permission directly from the copyright holder. To view a copy of this licence, visit http://creativecommons.org/licenses/by/4.0/.
About this article

Cite this article
Antonelli, L., Polverino, F., Albu, A. et al. ALFI: Cell cycle phenotype annotations of label-free time-lapse imaging data from cultured human cells. Sci Data 10, 677 (2023). https://doi.org/10.1038/s41597-023-02540-1
Received:
Accepted:
Published:
DOI: https://doi.org/10.1038/s41597-023-02540-1
