
Abstract
This article presents a resource for automated search, extraction and collation of geochemical and geochronological data from the Figshare repository using web scraping code. To answer fundamental questions about the Earth’s evolution, such as spatial and temporal evolution and interrelationships between the planet’s solid and surficial reservoirs, researchers must utilize global geochemical datasets. Due to the volume of data being published, these datasets become quickly outdated. We present a resource that allows researchers to rapidly curate and update their own databases from existing published data. We use open-source Python code to web scrape the Figshare repository for journal supplementary files using the application programming interface, allowing for the collection and download of hundreds of supplementary files and metadata in minutes. Use of this web scraping tool is demonstrated here by collation of a zircon geochronology and chemistry database of >150,000 analyses. The database is consistent in reproducing trends in other published zircon compilations. Providing a resource for automated collection of Figshare data files will encourage data sharing and reuse.
Measurement(s) | age and chemistry of zircon |
Technology Type(s) | mass spectrometry |
Background & Summary
Geoscience research increasingly relies on geochemical, geochronologic, or isotopic data to investigate Earth processes in deep time. Increasingly, articles are utilizing big-data to establish statistically sound secular trends and unravel large-scale, multi-system changes in the Earth1,2,3,4,5,6,7,8,9,10,11. This has coincided with instrumentation developments (primarily in the field of Laser Ablation Inductively Coupled Mass Spectrometry (LA-ICP-MS)) which allow for rapid production of large datasets (several hundred unknown analyses per day), translating to a rapid rise in the rate of data generation and publication (Fig. 1).

(a) Zircon database compiled by Puetz, et al.4 in 2017, containing >400,000 analyses. (b) Zircon Hf database compiled by Roberts and Spencer5. (c) Web of Science data on publications containing the phrase “Zircon LA-ICP-MS” between 1995 and 2020. From 2015-2020 (i.e. since the Roberts and Spencer database was published), more than 2300 zircon LA-ICP-MS articles have been published.
The uptick in data production and use of published datasets in geology research has been accompanied by the publication of global zircon geochronology and geochemical databases. Many zircon (or other mineral phase) geochronologic, isotopic or geochemical databases occur as single published entities, which, given the rate of data production are quickly outdated. For example, since the Puetz12 zircon U-Pb database was compiled in 2017, over 1600 articles containing “zircon LA-ICP-MS” have been published (Fig. 1). While there are a growing number of permanent repositories available (for example, AusGeochem, EarthChem, GEOROC, StratDB), the supplementary data to journal articles remains an important source of geochronological and geochemical data used in creating databases and new publications. The rapid increase in data production has not been matched by publication of studies to automate the data collection process, despite the push for an increase in robustness of statistical data treatment and exploration into the use of machine learning to solve geoscience problems4,13,14.
Academic journal publishers are implementing supplementary data file hosting on large repositories. For example, Mendeley Data hosts supplementary material for Elsevier Journals, while Figshare15,16,17 hosts data from Earth Science publications in journals from Springer Nature, The Geological Society of London, The Geological Society of America, and Taylor & Francis. Such repositories are important data resources and allow researchers to use automated techniques to search and collect data such as web scraping.
Web scraping is the method of extracting and saving data from the internet to a file or database for later use, and can be conducted either manually or by using a program or bot18. Web scraping is commonly used for collecting data from social media platforms, price comparison of items and stocks, monitoring website changes, monitoring weather data and to build internet search engine responses19. Some web scraping programs crawl the internet parsing the HyperText Markup Language (HTML) of the website. These methods are often discouraged or banned by specific websites due to the interruptions to normal web services that can occur through data retrieval of this kind. Further, repeated service requests by HTML web crawlers or scrapers mimic the function of some malicious hacking software18, and many websites will block the source IP address of such attempts, rendering web scraping code useless.
Rather than encouraging HTML web scraping, many websites, including data repository sites such as Figshare, provide Application Programming Interfaces (APIs) to enable interaction of programs or bots with a set of services at the back-end of the website, to avoid affecting the front-end functionality. APIs act as a service that provides a high-level interface to directly retrieve data from their repositories or databases at the back-end18,19.
Here, we present open-source code to allow for fast automated collection of geochemical and geochronological data from supplementary files of published journal articles using API web scraping of the Figshare repository. Using this method, we generated a dataset of ~150,000 zircon U-Pb, Lu-Hf, REE, and oxygen isotope analyses. This code gives researchers the ability to quickly compile the relevant supplementary material to build their own geochemical database and regularly update it, whether their data of interest be common or niche. Automation of the data collection process through web scraping may remove bias in data collection that is introduced through manual author searches and allows researchers to efficiently search and collect relevant geochemical and geochronological data for database curation.
Methods
Using the Figshare API web scraping code written in Python programming language, we compiled a dataset of zircon analyses. The zircon dataset presented here is comprised of U-Pb, Lu-Hf, REE and oxygen isotope data from multiple scrapes of the Figshare database using search terms zircon Lu-Hf, zircon hafnium, zircon rare earth elements, zircon trace elements, zircon REE, zircon oxygen and zircon oxygen isotopes. In total, ~600 articles were returned in search responses and ~1000 supplementary files associated with these articles were downloaded. Not all of these supplementary files contained relevant zircon data (some included detailed methodology, additional figures, etc), but zircon data from >500 supplementary files were ultimately incorporated into the database.
The database was created in four steps outlined by the workflow in Fig. 2. First, the program establishes a connection with the Figshare API and carries out a search of the Figshare Public article database based on a keyword, or set of keywords input by the user. The user sets the number of results to retrieve, and the article API URLs that satisfy the search criteria are appended to a list. The program then creates or opens an existing SQL database, and iterating through the list of article URLs, extracts and stores the metadata for each article. The metadata collected includes the unique Figshare article number, title, citation, data DOI, publication DOI, publication title, license, article description, and download URL for each of the supplementary files associated with the article (Fig. 3). All data in the GEOSCRAPE database falls under one of three Creative Commons licenses (CC0, CC-BY-4.0, or CC BY-NC) the most restrictive of which allows for attributed, non-commercial re-use of the data. The compiled dataset is published by the most restrictive license within the dataset.

Workflow of the steps involved in creating the zircon database through web scraping the Figshare public article database.

Relational database schema for the collection of scraped metadata, created in Step 1 of the workflow shown in Fig. 2.
The second part of the Python code (Fig. 2, Step 2) iterates through the SQL database and downloads unretrieved files to the working folder. The user sets the number of files to be retrieved by a single execution of the code (Fig. 2, Step 3). Following downloading the files and before they can be entered into a geochemical database, the data require cleaning. This process includes reformatting and relabelling data, as well as including missing data and metadata so that the data can be interpreted correctly. The data cleaning process is the most time-consuming step of the workflow. This is a practical example of issues caused by bad data reporting and poor data citation practices in geochemistry. Minimum metadata requirements for geochemical data have been defined20 and have started to be adopted and disseminated21, however, have yet to become the prevalent standard of practice. Furthermore, standardized formatting would facilitate the cleaning process, as discussed in the Technical Validation section.
Once the data have been cleaned, they can be pushed into an SQL database designed by the user. We have used the open-source software SQLite to create the database in Python for zircon geochronology and geochemistry. Calculated values (with the exception of U-Pb or Pb-Pb ages), for example, εHf model ages and concordia ages have not been included in the database to limit the metadata required (i.e. decay constants) to interpret the data.
As SQLite is not generally used as a data editing or interrogation tool, using it in combination with Python coding allows for secure storage of data as SQLite. Once the database has been compiled, it can easily be exported to a .csv file from the SQLite graphical user interface, or through Python. The .csv file can then be interrogated, modified and updated in Python or Excel. A modified version of the database .csv (for example with additional columns including calculated data) and be imported to SQLite to create a new database or data table within the same database. Storage of the database in SQLite and editing of an exported .csv means that a master copy of the data is retained in the event that the .csv is corrupted or damaged in any way. Additionally, the SQLite platform allows for relational databases to be built to store data if the database is extremely large or complex. For the sake of simplicity and the likelihood that many researchers are unfamiliar with relational databases and SQL coding, we have created a database that is a single table in SQLite. This is available on Figshare (see Code Availablilty section for details).
Data Records
The GEOSCRAPE22 database contains zircon geochronological, isotopic, and chemical data from >260 published articles. There are >150,000 entries in the database, the majority of those are radiometric age data. The database includes the unique Figshare article ID and DOI of the publication the data was contained within, minimizing the possibility of duplicate data in the large database. The inclusion of other published data compilations within this database was avoided to further reduce data duplication risks.
Figure 4 shows a summary of zircon data compiled within the GEOSCRAPE22 database. Frequency histogram and kernel density estimate (Fig. 4a) show major zircon crystallization peaks broadly coinciding with phases of supercontinent formation (yellow bands in Fig. 4). The peaks are consistent with those produced by the Puetz12 database (Fig. 1a) and other zircon age compilations such as Voice, et al.7 and Cawood, et al.23 despite those datasets being compiled through manual search processes, and our compilation containing slightly fewer than half the number of zircons in the Puetz12 database.

Zircon data compilation figures created from the GEOSCRAPE22 database. (a) Frequency histogram and kernel density estimate of zircon ages (Ma). (b) ɛHf versus zircon age scatter plot. DM: Depleted mantle. Constants used in calculation: Lu decay after Scherer, et al.232; Chondrite Uniform reservoir ratios after Bouvier, et al.233; Depleted mantle ratios Griffin, et al.234. (c) ∑ rare earth element (REE) concentrations versus zircon age. Concentrations are CI chondrite normalized using the values from Anders and Grevesse24 (d) Scatter plot of Ti-in-zircon temperatures versus zircon age, method after Ferry and Watson25. All plots contain both concordant and discordant age data.
Similarly, the zircon ɛHf versus zircon age plot (Fig. 4b) displays a similar distribution of data to that of Roberts and Spencer5, including negative ɛHf excursions at ca. 550 and 200 Ma. In contrast to the Roberts and Spencer5 database, which includes summary age and Hf data only, the GEOSCRAPE database includes all available geochemical, isotopic and sample information for each analysis.
Zircon trace element data were also collated in the database and the ∑ rare earth element (REE) and Ti-in-zircon temperature versus zircon age plots (Fig. 4c,d) represent a summary of those data. The >8000 REE concentrations presented in Fig. 4d are CI chondrite normalized24. The >6000 Ti-in-zircon temperatures plotted were calculated assuming silica saturation and an aTiO2 of 0.7 (method after Ferry and Watson25). All available trace and rare earth element data that resulted from the web scraping search were included in the database (currently >100,000 individual elemental analyses and >8,000 zircon rare earth element suites).
The database is openly available on the public GEOROC repository at https://doi.org/10.25625/FWQ7DT as an Expert Dataset and will be regularly updated by ELM until 2027. Researchers can freely access the data and use the web scraping code and database to create subsets or build further on the database without duplicating data. All analyses within the GEOSCRAPE22 database are linked to a DataCite DOI.
Technical Validation
Development of the web scraping code presented here has highlighted inconsistencies in data formatting and reporting. With the increasing use of programming packages such as Matlab, R and Python for data processing and statistical analysis in Earth science, it is necessary that reporting of such data move to a format that can be easily integrated into such programs. For example, reading an isotopic data table into such a program should result in allocation of an isotopic ratio as a column header, i.e. 207Pb/206Pb. However, many authors use shorthand notation to label their data including (observed during compilation of this database): 207/206, 7/6, Pb207/Pb206, Pb/Pb, or format column headers across multiple rows. This creates difficulties when attempting to use automation to correctly identify data within a table, as tools like regular expressions require some predictability in the formatting of strings for searching.
Most published databases are formatted in a fashion that requires manual data cleaning before the data can be read as a table into a Matlab, R or Python. Formatting issues encountered include: data published in .jpeg26, .pdf or .doc formats, or within the body of the article27, rather than .xls, .tab or .csv; blank space at the top of the table; column headings separated across multiple rows; merged cells, and; variation between vertical and horizontal formatting (e.g., a single row including sample ID, sample description, sampling coordinates, followed by the analyses row by row). These issues substantially increase the time and effort it takes for published data to be re-used and increase the likelihood of introducing errors into the data. Publication of data tables in .pdf or .jpeg formats, or solely within the body of an article discourages the re-use of those data, possibly leading to bias in large datasets due to data exclusion and should be avoided.
Metadata that is essential for the re-use of published geochemical datasets are often not included within the supplementary data tables and requires additional investigation of the associated article to retrieve it. Examples of such data are sampling coordinates, which are substantially under-reported, reported with incomplete information such as UTM data with no zone reported28, regional grid references with no reference to a global coordinate system provided29, or simply inferred through sampling locations plotted on maps30,31 which require georeferencing to accurately extract the coordinates. Other often absent metadata include analytical methods and parameters utilized, analyzed phases, any standard quality assurance/quality control procedures, and the type of uncertainty reported.
Inadequate data attribution is also becoming prevalent during publication of data compilations when citations for the original data are restricted to the supplementary data or appendices. Removal of data citations from the references section of a manuscript may be inadvertently encouraged by journals with strict limits on the number of references that may be cited.
Here we propose a set of guidelines for the formatting of supplementary data tables that will allow for published data to be more readily utilized by the community:
-
Reporting of data following guidelines similar to those of Horstwood, et al.32
-
Sample identification via International Geo Sample Number and sample metadata after Chamberlain, et al.21 and Broman and Woo33
-
Include all metadata required to understand, interpret and use the data tables as a single entity
-
Ensure each column header is unique; i.e. do not use ‘±’ for columns with uncertainty, report the type and level of uncertainty, e.g. 2sd, 1sd, 1SE, 1σ
-
Contribute data in either comma-delimited or tab-delimited formats
-
Column headers must be restricted to one row in the data table
-
Use underscores rather than spaces in column headers
-
Limit the use of special characters
-
Use UTF-8 encoding when saving .csv files to ensure errors are not introduced when reading the file into other programs
-
Include sampling coordinates for each sample in a globally recognized coordinate system such as WGS1984, or UTM with all zone details
-
Where possible, include each variable in a separate column and each analysis in a separate row. Avoid blank spaces
-
Do not use merged cell formatting
-
Report the method for common Pb correction calculation, when applicable (as well as uncorrected data)
-
Report normalization factors and constants used in a separate column or at the bottom of the data table
-
Figure 5 lists possible column headers that may be required for a variety of geochemical datasets following Gard, et al.10 and Lehnert, et al.34
Fig. 5 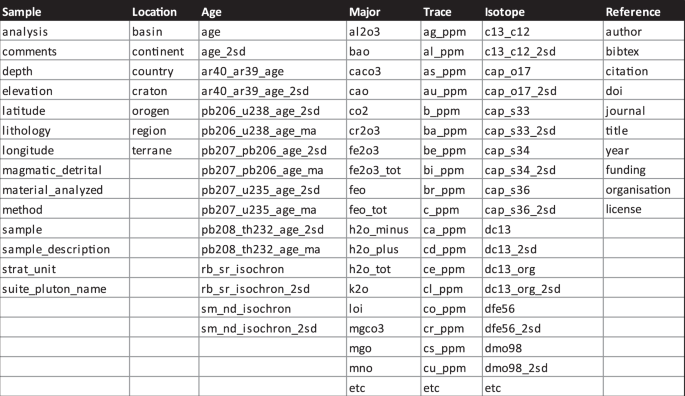
Example of column headers for supplementary data tables. Table S1 shows the extended table of preferred column headers. etc: etcetera.

Duplication of data in large data compilations is a source of concern. To minimize this in the dataset, any data syntheses in data tables (e.g. any analysis that gave a citation to a previous publication) were not included in the dataset. Further, during data cleaning, repeated data tables were discluded from the dataset. These were reasonably simple to identify as they often had consecutive article IDs, or the metadata for the article could be looked up in the data sources table produced during Step 1 of the web scraping code. It is likely that a small amount of human error has resulted in some data duplication in the dataset. However, we estimate it to be less than 1%.
Code availability
The web scraping and data-basing code used in this paper are available from https://github.com/erinlmartin/figshare_geoscrape.git. Instructions for use are available with the code.
All data presented in this study are previously published and available on the Figshare repository. DOIs for the data are included within the GEOSCRAPE22 database hosted with GEOROC at: https://doi.org/10.25625/FWQ7DT. This database will be updated by ELM until 2027. Table S1, SQLite template files35 and metadata table available from Figshare: https://doi.org/10.6084/m9.figshare.16870603.v3.
References
Tang, M. et al. Orogenic quiescence in Earth’s middle age. Science 371, 728–731, https://doi.org/10.1126/science.abf1876 (2021).
Tang, M. et al. Reconstructing crustal thickness evolution from europium anomalies in detrital zircons. Geology 49, 76–80, https://doi.org/10.1130/g47745.1 (2020).
Zhu, Z. et al. S-type granites: Their origin and distribution through time as determined from detrital zircons. Earth and Planetary Science Letters 536, 116140, https://doi.org/10.1016/j.epsl.2020.116140 (2020).
Puetz, S. J. et al. Statistical analyses of Global U-Pb Database 2017. Geoscience Frontiers 9, 121–145, https://doi.org/10.1016/j.gsf.2017.06.001 (2018).
Roberts, N. M. W. et al. The zircon archive of continent formation through time. Geological Society, London, Special Publications 389, 197–225, https://doi.org/10.1144/sp389.14 (2015).
Dhuime, B. et al. A Change in the Geodynamics of Continental Growth 3 Billion Years Ago. Science 335, 1334–1336, https://doi.org/10.1126/science.1216066 (2012).
Voice, P. J. et al. Quantifying the timing and rate of crustal evolution: global compilation of radiometrically dated detrital zircon grains. The Journal of Geology 119, 109–126 (2011).
Belousova, E. A. et al. The growth of the continental crust: Constraints from zircon Hf-isotope data. Lithos 119, 457–466, https://doi.org/10.1016/j.lithos.2010.07.024 (2010).
Spencer, C. J. et al. A Palaeoproterozoic tectono-magmatic lull as a potential trigger for the supercontinent cycle. Nature Geoscience 11, 97–101, https://doi.org/10.1038/s41561-017-0051-y (2018).
Gard, M. et al. Global whole-rock geochemical database compilation. Earth Syst. Sci. Data 11, 1553–1566, https://doi.org/10.5194/essd-11-1553-2019 (2019).
Mulder, J. A. et al. Crustal rejuvenation stabilised Earth’s first cratons. Nature Communications 12, 3535, https://doi.org/10.1038/s41467-021-23805-6 (2021).
Puetz, S. J. A relational database of global U–Pb ages. Geoscience Frontiers 9, 877–891, https://doi.org/10.1016/j.gsf.2017.12.004 (2018).
Vermeesch, P. et al. Making geological sense of ‘Big Data’ in sedimentary provenance analysis. Chemical Geology 409, 20–27, https://doi.org/10.1016/j.chemgeo.2015.05.004 (2015).
Xiong, Y. et al. Mapping mineral prospectivity through big data analytics and a deep learning algorithm. Ore Geology Reviews 102, 811–817, https://doi.org/10.1016/j.oregeorev.2018.10.006 (2018).
Quarati, A. et al. Do researchers use open research data? Exploring the relationships between usage trends and metadata quality across scientific disciplines from the Figshare case. Journal of Information Science 48, 423–448, https://doi.org/10.1177/0165551520961048 (2022).
Reed, R. B. figshare for Institutions. J Med Libr Assoc 104, 376–378, https://doi.org/10.3163/1536-5050.104.4.031 (2016).
Thelwall, M. et al. Figshare: a universal repository for academic resource sharing. Online Information Review 40, 333–346, https://doi.org/10.1108/OIR-06-2015-0190 (2016).
Zhao, B. Web scraping. Encyclopedia of big data, 1–3 (2017).
vanden Broucke, S. et al. Practical Web Scraping for Data Science: Best Practices and Examples with Python. (Apress, 2018).
Goldstein, S. et al. Requirements for the publication of geochemical data. Integrated Earth Data Applications (IEDA). 10 (2014).
Chamberlain, K. J. et al. Time to change the data culture in geochemistry. Nature Reviews Earth & Environment https://doi.org/10.1038/s43017-021-00237-w (2021).
Martin, E. L. et al. GEOSCRAPE zircon database. GRO.data https://doi.org/10.25625/FWQ7DT (2021).
Cawood, P. A. et al. The continental record and the generation of continental crust. GSA Bulletin 125, 14–32, https://doi.org/10.1130/b30722.1 (2013).
Anders, E. et al. Abundances of the elements: Meteoritic and solar. Geochimica et Cosmochimica Acta 53, 197–214, https://doi.org/10.1016/0016-7037(89)90286-X (1989).
Ferry, J. M. et al. New thermodynamic models and revised calibrations for the Ti-in-zircon and Zr-in-rutile thermometers. Contributions to Mineralogy and Petrology 154, 429–437, https://doi.org/10.1007/s00410-007-0201-0 (2007).
Zheng, W. et al. Early Cretaceous magmatism and associated polymetallic mineralization in South China: the Tiantang example. International Geology Review 60, 1560–1580, https://doi.org/10.1080/00206814.2017.1326180 (2018).
Schmieder, M. et al. Earth’s Impact Events Through Geologic Time: A List of Recommended Ages for Terrestrial Impact Structures and Deposits. Astrobiology 20, 91–141, https://doi.org/10.1089/ast.2019.2085 (2019).
Westin, A. et al. A paleoproterozoic intra-arc basin associated with a juvenile source in the Southern Brasilia Orogen: Application of U–Pb and Hf–Nd isotopic analyses to provenance studies of complex areas. Precambrian Research 276, 178–193, https://doi.org/10.1016/j.precamres.2016.02.004 (2016).
Storey, C. D. et al. Multiple high-pressure metamorphic events and crustal telescoping in the NW Highlands of Scotland. Journal of the Geological Society 167, 455–468, https://doi.org/10.1144/0016-76492009-024 (2010).
Ribeiro, B. V. et al. Using apatite to resolve the age and protoliths of mid-crustal shear zones: A case study from the Taxaquara Shear Zone, SE Brazil. Lithos 378-379, 105817, https://doi.org/10.1016/j.lithos.2020.105817 (2020).
Barrote, V. et al. 4D history of the Nimbus VHMS ore deposit in the Yilgarn Craton, Western Australia. Precambrian Research 337, 105536, https://doi.org/10.1016/j.precamres.2019.105536 (2020).
Horstwood, M. S. A. et al. Community-Derived Standards for LA-ICP-MS U-(Th-)Pb Geochronology – Uncertainty Propagation, Age Interpretation and Data Reporting. Geostandards and Geoanalytical Research 40, 311–332, https://doi.org/10.1111/j.1751-908X.2016.00379.x (2016).
Broman, K. W. et al. Data Organization in Spreadsheets. The American Statistician 72, 2–10, https://doi.org/10.1080/00031305.2017.1375989 (2018).
Lehnert, K. et al. A global geochemical database structure for rocks. Geochemistry, Geophysics, Geosystems 1, https://doi.org/10.1029/1999GC000026 (2000).
Martin, E. L. et al. SQLite files. figshare. Martin, Erin (2021): SQLite files. figshare https://doi.org/10.6084/m9.figshare.16870603.v2 (2021).
Andersen, T. et al. Granitic magmatism by melting of juvenile continental crust: new constraints on the source of Palaeoproterozoic granitoids in Fennoscandia from Hf isotopes in zircon. Geological Society of London. https://doi.org/10.6084/m9.figshare.3454589.v1 (2016).
Zhang, L. et al. Provenance record of late Mesoproterozoic to early Neoproterozoic units, west Hainan, South China, and implications for Rodinia reconstruction. figshare https://doi.org/10.6084/m9.figshare.12449579.v1 (2020).
Van Thanh, T. et al. Late Permian-Triassic granitic rocks of Vietnam: the Muong Lat example. Taylor & Francis. https://doi.org/10.6084/m9.figshare.7599125.v2 (2020).
Han, J.-L. et al. Jurassic granitic magmatism in the lesser Xing’an-Zhangguangcai ranges of NE China: the Dong’an example. Taylor & Francis. https://doi.org/10.6084/m9.figshare.7776812.v1 (2019).
Deng, C. et al. Geochemistry of Early Cretaceous volcanic rocks in the Northeastern Great Xing’an Range, northeast China and implication for geodynamic setting. Taylor & Francis. https://doi.org/10.6084/m9.figshare.7166012.v1 (2018).
Tang, J. et al. Geochronology, geochemistry and zircon Hf isotope constraints on petrogenesis and tectonic setting of Early Permian volcanic rocks from Sonid Youqi area, Solonker Zone. Taylor & Francis. https://doi.org/10.6084/m9.figshare.13499378.v1 (2020).
Yin, Q.-Z. et al. Crustal evolution of the South Mayo Trough, western Ireland, based on U–Pb ages and Hf–O isotopes in detrital zircons. Geological Society of London. https://doi.org/10.6084/m9.figshare.3453110.v1 (2016).
Sewell, R. J. et al. Table S2. Unravelling an allochthonous, subaqueously deposited volcanic–epiclastic to subaerial andesitic lava assemblage in Hong Kong: age, stratigraphy and provenance studies of the Middle Jurassic Tuen Mun Formation. Geological Society of London. https://doi.org/10.6084/m9.figshare.4829233.v1 (2017).
Holm, R. J. et al. Petrology and crustal inheritance of the Cloudy Bay Volcanics as derived from a fluvial conglomerate, Papuan Peninsula (Papua New Guinea): An example of geological inquiry in the absence of in situ outcrop. Taylor & Francis. https://doi.org/10.6084/m9.figshare.6087020.v1 (2018).
Chen, J.-F. et al. Late Ordovician to early Silurian calc-alkaline magmatism in the Xiemisitai Mountains, northern West Junggar: a response to the subduction of the Junggar-Balkhash Ocean. Taylor & Francis. https://doi.org/10.6084/m9.figshare.7750853.v1 (2019).
Yamamoto, H. et al. Paleoproterozoic to Cenozoic zircon U–Pb ages with Hf signatures from metamorphic rocks and granodiorite of Tokunoshima: constraints on the geotectonic subdivision of the Ryukyu island arc, Southwest Japan. Taylor & Francis. https://doi.org/10.6084/m9.figshare.13490597.v1 (2020).
Mohammadi, A. et al. Zircon U-Pb geochronology and geochemistry of Late Devonian–Carboniferous granitoids in NW Iran: implications for the opening of Paleo-Tethys. Taylor & Francis. https://doi.org/10.6084/m9.figshare.9981410.v1 (2019).
Lu, L. et al. Petrogenesis of post-collisional magmatism at the Carboniferous–Permian boundary in central Inner Mongolia, NE China: insights into when the Hegenshan Ocean closed? Taylor & Francis. https://doi.org/10.6084/m9.figshare.10072379.v1 (2019).
Li, Y. et al. Supplemental Material: Petrological, geochronological, and geochemical potential accounting for continental subduction and exhumation: A case study of felsic granulites from South Altyn Tagh, northwestern China., https://doi.org/10.1130/2020188 (2020).
Zhu, G. et al. Supplemental Material: Internal versus external locations of the South China Craton within Rodinia during the Cryogenian: Provenance history of the Nanhua Basin, https://doi.org/10.1130/gsab.S.12501830 (2020).
Rocha, B. C. et al. Supplemental Material: Rapid eruption of silicic magmas from the Paraná magmatic province (Brazil) did not trigger the Valanginian event, https://doi.org/10.1130/GEOL.S.12678926.v1 (2020).
Huo, H. et al. Detrital zircon ages and Hf isotopic compositions of metasedimentary rocks in the Wuqia area of Southwest Tianshan, NW China: implications for the early Paleozoic tectonic evolution of the Tianshan orogenic belt. Taylor & Francis. https://doi.org/10.6084/m9.figshare.7834790.v1 (2019).
Wang, Y.-H. et al. Petrogenesis of early Silurian intrusions in the Sanchakou area of Eastern Tianshan, Northwest China, and tectonic implications: geochronological, geochemical, and Hf isotopic evidence. Taylor & Francis. https://doi.org/10.6084/m9.figshare.2807758 (2016).
Augustsson, C. et al. Provenance of late Palaeozoic metasediments of the SW South American Gondwana margin: a combined U–Pb and Hf-isotope study of single detrital zircons. Geological Society of London. https://doi.org/10.6084/m9.figshare.3454355.v1 (2016).
Cheng, C. et al. U–Pb detrital zircon geochronology and Hf isotopic composition of Permian clastic rocks, Zhen’an basin, South Qinling belt: implications for the Paleozoic tectonic evolution of the Qinling orogenic belt. Taylor & Francis. https://doi.org/10.6084/m9.figshare.7094243.v1 (2018).
Wu, C.-Z. et al. Ordovician volcano–sedimentary iron deposits of the Eastern Tianshan area, Northwest China: the Tianhu example. Taylor & Francis https://doi.org/10.6084/m9.figshare.3153838 (2016).
RØhr, T. S. et al. Provenance of Lower Cretaceous sediments in the Wandel Sea Basin, North Greenland. Geological Society of London. https://doi.org/10.6084/m9.figshare.3454526.v1 (2016).
Gao, W. et al. Petrogenesis and tectonic implications of Triassic A-type granites in southeastern China: insights from zircon U–Pb–Hf isotopic and whole-rock geochemical compositions of the Luoguyan and Guiyantou granites in northwestern Fujian Province. Taylor & Francis. https://doi.org/10.6084/m9.figshare.5766567.v1 (2018).
Klein, B. et al. Supplemental Material: High-precision geochronology requires that ultrafast mantle-derived magmatic fluxes built the transcrustal Bear Valley Intrusive Suite, Sierra Nevada, California, USA. The Geological Society of America https://doi.org/10.1130/GEOL.S.12888539.v1 (2020).
Sun, S. et al. Palaeoarchaean materials in the Tibetan Plateau indicated by zircon. Taylor & Francis. https://doi.org/10.6084/m9.figshare.5354035.v1 (2017).
Scott, J. Stewart Island geochronology New Zealand. figshare https://doi.org/10.6084/m9.figshare.13345328.v1 (2020).
Boekhout, F. et al. A Hf-isotope perspective on continent formation in the south Peruvian Andes. Geological Society of London. https://doi.org/10.6084/m9.figshare.3453464.v1 (2016).
Li, Y. et al. Table 1, supplementary data for the paper: Detachment faulting in the Xigazê ophiolite: New constraints on its formation and implications for other ophiolites in the YZSZ, southern Tibet. 4TU.Centre for Research Data https://doi.org/10.4121/uuid:41f45b0b-fe19-4007-a4aa-7234e08f40f1 (2020).
Wang, J. et al. Detrital zircon provenance of the Wangshi and Laiyang groups of the Jiaolai basin: evidence for Early Cretaceous uplift of the Sulu orogen, Eastern China. Taylor & Francis https://doi.org/10.6084/m9.figshare.1591117.v1 (2015).
Zhang, Y. Supplemental Material: Rifting and subduction records of the Paleo–Tethys in North Laos: Constraints from Late Paleozoic mafic and plagiogranitic magmatism along the Song Ma tectonic zone. The Geological Society of America https://doi.org/10.1130/gsab.S.12252230 (2020).
Ding, Q.-F. et al. Zircon U–Pb geochronology and Hf isotopic constraints on the petrogenesis of the Late Silurian Shidonggou granite from the Wulonggou area in the Eastern Kunlun Orogen, Northwest China. Taylor & Francis. https://doi.org/10.6084/m9.figshare.7205153.v1 (2018).
Willner, A. P. et al. Origin and evolution of Avalonia: evidence from U–Pb and Lu–Hf isotopes in zircon from the Mira terrane, Canada, and the Stavelot–Venn Massif, Belgium. Geological Society of London. https://doi.org/10.6084/m9.figshare.3453404.v1 (2016).
Li, C. Table S4. Detrital Zircon U-Pb data.xlsx. figshare https://doi.org/10.6084/m9.figshare.12947522.v1 (2020).
Minh, P. et al. Neoproterozoic granitoids from the Phan Si Pan Zone, NW Vietnam: geochemistry and geochronology constraints on reconstructing South China – India Palaeogeography. Taylor & Francis. https://doi.org/10.6084/m9.figshare.11889408.v1 (2020).
Konstantinou, A. et al. Supplemental material: Geochemistry and geochronology of the Jim Sage volcanic suite, southern Idaho: Implications for Snake River Plain magmatism and its role in the history of Basin and Range extension. The Geological Society of America https://doi.org/10.1130/ges00948.S6 (2013).
Huang, T.-T. et al. Sedimentary record of Jurassic northward subduction of the Bangong–Nujiang Ocean: insights from detrital zircons. Taylor & Francis. https://doi.org/10.6084/m9.figshare.3749355.v1 (2016).
Hu, Z. et al. Geochemical study of Cretaceous magmatic rocks in Chuzhou region, low Yangtze River metallogenic belt: implications for petrogenesis and Cu–Au mineralization. Taylor & Francis https://doi.org/10.6084/m9.figshare.5423107.v1 (2017).
Han, S.-J. et al. Geochronology and geochemistry of late Jurassic–Early Cretaceous volcanic rocks in the southern Great Xing’an range, NE China: constraints for late Mesozoic tectono-magmatic evolution. Taylor & Francis. https://doi.org/10.6084/m9.figshare.12854090.v1 (2020).
Moghadam, H. S. et al. Age and nature of 560–520 Ma calc-alkaline granitoids of Biarjmand, northeast Iran: insights into Cadomian arc magmatism in northern Gondwana. Taylor & Francis. https://doi.org/10.6084/m9.figshare.3179419 (2016).
Gao, W. et al. The role of mafic microgranular enclaves in the generation of Early Cretaceous granitic rocks of SE China: evidence from zircon U–Pb geochronology, geochemistry, and Hf isotopic data for the Liangnong pluton, eastern Zhejiang Province. Taylor & Francis. https://doi.org/10.6084/m9.figshare.3978588.v1 (2016).
Yang, H. et al. Table 3. Zircon LA–ICP–MS U–Pb isotopic data. Petrogenesis of Early Paleozoic diorites and mafic–intermediate dykes from the eastern Qilian orogen, NE Tibetan Plateau: implication for lithospheric processes. Geological Society of London. https://doi.org/10.6084/m9.figshare.5783151.v1 (2018).
Yu, J. Table S1.xlsxTectonic switching of Southeast South in the late Paleozoic. figshare https://doi.org/10.6084/m9.figshare.6737129.v2 (2018).
Suhr, N. et al. Archaean granulite-facies paragneisses from central Swaziland: inferences on Palaeoarchaean crustal reworking and a complex metamorphic history. Geological Society of London. https://doi.org/10.6084/m9.figshare.3453836.v1 (2016).
Xu, Y. et al. Zircon U–Pb ages and Hf isotopic compositions of two types of supracrustal rocks in the Northeastern Sulu UHP terrane: constraints on the surface boundary between South China and North China. Taylor & Francis. https://doi.org/10.6084/m9.figshare.5883139.v1 (2018).
Sun, S.-J. et al. Mid–Late Cretaceous igneous activity in South China: the Qianjia example, Hainan Island. Taylor & Francis. https://doi.org/10.6084/m9.figshare.5625316.v1 (2017).
Wang, W. et al. Early Cretaceous K-rich rhyolites from the Duolong Cu–Au deposit, southern Qiangtang, China: evidence for crustal growth. Taylor & Francis. https://doi.org/10.6084/m9.figshare.5341093.v1 (2017).
Zeh, A. et al. U–Pb and Hf isotope data of detrital zircons from the Barberton Greenstone Belt: constraints on provenance and Archaean crustal evolution. Geological Society of London. https://doi.org/10.6084/m9.figshare.3453164.v1 (2016).
Hu, C.-N. et al. Devonian rodingite from the northern margin of the North China Craton: mantle wedge metasomatism during ocean–continent convergence. Taylor & Francis. https://doi.org/10.6084/m9.figshare.5331865.v1 (2017).
Shakoor, M. A. et al. Early Neoproterozoic evolution of Southeast Pakistan: evidence from geochemistry, geochronology, and isotopic composition of the Nagarparkar Igneous Complex. Taylor & Francis. https://doi.org/10.6084/m9.figshare.7117805.v1 (2018).
Yu, J. Table S2.xlsxTectonic switching of Southeast South in the late Paleozoic. figshare https://doi.org/10.6084/m9.figshare.6737141.v2 (2018).
Klemetti, E. W. et al. Localized Rejuvenation of a Crystal Mush Recorded in Zircon Temporal and Compositional Variation at the Lassen Volcanic Center, Northern California. PLOS ONE 9, e113157, https://doi.org/10.1371/journal.pone.0113157 (2014).
Chen, Z.-H. et al. First discovery of a Palaeoproterozoic A-type granite in southern Wuyishan terrane, Cathaysia Block: evidence from geochronology, geochemistry, and Nd–Hf–O isotopes. Taylor & Francis https://doi.org/10.6084/m9.figshare.3503837.v1 (2016).
Guo, X. et al. Middle Triassic arc magmatism along the northeastern margin of the Tibet: U–Pb and Lu–Hf zircon characterization of the Gangcha complex in the West Qinling terrane, central China. Geological Society of London. https://doi.org/10.6084/m9.figshare.3453044.v1 (2016).
Liu, D. et al. Slab roll-back and crustal growth in the Eastern Junggar terrane, NW China: evidence from Carboniferous A-type granitoids and adakitic rocks. Taylor & Francis. https://doi.org/10.6084/m9.figshare.11889624.v1 (2020).
Wang, P. et al. Triassic ore-bearing and barren porphyries in the Zhongdian Arc of SW China: implications for the subduction of the Palaeo-Tethys Ocean. Taylor & Francis. https://doi.org/10.6084/m9.figshare.4737838.v1 (2017).
Yang, S.-S. et al. Petrogenesis and geodynamic setting of the Triassic granitoid plutons in West Qinling, China: insights from LA-ICP-MS zircon U–Pb ages, Lu–Hf isotope signatures and geochemical characteristics of the Zhongchuan pluton. Taylor & Francis. https://doi.org/10.6084/m9.figshare.4743556.v1 (2017).
Zhang, Z. Timescales of Partial Melting and Melt Crystallization in the Eastern Himalayan Orogen: Insights from Zircon Petrochronology. figshare https://doi.org/10.6084/m9.figshare.13185278.v3 (2020).
Liu, Y. et al. Cambrian granitic gneiss within the central Qiangtang terrane, Tibetan Plateau: implications for the early Palaeozoic tectonic evolution of the Gondwanan margin. Taylor & Francis. https://doi.org/10.6084/m9.figshare.2075308 (2016).
Xie, J. et al. Petrogenesis and metallogenic implications of Late Mesozoic intrusive rocks in the Tongling region, eastern China: a case study and perspective review. Taylor & Francis. https://doi.org/10.6084/m9.figshare.5483296.v1 (2017).
Craven, S. J. et al. High-temperature–low-pressure metamorphism and the production of S-type granites of the Hillgrove Supersuite, southern New England Orogen, NSW, Australia. Taylor & Francis https://doi.org/10.6084/m9.figshare.5877802.v1 (2018).
Tang, J. et al. Early Cretaceous volcanic and sub-volcanic rocks in the Erlian Basin and adjacent areas, Northeast China: new geochemistry, geochronology and zircon Hf isotope constraints on petrogenesis and tectonic setting. Taylor & Francis https://doi.org/10.6084/m9.figshare.7094246.v1 (2018).
Zhou, R. et al. Provenance analyses of early Mesozoic sediments in the Ningwu basin: Implications for the tectonic–palaeogeographic evolution of the northcentral North China Craton. Taylor & Francis. https://doi.org/10.6084/m9.figshare.5640370.v1 (2017).
Fu, S. et al. Origin of Triassic granites in central Hunan Province, South China: constraints from zircon U–Pb ages and Hf and O isotopes. Taylor & Francis https://doi.org/10.6084/m9.figshare.1290934.v2 (2015).
Cong, F. et al. Petrogenesis of the Late Triassic Mengsong strongly peraluminous granites in the southeastern Tibetan Plateau: highly fractionated from crystal mush. Taylor & Francis. https://doi.org/10.6084/m9.figshare.13174491.v1 (2020).
Li, K. et al. Paleoproterozoic S-type granites in the Lengshui complex, South China: Implications for the tectonic evolution of the Yangtze Block. Taylor & Francis. https://doi.org/10.6084/m9.figshare.12854114.v1 (2020).
Schermer, E. R. et al. Supplemental Material: U-Pb and Hf isotopic evidence for an Arctic origin of terranes in northwestern Washington. The Geological Society of America https://doi.org/10.1130/ges01557.S1 (2018).
Jiang, X.-W. et al. The Mojiawan I-type granite of the Kangding Complex in the western Yangtze Block: new constraint on the Neoproterozoic magmatism and tectonic evolution of South China. Taylor & Francis https://doi.org/10.6084/m9.figshare.13121892.v1 (2020).
Busby, C. et al. Supplemental Material: Volcanic record of the arc-to-rift transition onshore of the Guaymas basin in the Santa Rosalía area, Gulf of California, Baja California. The Geological Society of America https://doi.org/10.1130/GEOS.S.12635987.v1 (2020).
Mi, K.-F. et al. SHRIMP U-Pb zircon geochronology and Hf isotope analyses of Middle Permian–early triassic intrusions in southern Manzhouli area, Northeast China: implications for the subduction of Mongol-Okhotsk plate beneath the Erguna massif. Taylor & Francis. https://doi.org/10.6084/m9.figshare.8247353.v1 (2019).
Mao, A. et al. Late Palaeozoic–Early Mesozoic southward subduction of the Mongol–Okhotsk oceanic slab: geochronological, geochemical, and Hf isotopic evidence from intrusive rocks in the Erguna Massif (NE China). Taylor & Francis. https://doi.org/10.6084/m9.figshare.12854087.v1 (2020).
Li, G. et al. Discovery of Neoproterozoic highly fractionated syenogranite in the southwestern part of the Erguna Massif in NE China and its geological implication. Taylor & Francis https://doi.org/10.6084/m9.figshare.12854159.v1 (2020).
Cecil, M. R. et al. Supplemental Material: Mantle control on magmatic flare-ups in the southern Coast Mountains batholith, British Columbia. Geological Society of America. https://doi.org/10.1130/GEOS.S.14779818.v1 (2021).
Yang, Y. et al. Petrogenesis, Redox State, and Mineralization Potential of Triassic Granitoids in the Mengshan District, South China. Frontiers in Earth Science 9, https://doi.org/10.3389/feart.2021.657618 (2021).
Chen, J.-Y. et al. Supplemental Material: Generation of Cretaceous high-silica granite by complementary crystal accumulation and silicic melt extraction in the coastal region of southeastern China. The Geological Society of America https://doi.org/10.1130/GSAB.S.14230454.v1 (2021).
Tang, Y.-W. et al. Supplemental Material: Origin of syn-collisional granitoids in the Gangdese orogen: Reworking of the juvenile arc crust and the ancient continental crust. The Geological Society of America https://doi.org/10.1130/GSAB.S.14614557.v1 (2021).
Xi, W. et al. Geochronological Constraint on the Evolution of the Aktyuz Terrane, Kyrgyz North Tianshan, and the Fate of the Taldybulak Levoberezhny Gold Deposit. Frontiers in Earth Science 9, https://doi.org/10.3389/feart.2021.664361 (2021).
Zhong, Y.-T. et al. Supplemental Material: Constraining the duration of the Tarim flood basalts (northwestern China): CA-TIMS zircon U-Pb dating of tuffs. The Geological Society of America https://doi.org/10.1130/GSAB.S.14356322.v1 (2021).
Wang, X. et al. Table S2-zircon Hf.xlsx. figshare https://doi.org/10.6084/m9.figshare.14376392.v2 (2021).
Shellnutt, J. G. et al. Late Jurassic Leucogranites of Macau (SE China): A Record of Crustal Recycling During the Early Yanshanian Orogeny. Frontiers in Earth Science 8, https://doi.org/10.3389/feart.2020.00311 (2020).
Zhao, B. et al. Supplemental Material: Late Neoproterozoic to early Paleozoic paleogeographic position of the Yangtze block and the change of tectonic setting in its northwestern margin: Evidence from detrital zircon U-Pb ages and Hf isotopes of sedimentary rocks. The Geological Society of America https://doi.org/10.1130/GSAB.S.14390390.v1 (2021).
Wang, J. et al. Middle Triassic volcanic rocks from the Gangdese belt, southern Tibet: petrogenesis and implications for Tethys tectonic evolution. Taylor & Francis. https://doi.org/10.6084/m9.figshare.14185282.v1 (2021).
Jiang, Y.-Y. et al. Supplemental Material: Early Cenozoic partial melting of meta-sedimentary rocks of the eastern Gangdese arc, southern Tibet, and its contribution to syn-collisional magmatism. The Geological Society of America https://doi.org/10.1130/GSAB.S.14241947.v1 (2021).
Moecher, D. et al. Supplemental Material: Zircon and monazite geochronology in the Palmer zone of transpression, south-central New England, USA: Constraints on timing of deformation, high-grade metamorphism, and lithospheric foundering during late Paleozoic oblique collision in the Northern Appalachian orogen. The Geological Society of America https://doi.org/10.1130/GSAB.S.12857882.v1 (2020).
Coombs, H. E. Supplemental Material: Petrogenesis of the crystalline basement along the western Gulf of Mexico: Postcollisional magmatism during the formation of Pangea. (Geological Society of America, 2020).
Thomas, W. A. et al. Supplemental Material: Detrital-zircon analyses, provenance, and late Paleozoic sediment dispersal in the context of tectonic evolution of the Ouachita orogen. Geological Society of America. https://doi.org/10.1130/GEOS.S.14049965.v1 (2021).
Wu, Q. et al. Supplemental Material: High-precision U-Pb age constraints on the Permian floral turnovers, paleoclimate change, and tectonics of the North China block. The Geological Society of America https://doi.org/10.1130/geol.S.13585013 (2021).
Attia, S. et al. Supplemental Material: Detrital zircon provenance and depositional links of Mesozoic Sierra Nevada intra-arc strata. The Geological Society of America https://doi.org/10.1130/GEOS.S.14673861.v1 (2021).
Yuan, L. et al. Supplemental Material: The timeline of prolonged accretionary processes in eastern Central Asian Orogenic Belt: Insights from episodic Paleozoic intrusions in central Inner Mongolia, North China. The Geological Society of America https://doi.org/10.1130/GSAB.S.14600226.v1 (2021).
George, S. et al. Supplemental Material: Did accretion of the Caribbean oceanic plateau drive rapid crustal thickening in the northern Andes? The Geological Society of America https://doi.org/10.1130/GEOL.S.14347001.v1 (2021).
Smith, A. L. et al. Supplemental Material: Providencia Island: A Miocene Stratovolcano on the Lower Nicaraguan Rise, Western Caribbean—A Geological Enigma Resolved Item. The Geological Society of America https://doi.org/10.1130/MWR.S.14489175.v3 (2021).
Kirkland, C. L. et al. Full zircon U-Pb geochronology data. figshare https://doi.org/10.6084/m9.figshare.14178392.v1 (2021).
Capaldi, T. N. et al. Supplemental Material: Detrital zircon record of Phanerozoic magmatism in the southern Central Andes. The Geological Society of America https://doi.org/10.1130/GEOS.S.14251604.v1 (2021).
III, J. V. J. et al. Supplemental Material: Cretaceous to Oligocene magmatic and tectonic evolution of the western Alaska Range: Insights from U-Pb and 40Ar/39Ar geochronology. The Geological Society of America https://doi.org/10.1130/GEOS.S.13133177.v2 (2020).
Hodgin, E. B. et al. Supplemental Material: A link between rift-related volcanism and end-Ediacaran extinction? Integrated chemostratigraphy, biostratigraphy, and U-Pb geochronology from Sonora, Mexico. The Geological Society of America https://doi.org/10.1130/GEOL.S.12915629.v1 (2020).
Metzger, J. G. et al. Supplemental Material: New age constraints on the duration and origin of the Late Ordovician Guttenberg d13Ccarb excursion from high-precision U-Pb geochronology of K-bentonites. The Geological Society of America https://doi.org/10.1130/GSAB.S.12501191.v2 (2021).
Ejembi, J. I. et al. Supplemental Material: Detrital zircon geochronology and provenance of the Middle to Late Jurassic Paradox Basin and Central Colorado trough: Paleogeographic implications for southwestern Laurentia. The Geological Society of America https://doi.org/10.1130/GEOS.S.14471031.v1 (2021).
Rasmussen, C. et al. Supplemental Material: U-Pb zircon geochronology and depositional age models for the Upper Triassic Chinle Formation (Petrified Forest National Park, Arizona, USA): Implications for Late Triassic paleoecological and paleoenvironmental change. The Geological Society of America https://doi.org/10.1130/GSAB.S.12275510.v2 (2020).
Archibald, D. B. et al. Supplemental Material: The construction of the Donegal composite batholith, Irish Caledonides: Temporal constraints from U-Pb dating of zircon and titanite. The Geological Society of America https://doi.org/10.1130/GSAB.S.13653200.v1 (2021).
Tsikouras, B. et al. Supplemental Material: New zircon radiometric U-Pb ages and Lu-Hf isotopic data from the ultramafic-mafic sequences of Ranau and Telupid (Sabah, eastern Malaysia): Time to reconsider the geological evolution of Southeast Asia? The Geological Society of America https://doi.org/10.1130/GEOL.S.14150039.v1 (2021).
Freitas, B. et al. Supplemental Material: Cryogenian glaciostatic and eustatic fluctuations and massive Marinoan-related deposition of Fe and Mn in the Urucum District, Brazil. The Geological Society of America https://doi.org/10.1130/GEOL.S.15138600.v1 (2021).
Johnston, S. et al. Supplemental Material: Outer forearc uplift and exhumation during high-flux magmatism: Evidence from detrital zircon geochemistry of the Nacimiento forearc basin, California, USA. The Geological Society of America https://doi.org/10.1130/GEOL.S.14233481.v1 (2021).
Memeti, V. et al. Supplemental Material: Coupled magmatic and host rock processes during the initiation of the Tuolumne Intrusive Complex, Sierra Nevada, California, USA: A transition from ephemeral sheets to long-lived, active magma mushes. The Geological Society of America https://doi.org/10.1130/GSAB.S.15025437.v1 (2021).
Bruno, H. et al. Supplemental Material: Earth’s new tectonic regime at the dawn of the Paleoproterozoic: Hf isotope evidence for efficient crustal growth and reworking in the São Francisco craton, Brazil. The Geological Society of America https://doi.org/10.1130/GEOL.S.14771130.v1 (2021).
Guo, J. et al. Supplemental Material: Unraveling the link between mantle upwelling and formation of Sn-bearing granitic rocks in the world-class Dachang tin district, South China. The Geological Society of America https://doi.org/10.1130/GSAB.S.14668626.v1 (2021).
Foley, E. K. et al. Supplemental Material: Jurassic Arc: Reconstructing the Lost World of eastern Gondwana. The Geological Society of America https://doi.org/10.1130/GEOL.S.14925234.v1 (2021).
Turnbull, R. et al. Supplemental Material: A hidden Rodinian lithospheric keel beneath Zealandia, Earth’s newly recognized continent. The Geological Society of America https://doi.org/10.1130/GEOL.S.14417615.v2 (2021).
Wang, X. et al. Table S1.xlsx. figshare https://doi.org/10.6084/m9.figshare.14376116.v1 (2021).
Hoiland, C. W. et al. Detrital zircon U–Pb geochronology and Hf isotope geochemistry of metasedimentary strata in the southern Brooks Range: constraints on Neoproterozoic–Cretaceous evolution of Arctic Alaska. Geological Society of London. https://doi.org/10.6084/m9.figshare.5117581.v1 (2017).
Song, M. et al. Zircon Lu–Hf isotopic compositions. Early Mesozoic intracontinental orogeny and stress transmission in South China: evidence from Triassic peraluminous granites. Geological Society of London. https://doi.org/10.6084/m9.figshare.4580695.v2 (2017).
Fielding, L. et al. Lu–Hf zircon data. A detrital record of the Nile River and its catchment. Geological Society of London. https://doi.org/10.6084/m9.figshare.4206213.v1 (2016).
Yan, C. et al. The construction mechanism of the Neoproterozoic S-type Sanfang-Yuanbaoshan granitic plutons in the Jiangnan Orogenic Belt, South China revealed by geological observation, geochronology, AMS and Bouguer gravity modeling. figshare https://doi.org/10.6084/m9.figshare.11858388.v1 (2020).
Yang, H. et al. Table 4. Zircon Lu–Hf isotopic data. Petrogenesis of Early Paleozoic diorites and mafic–intermediate dykes from the eastern Qilian orogen, NE Tibetan Plateau: implication for lithospheric processes. Geological Society of London. https://doi.org/10.6084/m9.figshare.5783157.v1 (2018).
Andersen, T. et al. U–Pb and Lu–Hf zircon data in young sediments reflect sedimentary recycling in eastern South Africa. Geological Society of London. https://doi.org/10.6084/m9.figshare.3454121.v1 (2016).
Wu, D. et al. Supplement Information for Tectonics (Permian-Triassic magmatic evolution of granitoids from the southeastern Central Asian Orogenic Belt: implications for accretion leading to collision. figshare https://doi.org/10.6084/m9.figshare.12195678.v1 (2020).
Zhang, L. et al. Table A7: Zircon Lu–Hf isotopic data. Mafic rocks from the southern Alxa block of Northwest China and its geodynamic evolution in the Paleozoic. Geological Society of London. https://doi.org/10.6084/m9.figshare.13673767.v1 (2021).
Chen, Y. et al. Table S3. Zircon Lu–Hf isotopic data for the sandstones. Geochemistry and zircon U–Pb–Hf isotopic data for Permo-Carboniferous sediments in the Solonker Zone, Inner Mongolia, China: constraints on depositional age, provenance and tectonic setting. Geological Society of London. https://doi.org/10.6084/m9.figshare.5678773.v1 (2017).
Armistead, S. Supplementary A: New zircon U-Pb, REE and Lu-Hf data for detrital samples from Paleoproterozoic sequences in Madagascar. figshare https://doi.org/10.6084/m9.figshare.12783869.v1 (2020).
Gottlieb, E. S. et al. Neoproterozoic basement history of Wrangel Island and Arctic Chukotka: integrated insights from zircon U–Pb, O and Hf isotopic studies. Geological Society of London. https://doi.org/10.6084/m9.figshare.4873007.v1 (2017).
Wang, X.-Y. et al. Paleoproterozoic A-type granite from the southwestern margin of the North China block: high temperature melting of tonalitic crust in extensional setting. Taylor & Francis. https://doi.org/10.6084/m9.figshare.8260688.v1 (2019).
Woodard, J. et al. Table 3. Zircon and monazite geochronology of deformation in the Pielavesi Shear Zone, Finland: multistage evolution of the Archaean–Proterozoic boundary in the Fennoscandian Shield. Geological Society of London. https://doi.org/10.6084/m9.figshare.4004871.v1 (2016).
Ding, H. et al. Early Cenozoic thickening and reworking of the eastern Gangdese arc, south Tibet: constraints from the Oligocene granitoids. Geological Society of London. https://doi.org/10.6084/m9.figshare.6205604.v1 (2018).
Sun, S. et al. Table S3. Thickening and partial melting of the Northern Qinling Orogen, China: Insights from zircon U–Pb geochronology and Hf isotopic compositions of migmatite. Geological Society of London. https://doi.org/10.6084/m9.figshare.8197673.v1 (2019).
Wang, W. et al. LA-MC-ICP-MS Lu–Hf isotope data of detrital zircons. Zircon U–Pb age and Hf isotope evidence for an Eoarchaean crustal remnant and episodic crustal reworking in response to supercontinent cycles in NW India. Geological Society of London. https://doi.org/10.6084/m9.figshare.4733242.v1 (2017).
Liu, L. et al. Late Cretaceous granitoids in Karakorum, northwest Tibet: petrogenesis and tectonic implications. Taylor & Francis. https://doi.org/10.6084/m9.figshare.3504923.v1 (2016).
Júrez-Zúñiga, S. et al. Permian igneous clasts from the Matzitzi Formation, southern Mexico: isotopic constraints on the final amalgamation of Pangea. Geological Society of London. https://doi.org/10.6084/m9.figshare.12136878.v1 (2020).
Fritschle, T. et al. LA–MC–ICPMS zircon Lu–Hf isotopic data. Multiple intrusive phases in the Leinster Batholith, Ireland: geochronology, isotope geochemistry and constraints on the deformation history. Geological Society of London. https://doi.org/10.6084/m9.figshare.5477878.v1 (2017).
Fisher, K. B. S. et al. Supplemental material: Evolution of the Jura-Cretaceous North American Cordilleran margin: Insights from detrital-zircon U-Pb and Hf isotopes of sedimentary units of the North Cascades Range, Washington. The Geological Society of America https://doi.org/10.1130/ges01501.S1 (2017).
Sepidbar, F. et al. Geochemistry and tectonic significance of the Fannuj-Maskutan SSZ-type ophiolite (Inner Makran, SE Iran). Taylor & Francis. https://doi.org/10.6084/m9.figshare.12202406.v1 (2020).
Yin, J. et al. Supplemental Material: The role and significance of juvenile sediments in the formation of A-type granites, West Junggar oceanic arc (NW China): Zircon Hf-O isotopic perspectives. The Geological Society of America https://doi.org/10.1130/GSAB.S.13244348.v1 (2020).
Armistead, S. Supplementary B: Compiled database of zircon U-Pb and Lu-Hf data from Madagascar, East Africa and India. figshare https://doi.org/10.6084/m9.figshare.12783887.v3 (2020).
Moghadam, H. S. et al. Table S6: Zircon Lu–Hf and O isotope composition of the Paleogene rocks from oceanic tract of NW Iran. The Paleogene Ophiolite Conundrum of the Iran–Iraq Border Region. Geological Society of London. https://doi.org/10.6084/m9.figshare.12286616.v1 (2020).
Dey, S. et al. Mechanism of Paleoarchean continental crust formation as archived in granitoids from northern part of Singhbhum Craton, eastern India. Geological Society of London. https://doi.org/10.6084/m9.figshare.12205166.v1 (2020).
Hieu, P. T. et al. Archean to paleoproterozoic crustal evolution in the Phan Si Pan zone, Northwest Vietnam: evidence from the U-Pb geochronology and Sr-Nd-Hf isotopic geochemistry. Taylor & Francis. https://doi.org/10.6084/m9.figshare.13204864.v1 (2020).
Qian, T. et al. Supplemental Material: Jurassic evolution of the Qaidam Basin in western China: Constrained by stratigraphic succession, detrital zircon U-Pb geochronology and Hf isotope analysis. The Geological Society of America https://doi.org/10.1130/GSAB.S.13645856.v1 (2021).
Zhang, Z. et al. Early Cretaceous granodiorite and its mafic enclaves from the Shuiyu area (Southern North China Craton): implications for crust–mantle interaction. Taylor & Francis. https://doi.org/10.6084/m9.figshare.10317968.v1 (2019).
Fasulo, C. R. et al. Supplemental Material: Detrital zircon geochronology and Hf isotope geochemistry of Mesozoic sedimentary basins in south-central Alaska: Insights into regional sediment transport, basin development, and tectonics along the NW Cordilleran margin. Geological Society of America. https://doi.org/10.1130/GEOS.S.12465842.v1 (2020).
Zhou, H. et al. Supplemental Material: Tectonic origin of the Bainaimiao arc terrane in the southern Central Asian orogenic belt: Evidence from sedimentary and magmatic rocks in the Damao region. The Geological Society of America https://doi.org/10.1130/GSAB.S.12627752.v1 (2020).
Fang, W. et al. Supplemental Material: Syn-exhumation magmatism in an active continental margin above a continental subduction zone: Evidence from Late Triassic mafic igneous rocks in the southeastern North China Block. The Geological Society of America https://doi.org/10.1130/GSAB.S.12976991.v1 (2020).
Kristoffersen, M. et al. Detrital zircon in a supercontinental setting: locally derived and far-transported components in the Ordovician Natal Group, South Africa. Geological Society of London. https://doi.org/10.6084/m9.figshare.3454115.v1 (2016).
Wang, J. Q. et al. Petrogenesis and tectonic significance of late Mesozoic granitic and adakitic rocks from inland South China: constraints from geochemistry, zircon U–Pb geochronology and Hf isotopes. The Geological Society https://doi.org/10.6084/m9.figshare.5977129.v1 (2018).
Zheng, R. Zircon U-Pb ages and Hf isotopes, and whole-rock geochemical compositions. figshare https://doi.org/10.6084/m9.figshare.12398573.v1 (2020).
Liu, X. et al. Origin of the Cretaceous ore-bearing granitoids in the Beihuaiyang Zone, northern margin of the Dabie Orogen, Eastern China. Taylor & Francis. https://doi.org/10.6084/m9.figshare.5350429.v1 (2017).
Link, P. K. et al. Supplemental material: U-Pb zircon ages of the Wildhorse gneiss, Pioneer Mountains, south-central Idaho, and tectonic implications. The Geological Society of America https://doi.org/10.1130/ges01418.S4 (2017).
Fang, W. et al. Supplemental Material: Identification of Jurassic mafic arc magmatism in the eastern North China Craton: Geochemical evidence for westward subduction of the Paleo-Pacific slab. The Geological Society of America https://doi.org/10.1130/GSAB.S.12996212.v1 (2020).
Cao, G.-Y. et al. U–Pb zircon, geochemical, and Sr–Nd–Hf isotopic data for late Mesozoic volcanic rocks along the Tan–Lu fault zone of Shandong Province, eastern China: constraints on magma genesis and lithospheric thinning. Taylor & Francis. https://doi.org/10.6084/m9.figshare.6826838.v1 (2018).
Lin, C. et al. Supplemental Material: Himalayan Miocene adakitic rocks, a case study of the Mayum pluton: Insights into geodynamic processes within the subducted Indian continental lithosphere and Himalayan mid-Miocene tectonic regime transition. The Geological Society of America https://doi.org/10.1130/GSAB.S.12507449.v1 (2020).
Huang, Z. et al. Table S1 and Table S2. figshare https://doi.org/10.6084/m9.figshare.9901064.v1 (2019).
Liu, J. et al. Detrital zircon U–Pb geochronology and Lu–Hf isotopes of the Neoproterozoic Penglai Group and their comparisons with coevally sedimentary strata of the southeastern NCC: Provenance, tectonic affinity and implications. Geological Society of London. https://doi.org/10.6084/m9.figshare.11603271.v1 (2020).
Brennan, D. et al. Supplemental Material: Recalibrating Rodinian rifting in the northwestern United States. The Geological Society of America https://doi.org/10.1130/GEOL.S.13530668.v2 (2021).
Yang, X. et al. Petrogenesis of an early Eocene gabbro–granite complex in Kachang (SW Yunnan) and its implications for Eocene magmatism in the Tengchong terrane of SW China. Taylor & Francis. https://doi.org/10.6084/m9.figshare.5307100.v1 (2017).
Ma, C. et al. Supplemental Material: Mesozoic crustal melting and metamorphism in the U.S. Cordilleran hinterland: Insights from the Sawtooth metamorphic complex, central Idaho. The Geological Society of America https://doi.org/10.1130/GSAB.S.13393247.v1 (2020).
Zhang, Y.-X. et al. Late Permian–Triassic siliciclastic provenance, palaeogeography, and crustal growth of the Songpan terrane, eastern Tibetan Plateau: evidence from U–Pb ages, trace elements, and Hf isotopes of detrital zircons. Taylor & Francis. https://doi.org/10.6084/m9.figshare.1295494.v2 (2015).
Zhang, Z. et al. Origin of Late Permian amphibole syenite from the Panxi area, SW China: high degree fractional crystallization of basaltic magma in the inner zone of the Emeishan mantle plume. Taylor & Francis. https://doi.org/10.6084/m9.figshare.7964345.v1 (2019).
Dai, J.-G. et al. Supplemental Material: Forearc magmatic evolution during subduction initiation: Insights from an Early Cretaceous Tibetan ophiolite and comparison with the Izu-Bonin-Mariana forearc. The Geological Society of America https://doi.org/10.1130/GSAB.S.12670091.v2 (2020).
Liu, Q. Geochemical and isotopic data for the Longladuo mafic intrusions in the western Indus–Tsangpo suture zone, southwest Tibet. figshare https://doi.org/10.6084/m9.figshare.13655543.v1 (2021).
Yin, J. et al. The source and tectonic implications of late Carboniferous–early Permian A-type granites and dikes from the eastern Alataw Mountains, Xinjiang: geochemical and Sr–Nd–Hf isotopic constraints. Taylor & Francis. https://doi.org/10.6084/m9.figshare.4047765.v1 (2016).
Li, Q.-H. et al. Contrasting latest Permian intracontinental gabbro and Late Triassic arc gabbro–diorite in the Gangdese constrain the subduction initiation of the Neo-Tethys. Taylor & Francis. https://doi.org/10.6084/m9.figshare.13134728.v1 (2020).
Ustaomer, T. et al. U-Pb-Hf isotopic data from detrital zircons in late Carboniferous and Mid-Late Triassic sandstones, and also Carboniferous granites from the Tauride and Anatolide continental units in S Turkey: implications for Tethyan palaeogeography. Taylor & Francis. https://doi.org/10.6084/m9.figshare.8425775.v1 (2019).
Hervé, F. et al. Devonian magmatism in the accretionary complex of southern Chile. Geological Society of London. https://doi.org/10.6084/m9.figshare.2290369.v1 (2016).
Zhang, Y. et al. Provenance of detrital zircons in the Late Triassic Sichuan foreland basin: constraints on the evolution of the Qinling Orogen and Longmen Shan thrust-fold belt in central China. Taylor & Francis. https://doi.org/10.6084/m9.figshare.1414164.v3 (2015).
Xiao, Y. et al. Geochronological and geochemical constraints on Late Cryogenian to Early Ediacaran magmatic rocks on the northern Tarim Craton: implications for tectonic setting and affinity with Gondwana. Taylor & Francis. https://doi.org/10.6084/m9.figshare.7791803.v1 (2019).
Zieger, J. et al. The evolution of the southern Namibian Karoo-aged basins: implications from detrital zircon geochronologic and geochemistry data. Taylor & Francis. https://doi.org/10.6084/m9.figshare.12854147.v1 (2020).
Wang, H.-Z. et al. Cretaceous A-type volcanic–intrusive rocks and simultaneous mafic rocks along the Gan-Hang Tectonic Belt, Southeast China: petrogenesis and implications for the transition of crust–mantle interaction. Taylor & Francis. https://doi.org/10.6084/m9.figshare.5829711.v1 (2018).
Su, B. et al. Detrital zircon provenance and palaeogeographic implications of the Ediacaran Shigu Group in the Zhongza Terrane, SW China. Taylor & Francis. https://doi.org/10.6084/m9.figshare.9981419.v1 (2019).
Archibald, D. B. et al. MC-LA-ICP-MS zircon Hf isotope compositions. Stenian–Tonian arc magmatism in west–central Madagascar: the genesis of the Dabolava Suite. Geological Society of London. https://doi.org/10.6084/m9.figshare.5195593.v1 (2017).
Castillo, P. et al. O and Hf isotope data. Zircon O- and Hf-isotope constraints on the genesis and tectonic significance of Permian magmatism in Patagonia. Geological Society of London. https://doi.org/10.6084/m9.figshare.4959938.v1 (2017).
Tsai, C.-H. et al. Hf isotopic results of detrital zircons from all samples. Detrital zircon record from major rivers of Luzon Island: Implications for Cenozoic continental growth in Southeast Asia. Geological Society of London. https://doi.org/10.6084/m9.figshare.8034761.v1 (2019).
Song, D. Supplemental Material: Provenance and tectonic setting of late Paleozoic sedimentary rocks from the Alxa Tectonic Belt (NW China): Implications for accretionary tectonics of the southern Central Asian Orogenic Belt. The Geological Society of America https://doi.org/10.1130/GSAB.S.12274991.v1 (2020).
Zheng, H. et al. Early cretaceous ophiolites of the Yarlung Zangbo Suture Zone: insights from dolerites and peridotites from the Baer upper mantle suite, SW Tibet (China). Taylor & Francis. https://doi.org/10.6084/m9.figshare.4565293.v1 (2017).
Ma, X. et al. Supplemental Material: Identification of a new source for the Triassic Langjiexue Group: Evidence from a gabbro-diorite complex in the Gangdese magmatic belt and zircon microstructures from sandstones in the Tethyan Himalaya, southern Tibet. The Geological Society of America https://doi.org/10.1130/ges02154.S1 (2020).
Tang, D. Data_ Origin of hydrous magma_Baishiquan and Tianyu. figshare https://doi.org/10.6084/m9.figshare.12408554.v2 (2020).
Wang, Y. Supplemental Material: Ordo-Silurian assemblage in the Indochina interior: Geochronological, elemental, and Sr-Nd-Pb-Hf-O isotopic constraints of early Paleozoic granitoids in South Laos. The Geological Society of America https://doi.org/10.1130/gsab.S.12268520 (2020).
Wang, C. et al. Age, nature, and origin of Ordovician Zhibenshan granite from the Baoshan terrane in the Sanjiang region and its significance for understanding Proto-Tethys evolution. Taylor & Francis. https://doi.org/10.6084/m9.figshare.1468403.v2 (2015).
Andresen, A. et al. A Timanian foreland basin setting for the late Neoproterozoic–Early Palaeozoic cover sequences (Dividal Group) of northeastern Baltica. Geological Society of London. https://doi.org/10.6084/m9.figshare.3453677.v1 (2016).
Cao, H.-W. et al. Geochemistry, zircon U–Pb geochronology and Hf isotopes of Jurassic-Cretaceous granites in the Tengchong terrane, SW China: implications for the Mesozoic tectono-magmatic evolution of the Eastern Tethyan Tectonic Domain. Taylor & Francis. https://doi.org/10.6084/m9.figshare.5798844.v1 (2018).
Zeh, A. et al. Hafnium isotope record of the Ancient Gneiss Complex, Swaziland, southern Africa: evidence for Archaean crust–mantle formation and crust reworking between 3.66 and 2.73 Ga. Geological Society of London. https://doi.org/10.6084/m9.figshare.3452852 (2016).
Zheng, R. et al. Table S3. Middle Paleozoic ridge subduction in Central Beishan of southern Altaids: Evidence from geochemical, Sr–Nd and zircon U–Pb–Hf–O isotopic data of Gongpoquan volcanic rocks. The Geological Society https://doi.org/10.6084/m9.figshare.7957676.v1 (2019).
Wang, X. Supporting information.docx. figshare https://doi.org/10.6084/m9.figshare.7895495.v1 (2019).
Slagstad, T. et al. Tectonomagmatic evolution of the Early Ordovician suprasubduction-zone ophiolites of the Trondheim Region, Mid-Norwegian Caledonides. Geological Society of London. https://doi.org/10.6084/m9.figshare.3453551.v1 (2016).
Martínez, S. S. et al. Isotope geochemistry and revised geochronology of the Purrido Ophiolite (Cabo Ortegal Complex, NW Iberian Massif): Devonian magmatism with mixed sources and involved Mesoproterozoic basement. Geological Society of London. https://doi.org/10.6084/m9.figshare.3454955.v1 (2016).
Liu, D. et al. Zircon ages and Hf isotopic compositions of plutonic rocks from the Central Tianshan (Xinjiang, northwest China) and their significance for early to mid-Palaeozoic crustal evolution. Taylor & Francis. https://doi.org/10.6084/m9.figshare.1132661.v1 (2014).
Alessio, B. L. et al. Table S3. Lu–Hf analyses. Age, origin and palaeogeography of the Southern Irumide Belt, Zambia. Geological Society of London. https://doi.org/10.6084/m9.figshare.7660721.v1 (2019).
Dong, Y. et al. Formation of the Permian Taipinggou igneous rocks, north of Luobei (Northeast China): implications for the subduction of the Mudanjiang Ocean beneath the Bureya–Jiamusi Massif. Taylor & Francis. https://doi.org/10.6084/m9.figshare.5427268.v1 (2017).
Caylor, E. A. et al. Supplemental Material: Age and deposition of the Fort Crittenden Formation: A window into Late Cretaceous Laramide and Cenozoic tectonics in southeastern Arizona. The Geological Society of America https://doi.org/10.1130/GSAB.S.13289291.v3 (2021).
Zhang, J. et al. Tracking deep ancient crustal components by xenocrystic/inherited zircons of Palaeozoic felsic igneous rocks from the Altai–East Junggar terrane and adjacent regions, western Central Asian Orogenic Belt and its tectonic significance. Taylor & Francis. https://doi.org/10.6084/m9.figshare.4818031.v1 (2017).
Yang, B. et al. Appendices 2 and 3. Sample description and concordia plot. Middle-late Mesoproterozoic tectonic geography of the North Australia Craton: U–Pb and Hf isotopes of detrital zircon grains in the Beetaloo Sub basin, Northern Territory, Australia. Geological Society of London. https://doi.org/10.6084/m9.figshare.7880405.v1 (2019).
Liu, X.-C. et al. Supplemental material: Tracing crustal evolution by U-Th-Pb, Sm-Nd, and Lu-Hf isotopes in detrital monazite and zircon from modern rivers. The Geological Society of America https://doi.org/10.1130/2017026 (2017).
Wen, Z. et al. Detrital zircon U-Pb ages of the late Mesoproterozoic–Neoproterozoic Qiaotou formation in the Liao-Ji area of the North China Craton: implications for Rodinia reconstruction. Taylor & Francis. https://doi.org/10.6084/m9.figshare.12854117.v1 (2020).
Kuznetsov, N. B. et al. New data on detrital zircons from the sandstones of the lower Cambrian Brusov Formation (White Sea region, East-European Craton): unravelling the timing of the onset of the Arctida–Baltica collision. Taylor & Francis. https://doi.org/10.6084/m9.figshare.1229936.v4 (2014).
Sun, M. et al. Devonian arc-related granitoids in the Northwestern Chinese Tianshan, Central Asian Orogenic Belt: implications for the bending of the Kazakhstan Orocline. Taylor & Francis. https://doi.org/10.6084/m9.figshare.11988531.v1 (2020).
Chen, Q. et al. Supplemental Material: Protracted northward drifting of South China during the assembly of Gondwana: Constraints from the spatial-temporal provenance comparison of Neoproterozoic–Cambrian strata. The Geological Society of America https://doi.org/10.1130/GSAB.S.13377008.v1 (2020).
Bikramaditya, R. K. et al. Supplementary Table SBK 2. Age and isotope geochemistry of magmatic rocks of the Lohit plutonic complex, eastern Himalaya: Implications for the evolution of Transhimalayan arc magmatism. Geological Society of London. https://doi.org/10.6084/m9.figshare.9823535.v1 (2019).
Shi, Y. et al. Zircon ages and Hf isotopic compositions of Permian and Triassic A-type granites from central Inner Mongolia and their significance for late Palaeozoic and early Mesozoic evolution of the Central Asian Orogenic Belt. Taylor & Francis. https://doi.org/10.6084/m9.figshare.2067126.v1 (2016).
Li, C. et al. Crust–mantle interaction triggered by oblique subduction of the Pacific plate: geochronological, geochemical, and Hf isotopic evidence from the Early Cretaceous volcanic rocks of Zhejiang Province, southeast China. Taylor & Francis. https://doi.org/10.6084/m9.figshare.1181864.v2 (2014).
Mohammadi, A. et al. The Siah Cheshmeh-Khoy-Misho-Tabriz fault (NW Iran) is a cryptic neotethys suture: evidence from detrital zircon geochronology, Hf isotopes, and provenance analysis. Taylor & Francis. https://doi.org/10.6084/m9.figshare.13352656.v1 (2020).
Yuan, W. et al. Late Devonian closure of the North Qilian Ocean: evidence from detrital zircon U–Pb geochronology and Hf isotopes in the eastern North Qilian Orogenic Belt. Taylor & Francis. https://doi.org/10.6084/m9.figshare.1297338.v2 (2015).
Scherer, E. et al. Calibration of the lutetium-hafnium clock. Science 293, 683–687, https://doi.org/10.1126/science.1061372 (2001).
Bouvier, A. et al. The Lu-Hf and Sm-Nd isotopic composition of CHUR: Constraints from unequilibrated chondrites and implications for the bulk composition of terrestrial planets. Earth and Planetary Science Letters 273, 48–57, https://doi.org/10.1016/j.epsl.2008.06.010 (2008).
Griffin, W. et al. Zircon chemistry and magma mixing, SE China: in-situ analysis of Hf isotopes, Tonglu and Pingtan igneous complexes. Lithos 61, 237–269 (2002).
Acknowledgements
The authors thank two anonymous reviewers for their valuable comments and Dr. Guy Jones for editorial handling. Marthe Klöcking, Lachlan Grosse, and Monash Data Fluency Team are acknowledged for clarifying discussions and assistance with coding. The authors acknowledge funding to PAC from Australian Research Council Laureate Fellowship grant (FL160100168). The authors would also like to thank all the researchers who published the original datasets from which this dataset was compiled, see refs. 36,37,38,39,40,41,42,43,44,45,46,47,48,49,50,51,52,53,54,55,56,57,58,59,60,61,62,63,64,65,66,67,68,69,70,71,72,73,74,75,76,77,78,79,80,81,82,83,84,85,86,87,88,89,90,91,92,93,94,95,96,97,98,99,100,101,102,103,104,105,106,107,108,109,110,111,112,113,114,115,116,117,118,119,120,121,122,123,124,125,126,127,128,129,130,131,132,133,134,135,136,137,138,139,140,141,142,143,144,145,146,147,148,149,150,151,152,153,154,155,156,157,158,159,160,161,162,163,164,165,166,167,168,169,170,171,172,173,174,175,176,177,178,179,180,181,182,183,184,185,186,187,188,189,190,191,192,193,194,195,196,197,198,199,200,201,202,203,204,205,206,207,208,209,210,211,212,213,214,215,216,217,218,219,220,221,222,223,224,225,226,227,228,229,230,231.
Author information
Authors and Affiliations
Contributions
E.L.M. wrote the code and curated the database. E.L.M., V.R.B. and P.A.C. contributed to concept development and writing and editing of the manuscript.
Corresponding author
Ethics declarations
Competing interests
The authors declare no competing interests.
Additional information
Publisher’s note Springer Nature remains neutral with regard to jurisdictional claims in published maps and institutional affiliations.
Rights and permissions
Open Access This article is licensed under a Creative Commons Attribution 4.0 International License, which permits use, sharing, adaptation, distribution and reproduction in any medium or format, as long as you give appropriate credit to the original author(s) and the source, provide a link to the Creative Commons license, and indicate if changes were made. The images or other third party material in this article are included in the article’s Creative Commons license, unless indicated otherwise in a credit line to the material. If material is not included in the article’s Creative Commons license and your intended use is not permitted by statutory regulation or exceeds the permitted use, you will need to obtain permission directly from the copyright holder. To view a copy of this license, visit http://creativecommons.org/licenses/by/4.0/.
About this article

Cite this article
Martin, E.L., Barrote, V.R. & Cawood, P.A. A resource for automated search and collation of geochemical datasets from journal supplements. Sci Data 9, 724 (2022). https://doi.org/10.1038/s41597-022-01730-7
Received:
Accepted:
Published:
DOI: https://doi.org/10.1038/s41597-022-01730-7
This article is cited by
-
A geospatial platform for the tectonic interpretation of low-temperature thermochronology Big Data
Scientific Reports (2023)
