
Abstract
Clinical gait analysis is a promising approach for quantifying gait deviations and assessing the impairments altering gait in patients with osteoarthritis. There is a lack of consensus on the identification of kinematic outcomes that could be used for the diagnosis and follow up in patients. The proposed dataset has been established on 80 asymptomatic participants and 106 patients with unilateral hip osteoarthritis before and 6 months after arthroplasty. All volunteers walked along a 6 meters straight line at their self-selected speed. Three dimensional trajectories of 35 reflective markers were simultaneously recorded and Plugin Gait Bones, angles, Center of Mass trajectories and ground reaction forces were computed. Gait video recordings, when available, anthropometric and demographic descriptions are also available. A minimum of 10 trials have been made available in the weka file format and C3D file to enhance the use of machine learning algorithms. We aim to share this dataset to facilitate the identification of new movement-related kinematic outcomes for improving the diagnosis and follow up in patients with hip OA.
Measurement(s) | biomechanics data analysis objective |
Technology Type(s) | three dimensional cartesian spatial coordinate datum • force platform |
Factor Type(s) | Total Hip Arthroplasty • Hip Osteoathritis impact on gait |
Sample Characteristic - Organism | Human subjects |
Sample Characteristic - Environment | 3D Gait laboratory |
Sample Characteristic - Location | Bourgogne Region |
Background & Summary
Clinical gait analysis (CGA) can be incorporated into clinical decision-making for patients with complex osteo-articular gait disorders1 such as the quantification of gait deviations and to assess the impairments altering gait in patients with hip or knee osteoarthritis (OA)2,3,4,5,6. Indeed, it has already been shown that hip OA can lead to a reduced stride length, cadence and walking speed2,7 and may lead to specific gait patterns known as Duchenne, Trendelenburg and Antalgic gait8. Clinically, total hip arthroplasty (THA) is the most cost-effective treatment to relieve pain and improve function in patients with end-stage OA9. In this sense, several studies have investigated 3D kinematics to assess if gait deviations are reduced or not after total hip replacement10,11,12. However, there is a lack of consensus on the identification of kinematic-related outcomes that could be used as judgement criteria for the diagnosis and/or follow up in patients with hip OA.
Either kinematic or kinetic relevant outcomes or their combination remain difficult to identify by classical statistical methods due to the multitude of information resulting from CGA13,14. Moreover, these information could be continuous or discrete, time related, space related. Thus, information of the CGA could be extracted in the multiple ways prior described. The data processing is often made with linear statistics, that force to choose a priori one (univariate) or more (multivariate) discrete variables of interest, which naturally leads to a significant loss of information. Notably, temporal information as well as existing interdependency of these variables are not considered. Conversely, machine learning models could be used to allow more accurate recognition thanks to the correlations identified using data interdependency. Recent studies have shown the utility of machine learning to identify kinematic outcomes, in particular those for patients with hip and knee OA15,16,17, but their clinical relevance requires further exploration. Most of these outcomes allow to link OA severity (WOMAC scores) and kinematic outcomes (Knee flexion or Hip movement during gait) and will facilitate either the rehabilitation or adapt the follow up of patients with significant alteration of the gait pattern. Several datasets of healthy participants have been made available in the literature and can ease the establishment of a broad normative database allowing to match patient characteristics15,16,17, (e.g. age, sex, height and weight). However, to our knowledge, no dataset has been provided merging data of patients before and after THA and data of healthy participants recorded using the same protocol. Nonetheless, such a dataset is required before using machine learning models for kinematic outcomes identification of OA disease severity.
The present dataset has been established on 80 asymptomatic healthy participants (aged between 25 and 82 years) and 106 participants with end-stage unilateral hip OA (aged between 45 and 85 years), before and 6 months after THA, without other comorbidities that could affect the gait. The main objective of this dataset is to allow machine learning to identify the specific kinematic outcomes (spatiotemporal and kinematic parameters) in coxarthrosis in order to allow their automatic recognition by the machine. The dataset was presented both in C3D raw-files format and weka file format in order to facilitate its integration in machine learning algorithms.
Methods
Participants
Eighty asymptomatic participants (35 men, 45 women, 58.7 ± 15.5 years, 1.66 ± 0.08 m, 69.3 ± 13.4 kg) and 106 participants with end-stage unilateral hip OA (51 men, 55 women, 66.9 ± 9.4 years, 1.64 ± 0.08 m, 77.8 ± 17.1 kg) were recruited on a voluntary basis between 2011 and 2016 in the Dijon University Hospital (France). Hip OA was identified using the American College of Rheumatology Criteria18 including radiological assessment. Exclusion criteria for hip OA participants were OA flare, painful ankle, knee or foot disorder, acute or chronic back pain, Parkinson’s disease, neuromuscular disorders, uncontrolled diabetes, cardiac or respiratory failure or any major cause of inability to perform CGA. The present protocol was developed in compliance with the Declaration of Helsinki and the Good Clinical Practice (ICH Harmonised Tripartite Guideline, 1996). It was approved by the local ethic committee (CPP Est I, Dijon, France) and all participants signed an informed written consent form prior to inclusion. The clinical trial was referenced on ClinicalTrials.gov (NCT01907503).
Procedure
For each healthy participant, the entire data collection was acquired in a single session with the Nexus software (Vicon, UK). For participants with hip OA the entire data collection was acquired in two sessions (M0 - from 30 to 1 days before surgery and M6 6/7 months after surgery) with the same software. Each session lasted approximately 2 hours. All the sessions were managed by the same experienced operators (DL and PO). The following procedure was adopted:
-
1.
Consent information to the participant: An investigator of the study introduced the laboratory, outlined the hypothesis of the study to establish the database, and explained the procedure of the study and how to conduct the session, including the material used.
-
2.
Medical interview: an interview allowed collecting information at this stage about participant’s health status. This interview aims to gather demographics (age, sex, height, weight, Body Mass Index) and imaging outcomes (including OA side and Kellgren and Lawrence grade imaging score) and to screen the patients for other potential diseases which could effect gait in accordance with the inclusion/exclusion criteria. These data are available in the metadata file on figshare19.
-
3.
Calibration of the systems: this calibration was performed following the instructions available in the manufacturer’s documentation, including the definition of the inertial coordinate system, the dynamic calibration of the cameras, and the zeroing of forceplates.
-
4.
Preparation of the participant: the participant was asked to change clothes to tight-fitting clothes or underwear, including removing shoes and socks as the acquisition was barefoot, and to tie up their hair if necessary. The operator also collected participants’ anthropometric information19. All participants were equipped with reflective cutaneous markers positioned following the Plug-In-Gait model20,21 detailed in Fig. 1 and Table 4. Before walking, each markerset was calibrated for each patient with a static recording described below.
Fig. 1 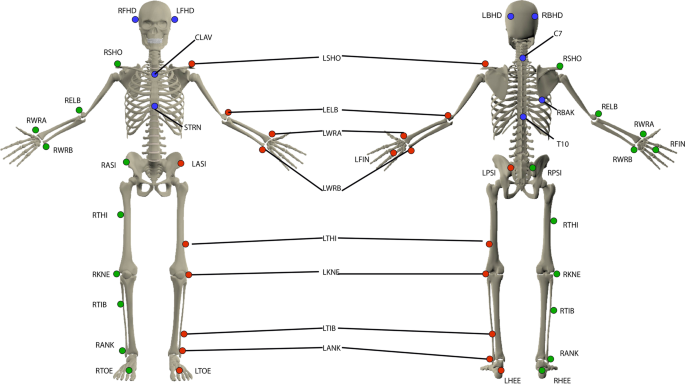
Reflective cutaneous markers placed by anatomical palpation on the participants. All markers have been illustrated for the left side (red markers), right side markers (green markers) and axial markers (blue markers). The anatomical description and full name of each marker are given in Table 4.
-
5.
Calibration file (Static record): The participant was standing upright in anatomical position, palms facing forward, the gaze close on a picture 3 m in front of them. Three seconds without any movement were recorded. The record was checked by the operator. A new standing trial was performed if any marker was missing or misplaced regarding the PlugIn Gait guidelines. This file is named Calibration in the dataset and included in each volunteer folder.
-
6.
Walking trials: Eight optoelectronic cameras (Vicon MXT40, Vicon, UK) sampled at 100 Hz were used. Two forceplates sampled at 1000 Hz (OR6-5, AMTI, USA) were used to record 3D ground reaction force and moment. These forceplates were embedded in the middle of the walkway travelled during the overground walking trials. All these systems were synchronized using the Vicon Giganet hardware (Vicon, UK). The participant was asked to walk back and forth on a 6-m straight level walkway. The instruction given was “to walk as naturally as possible, looking forward”. No directive was given about the forceplates to avoid a conscious adaptation of the walk. A minimum of 10 trials were recorded for each condition. All trials were rapidly verified by the operator.
-
7.
Session ending: All markers were removed. Additional explanations about the records were given to the participants while showing some videos and 3D animations.

Volunteers’ metadata
A complete list of volunteers’ metadata is available19:
-
ID of volunteers
-
Demographic parameters (age, sex, height, weight, Body Mass Index)
-
Anthropometric parameters related to the Plugin Gait markerset
-
Clinical parameters for OA patient: OA side, Kellgren and Lawrence grade
During each gait analysis, a video-recording (Bastler camera, 300 Mpixels, 50 Hz) was made on the frontal and sagital plane of the patients. Two experienced physicians visually classify the disturbances type on video recording of patients during the gait analysis. They had to classify disturbances in 5 categories:
-
Duchenne, lateral bending of the trunk and the pelvis in the stance side (D3)
-
Trendelenburg, lateral inclination of the shoulder on the stance side with an opposite inclination of the pelvis (D1).
-
Avoidance, slight decrease of the stance phase on the hip OA side (D2).
-
No disturbance, no marked asymmetry of the gait (D0)
-
Not done, in case of absence of video-recordings, unsolvable disagreement between the physicians (D4)
Disagreement during the classification was attempted to be solved with a consensus meeting, resulting in one classification per patients.
All video files are available from figshare (For HOA patients22 and for HEA volunteers23). Video was compressed with ffdshow codec and was recorded with avi extension. Such video file could be freely read with VideoLan software (https://www.videolan.org/). However, video files in which the patients or any other person were identifiable (recognizable face) are not made freely available.
Data processing
Labelling of the marker trajectories was performed in the Vicon Nexus software (Nexus 2.10, Vicon, UK). These trajectories were interpolated using the Woltring spline algorithm24 and smoothed by a 4th-order lowpass Butterworth filter with a 10 Hz cut-off frequency. Ground reaction forces and moments were smoothed using a 2nd-order lowpass Butterworth filter with a 50 Hz cut-off frequency. Below a threshold of 5 N defined on the vertical ground reaction force, all of these forces and moments were set to zero. Gait cycle events (i.e. foot strike and foot off) were determined using a previously defined kinematic-based algorithm25. Briefly, this algorithm consists in identifying changes from positive to negative of the antero-posterior velocity vector of a heel marker to detect foot strikes, and changes from negative to positive of the antero-posterior velocity vector of a toe marker to detect foot offs. Joint kinematics were then computed following the Conventional Gait Model (also called Plug-In-Gait model)20,21 using the Vicon Nexus software (Nexus 2.10, Vicon, UK). This approach first computes segment kinematics (Table 5) then joint kinematics (Table 1), as well as the position of the body center of mass (CoM) and ground reaction forces (GRF) normalized by the bodyweight (Table 2). However, we prefer to alert potential user about the calculation of angular values to other planes than sagittal. Indeed, the PluginGait markerset could suffer from a low robustness particularly in the frontal and transverse plane. Hence, please use the computed data carefully especially for hip and knee joints. Finally, they were stored in a new c3d file using the Biomechanics ToolKit (BTK). These final c3d files are the ones reported in the present dataset.
Calculation of joint centres
The joint centres have been calculated automatically using the PluginGait pipeline available on Nexus Vicon software. We describe briefly in the following section the calculation of the lower limb (Hip, Knee and Ankle) centers. For full details on the full body joints centers, please refer to https://docs.vicon.com/display/Nexus212/Lower+body+kinematics. calculation of the joint center rely extensively on the chord function. Three points are used to define a plane. One of these points is assumed to be a previously calculated joint center, and a second is assumed to be a real marker, at some known, perpendicular distance (the joint center offset) from the required joint center https://docs.vicon.com/download/attachments/133828952/Chord.png.
Hip joint centres
The Newington - Gage model is used to define the positions of the hip joint centers in the pelvis segment. A special vector in the pelvic coordinate system defines the hip joint centre using pelvis size and leg length as scaling factors. The InterAsis distance is calculated as the mean distance between the LASI and RASI markers. The Asis to Trocanter distances are calculated from the left and right leg lengths using the formula AsisTrocDist = 0.1288 * LegLength − 48.56. This is done independently for each leg. The offset vectors for the two hip joint centers (LHJC and RHJC) are calculated as follows:
where theta is taken as 0.5 radians, and beta as 0.314 radians. For the right joint centre, the Y offset is negated (since Y is in the lateral direction for the pelvis embedded coordinate system). The value C is then calculated from the mean leg length:
Knee and ankle joint centres
The centres are calculated using a modified chord function from the global position of hip joint centres, the THI or TIB markers and the KNE or ANK markers. Centres are found such that the KNE or ANK marker is at the mid anthropometric measured distance from the center, in a direction perpendicular to the line from the hip joint center (for the knee) to knee joint centre or perpendicular to the line from the knee joint center (for the ankle) to ankle joint centre.
Arff files dataset
Processed data (C3D) were then imported and concatenated into Matlab (R2016a, The MathWorks, USA) using the Biomechanics ToolKit26 (Tables 1, 2, 4, 5 report all exported data). Each trial of each patient was cropped in gait cycles and resampled at 101 points. One file was finally generated for each marker trajectory, segment kinematics, joint kinematics and ground reaction force, containing all data for each gait cycle of each participant. Each file contained a header composed of T0-T100 percentage of the gait cycle, volunteer ID, side of the Osteoarthritis limb (only for patients), trial number and cycle number (numbered by trial) followed by all the parameter values: related timeframe (to keep a time frame for each recording) or variations along an axis (i.e. X, Y, Z) (Table 3). Data of asymptomatic participants, as well as data of M0 and M6 sessions of hip OA participants were exported in three different folders. Each of these folders was composed of folders for Markerset data, Joints angles data, Plugin Gait Bones data, CoM and normalized GRF data. We choose to provide the dataset both in C3D and ARFF file format in order (i) to facilitate the benchmarking of algortihms into the weka software for example; (ii) to reach different scientific specialties with dedicated files ready to be analysed. Thus, we expect to disseminate widely this dataset.
Data Records
C3D files
All data records are available from figshare (For Hip OA volunteers (HOA)22 and for Healthy volunteers (HEA)23). They are all stored in c3d file format (https://www.c3d.org). This file format is a public binary file format supported by all motion capture system manufacturers and biomechanics software programs. It is commonly used to store, for a single trial, synchronized 3D markers coordinates and analog data as well as a set of metadata (e.g. measurement units, custom parameters specific to the manufacturer software application). Trial files are referenced in our dataset in hierarchical folders VLT/ID/Mx/Trial Type/GaiTrialNum with:
-
VLT (Folder): defining either HEA or HOA
-
ID (Folder): Unique identifier for the volunteer
-
Mx (Folder): the session (single one M0 for HEA), either M0 (prior the surgery) or M6 (after the surgery) for HOA
-
Trial Type (Folder): Static record session (Calibration), or walking session (Gait)
-
GaiTrialNum (File): Either 3D file (C3D) or Video files (AVI). Trials were numbered consecutively (number at the end of the filename)
In those files, all data were merged by subject and composed by trajectories data (see Tables 1, 2, 4, 5), analog data (see Table 3) and metadata of the volunteer (identical to19).
Weka files
All data records are available from figshare27,28. They are all stored in arff file format (https://waikato.github.io/weka-wiki/downloading_weka/). This file format is a public text file format. Trial files are referenced in our dataset as VLT_Mx_DATA_A.arff,organized by folders related to angles, markers, plugin gait bones and CoM and GRF data, with:
-
VLT: defining either the Healthy (HEA) or the Hip OA volunteers (HOA)
-
Mx: the session (single one M0 for HEA), either M0 (prior the surgery) or M6 (after the surgery) for HOA
-
DATA: the kind of data: markers; plugin gait bones; angles; CoM and GRF, extracted from plugin gait data (see Tables 1, 2, 4, 5 for details about the data)
-
A: the name of the axis, X, Y, Z or time.
Technical Validation
Calibration of the optoelectronic system
As detailed in the procedure (see Methods), the optoelectronic system was calibrated before each session following the instructions available in the manufacturer’s documentation. In all calibration files, residuals (i.e. average of the different residuals of the 2D marker rays that belongs to the same 3D point) were below 0.20 (Arbitrary Units of Vicon), and the standard deviation of the reconstructed wand (i.e. calibration tool) length remained below 1.5 mm (less than 1% of the wand length).
3D trajectories of cutaneous reflective markers
In all trial files, the 3D trajectories of cutaneous reflective markers were fully reconstructed (i.e. 0% of gap in the trajectories).
3D joint angles
In a previous study our results revealed that our system has a precision less than 1 degree to quantify angles3.
Usage Notes
C3D files
The recorded data are stored in c3d file format (https://www.c3d.org) and can easily be read using c3d toolboxes such as BTK (http://biomechanical-toolkit.github.io/)26. The software Mokka is a convenient tool for 3D visualisation (http://biomechanical-toolkit.github.io/mokka/index.html). Anthropometric and demographic parameters of each participant are stored in the metadata of the related c3d files. Based on the markerset used in this study, joint kinematics and dynamics can be computed using the 3D Kinematics and Inverse Dynamics toolbox proposed by Dumas and freely available on the MathWorks File Exchange (https://nl.mathworks.com/matlabcentral/fileexchange/58021-3d-kinematics-and-inverse-dynamics). To compute de novo the joints angles from the trajectories data, the plugin gait toolbox for matlab is available the Vicon website in the Advanced Gait Workflow (https://www.vicon.com/software/models-and-scripts/nexus-advanced-gait-workflow/?section=downloads.
Weka Files
The data are stored in weka file format (arff files) and can easiliy be read using weka workbench which is freely available on the weka website (https://waikato.github.io/weka-wiki/downloading_weka/) or toolbox for matlab on the Matlab File Exchange (https://fr.mathworks.com/matlabcentral/fileexchange/21204-matlab-weka-interface). Anthropometric and demographic parameters of each participant are stored in the metadata of the related excel files on figshare.
Code availability
See Usage notes part for information on code availability to compute or process the shared files.
References
Armand, S., Moissenet, F., de Coulon, G. & Bonnefoy-Mazure, A. Identifying and understanding gait deviations: critical review and perspectives. Movement & Sport Sciences - Science & Motricité 77–88, https://doi.org/10.1051/sm/2017016 (2017).
Foucher, K. C., Hurwitz, D. E. & Wimmer, M. A. Preoperative gait adaptations persist one year after surgery in clinically well-functioning total hip replacement patients. Journal of Biomechanics 40, 3432–3437, https://doi.org/10.1016/j.jbiomech.2007.05.020 (2007).
Laroche, D. et al. Test-retest reliability of 3D kinematic gait variables in hip osteoarthritis patients. Osteoarthritis and Cartilage 19, 194–199, https://doi.org/10.1016/j.joca.2010.10.024 (2011).
Longworth, J. A., Chlosta, S. & Foucher, K. C. Inter-joint coordination of kinematics and kinetics before and after total hip arthroplasty compared to asymptomatic subjects. Journal of Biomechanics 72, 180–186, https://doi.org/10.1016/j.jbiomech.2018.03.015 (2018).
Ornetti, P. et al. Three-dimensional kinematics of the lower limbs in hip osteoarthritis during walking. Journal of Back and Musculoskeletal Rehabilitation 24, 201–208, https://doi.org/10.3233/BMR-2011-0295 (2011).
Ornetti, P. et al. Gait analysis as a quantifiable outcome measure in hip or knee osteoarthritis: A systematic review. Joint Bone Spine 77, 421–425, https://doi.org/10.1016/j.jbspin.2009.12.009 (2010).
Moissenet, F. et al. Is the Pelvis-Thorax Coordination a Valuable Outcome Instrument to Assess Patients With Hip Osteoarthritis? Frontiers in Bioengineering and Biotechnology 7, https://doi.org/10.3389/fbioe.2019.00457 (2020).
Dotte, P. Les boiteries de hanche et les signes dits “de Duchenne de Boulogne” ou “de Trendelenburg”. Ann.Kinésithér. 5 (1978).
Hunter, D. J. & Bierma-Zeinstra, S. Osteoarthritis. The Lancet 393, 1745–1759, https://doi.org/10.1016/S0140-6736(19)30417-9 (2019).
Edmunds, C. T. & Boscainos, P. J. Effect of surgical approach for total hip replacement on hip function using Harris Hip scores and Trendelenburg’s test. A retrospective analysis. Surgeon 9, 124–129, https://doi.org/10.1016/j.surge.2010.08.014 (2011).
van den Akker-Scheek, I. et al. Recovery of Gait After Short-Stay Total Hip Arthroplasty. Archives of Physical Medicine and Rehabilitation 88, 361–367, https://doi.org/10.1016/j.apmr.2006.11.026 (2007).
Ibara, T. et al. Coordination Pattern of the Thigh, Pelvic, and Lumbar Movements during the Gait of Patients with Hip Osteoarthritis. Journal of Healthcare Engineering 2020, https://doi.org/10.1155/2020/9545825 (2020).
Meyer, C. A. G. et al. Biomechanical gait features associated with hip osteoarthritis: Towards a better definition of clinical hallmarks: HIP OSTEOARTHRITIS-RELATED GAIT FEATURES. Journal of Orthopaedic Research 33, 1498–1507, https://doi.org/10.1002/jor.22924 (2015).
Astephen, J. L., Deluzio, K. J., Caldwell, G. E., Dunbar, M. J. & Hubley-Kozey, C. L. Gait and neuromuscular pattern changes are associated with differences in knee osteoarthritis severity levels. Journal of Biomechanics 41, 868–876, https://doi.org/10.1016/j.jbiomech.2007.10.016 (2008).
Laroche, D. et al. A classification study of kinematic gait trajectories in hip osteoarthritis. Computers in Biology and Medicine 55, 42–48, https://doi.org/10.1016/j.compbiomed.2014.09.012 (2014).
Kwon, S. B. et al. A machine learning-based diagnostic model associated with knee osteoarthritis severity. Scientific Reports 10, 1–8, https://doi.org/10.1038/s41598-020-72941-4 (2020).
Pierson, E., Cutler, D. M., Leskovec, J., Mullainathan, S. & Obermeyer, Z. An algorithmic approach to reducing unexplained pain disparities in underserved populations. Nature Medicine 27, 136–140, https://doi.org/10.1038/s41591-020-01192-7 (2021).
Altman, R. et al. The American College of Rheumatology criteria for the classification and reporting of osteoarthritis of the hip. Arthritis Rheum 34, 505–14 (1991).
Laroche, D. Characteristics of volunteers. figshare https://doi.org/10.6084/m9.figshare.13655975 (2021).
Davis, I., Ounpuu, S., Tyburski, D. & Gage, J. A gait analysis data collection and reduction technique. Human Movement Science 10, 575–587, https://doi.org/10.1016/0167-9457(91)90046-z (1991).
Baker, R., Leboeuf, F., Reay, J. & Sangeux, M. The Conventional Gait Model - Success and Limitations. In Handbook of Human Motion, 1–19 (Springer International Publishing, Cham, 2017).
Laroche, D. Dataset of gait analysis data of hip osteoarthritis patients before and 6 month after arthroplasty and asymptomatic volunteers - OA Patients. figshare https://doi.org/10.6084/m9.figshare.14420645 (2021).
Laroche, D. Dataset of gait analysis data of hip osteoarthritis patients before and 6 month after arthroplasty and asymptomatic volunteers - Healthy Subjects. figshare https://doi.org/10.6084/m9.figshare.14420756 (2021).
Woltring, H. J. A Fortran package for generalized, cross-validatory spline smoothing and differentiation. Advances in Engineering Software (1978) 8, 104–113, https://doi.org/10.1016/0141-1195(86)90098-7 (1986).
Zeni, J., Richards, J. & Higginson, J. Two simple methods for determining gait events during treadmill and overground walking using kinematic data. Gait & Posture 27, 710–714, https://doi.org/10.1016/j.gaitpost.2007.07.007 (2008).
Barre, A. & Armand, S. Biomechanical ToolKit: Open-source framework to visualize and process biomechanical data. Computer Methods and Programs in Biomedicine 114, 80–87, https://doi.org/10.1016/j.cmpb.2014.01.012 (2014).
Laroche, D. Dataset from gait analysis data of hip osteoarthritis patients before and 6 month after arthroplasty and asymptomatic volunteers - Healthy Subjects. FigShare https://doi.org/10.6084/m9.figshare.15022827 (2021).
Laroche, D. Dataset of gait analysis data of hip osteoarthritis patients before and 6 month after arthroplasty and asymptomatic volunteers - HOA Patients. FigShare https://doi.org/10.6084/m9.figshare.13656233 (2021).
Acknowledgements
The authors thank all the participants of this study, all the research department staff of the Dijon University Hospital and the conseil régional de Bourgogne Franche Comté for the funding. We are also grateful thank to Celine Pago for its helpful comments during the redaction of the manuscript.
Author information
Authors and Affiliations
Contributions
J.F.M. and P.O. conceived the experiment(s), D.L. and P.O. conducted the experiment(s), D.L., M.G., A.G., B.O. and A.B. analyzed and produced the data andresults, F.M. provided material to build the dataset and providing description on the data and metadata. A.B. and D.L. first drafted the manuscript. M.G., P.O. and F.M. revised the manuscript to bring important intellectual content. All authors reviewed the manuscript. P.M. revised the manuscript and provides details that significantly improve the revised version.
Corresponding author
Ethics declarations
Competing interests
The authors declare no competing interests.
Additional information
Publisher’s note Springer Nature remains neutral with regard to jurisdictional claims in published maps and institutional affiliations.
Rights and permissions
Open Access This article is licensed under a Creative Commons Attribution 4.0 International License, which permits use, sharing, adaptation, distribution and reproduction in any medium or format, as long as you give appropriate credit to the original author(s) and the source, provide a link to the Creative Commons license, and indicate if changes were made. The images or other third party material in this article are included in the article’s Creative Commons license, unless indicated otherwise in a credit line to the material. If material is not included in the article’s Creative Commons license and your intended use is not permitted by statutory regulation or exceeds the permitted use, you will need to obtain permission directly from the copyright holder. To view a copy of this license, visit http://creativecommons.org/licenses/by/4.0/.
About this article

Cite this article
Bertaux, A., Gueugnon, M., Moissenet, F. et al. Gait analysis dataset of healthy volunteers and patients before and 6 months after total hip arthroplasty. Sci Data 9, 399 (2022). https://doi.org/10.1038/s41597-022-01483-3
Received:
Accepted:
Published:
DOI: https://doi.org/10.1038/s41597-022-01483-3
This article is cited by
-
Motion acquisition of gait characteristics one week after total hip arthroplasty: a factor analysis
Archives of Orthopaedic and Trauma Surgery (2024)
-
A full-body motion capture gait dataset of 138 able-bodied adults across the life span and 50 stroke survivors
Scientific Data (2023)
-
NONAN GaitPrint: An IMU gait database of healthy young adults
Scientific Data (2023)
