
Abstract
As recreational use of cannabis is being decriminalized in many places and medical use widely sanctioned, there are growing concerns about increases in cannabis use disorder (CanUD), which is associated with numerous medical comorbidities. Here we performed a genome-wide association study of CanUD in the Million Veteran Program (MVP), followed by meta-analysis in 1,054,365 individuals (ncases = 64,314) from four broad ancestries designated by the reference panel used for assignment (European n = 886,025, African n = 123,208, admixed American n = 38,289 and East Asian n = 6,843). Population-specific methods were applied to calculate single nucleotide polymorphism-based heritability within each ancestry. Statistically significant single nucleotide polymorphism-based heritability for CanUD was observed in all but the smallest population (East Asian). We discovered genome-wide significant loci unique to each ancestry: 22 in European, 2 each in African and East Asian, and 1 in admixed American ancestries. A genetically informed causal relationship analysis indicated a possible effect of genetic liability for CanUD on lung cancer risk, suggesting potential unanticipated future medical and psychiatric public health consequences that require further study to disentangle from other known risk factors such as cigarette smoking.
Main
Cannabis is a psychoactive substance with a long history of use and dependence. Recently within the United States, 37 states have approved what is termed medical cannabis use, and 19 states, 2 territories and the District of Columbia allow possession of cannabis for recreational purposes. In Europe, only Malta has fully legalized recreational cannabis, although many other countries have decriminalized possession of small amounts of cannabis and have enabled medical allowances. It was recently legalized in Thailand but remains prohibited in many parts of Asia, the Middle East and South America. The status in many of these places may be subject to change in the near future. More than a third of individuals who use cannabis develop cannabis use disorders (CanUD), and evidence regarding the impact of legalization on escalating use and use disorders is mixed1,2. Substantial negative health outcomes associated with chronic cannabis use include various cancers associated with inhaling combustion products3, declines in cognitive capacity and motivation and increased schizophrenia (SCZ) risk4,5. Individual and societal complications that result from CanUD include decreased productivity and accidents related to intoxication6. The full range of risks and negative outcomes associated with cannabis use and CanUD may not be appreciated widely. Considering the gradually increasing permissiveness surrounding its use, understanding various sources of risk that influence CanUD is both necessary and timely.
In this Article, we combined genome-wide genotype data from the Million Veteran Program (MVP) with expanded samples from iPSYCH27,8 and Mass General Brigham (MGB) BioBank9 and meta-analyzed these with the Psychiatric Genomics Consortium (PGC)/deCODE/iPSYCH1 study7,10. MVP, one of the largest biobanks in the world11, has enabled a substantial increase in power for genomic discovery by doubling the number of cases of European (EUR) ancestry available. By increasing sample numbers, we substantially increased the number of discovered loci and confirmed previous findings7,10. We also leveraged the ancestral diversity of the MVP to expand analyses of African ancestry individuals (AFR) and conducted genome-wide association studies (GWAS) analyses in Admixed American (AMR) and East Asian (EAS) ancestries. Linkage disequilibrium (LD) score regression (LDSC) can quantify variance explained by genetics and identify overlap between traits. This method is sufficient for EUR ancestries but not appropriate for some non-European and admixed ancestries. To solve this problem, we used cohort-derived covariate LDSC12 to calculate single nucleotide polymorphism (SNP)-based heritability in these populations, finding similar results among all ancestries. We conducted a transcriptome-wide association study (TWAS), which leverages annotations based on variant associations to changes in gene expression, in adult and fetal brain tissue to identify significant expression quantitative trait loci (eQTLs), using stratified LDSC to show enriched SNP-based heritability in fetal but not adult cortex. We also conducted Mendelian randomization (MR) analyses—an approach that uses genetic variations identified by GWAS as instruments to obtain an unbiased estimate of the effect of a trait of interest (here, CanUD) on outcomes—to examine causal relationships with chronic pain, lung cancer, physical activity and SCZ. Finally, we performed genomic structural equation modeling (gSEM)—a multivariate method for analyzing GWAS summary statistics to examine joint genetic architecture of traits—to understand the genomic relationships between cannabis use traits and other psychiatric and substance use disorder (SUD) traits. This work builds upon a decade of progress in the field7,10,13,14,15,16,17,18.
Results
GWAS
We assembled a total sample of 886,025 EUR participants across five datasets (Table 1; 42,281 cases and 843,744 controls) for GWAS meta-analysis of CanUD and identified 22 independent genome-wide significant (GWS) loci in this population. In the AFR meta-analysis of 123,208 participants across three cohorts (19,065 cases and 104,143 controls), we identified two GWS loci. In a cohort of 38,289 participants assigned using the broad AMR ancestry references (which include individuals recruited from several Latin American populations) in the MVP cohort (2,774 cases and 35,515 controls) we found one GWS locus, and in EAS ancestry references we identified two GWS loci. The lead signal for EUR was near CHRNA2 (rs56372821, P = 7.3 × 10⁻¹⁴), which encodes cholinergic receptor nicotinic alpha 2 subunit, consistent with prior GWAS7,10; the lead SNP was identical to one prior study7. Findings for AFR include a SNP in an intron of SLC36A2 (rs573117193, P = 4.9 × 10⁻⁸), which encodes a pH-dependent proton-coupled amino acid transporter for glycine, alanine and proline. The lead SNP in AMR was rs9815757 (P = 4.4 × 10⁻⁸). The lead SNP in EAS (rs78561048, P = 6.7 × 10⁻⁹) is intronic to SEMA6D, which encodes semaphorin 6D (Fig. 1 and Table 2). Several variants showed concordant direction of effect across all four stratified ancestral groups. Five additional loci were discovered in the multi-ancestry analysis: rs7003100 (intergenic), rs7029483 (130 kb upstream of MTND2P8), rs2627197 (intronic to ENO4), rs34438449 (40 kb downstream of MIR5007) and rs147144681 (intronic to CHRNA3).
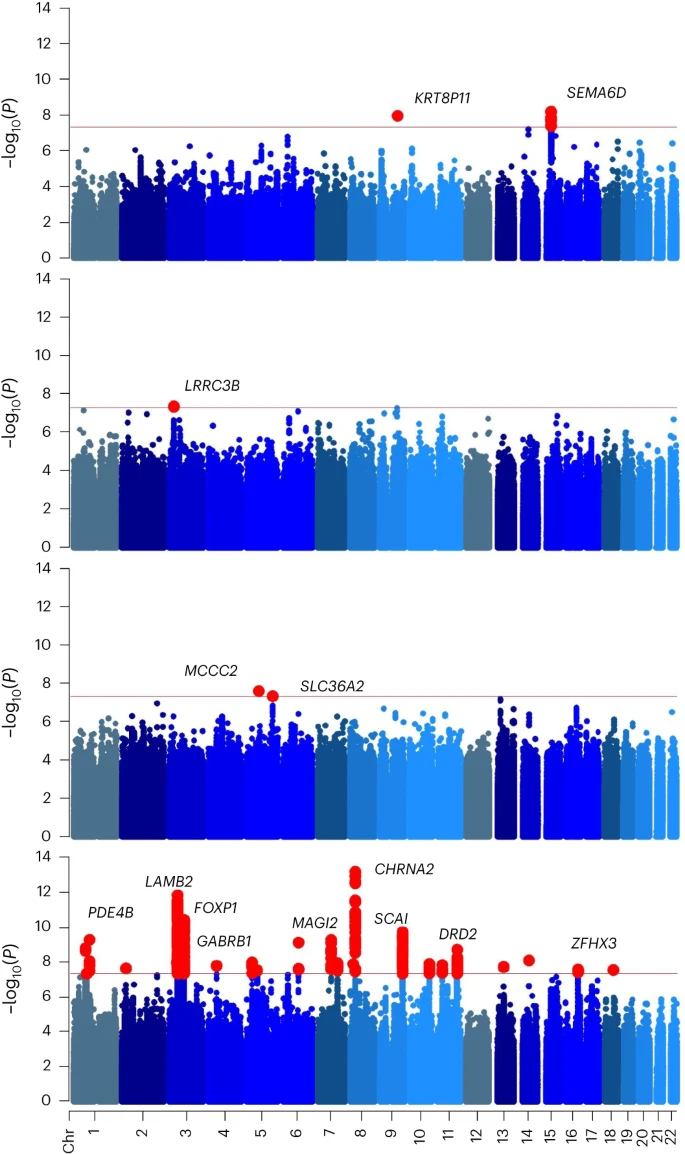
From top to bottom, 2 loci were identified in EAS ancestry, 1 for AMR, 2 for AFR, and 22 for EUR (red dots). Nearby genes are shown for orientation. P values were calculated with bidirectional Wald’s test. The field standard GWS threshold of P < 5 × 10⁻⁸ (horizontal red line) was used to determine significant associations. Other colors indicate different chromosomes. Chr, chromosome.
LDSC
Intergroup comparisons between EUR CanUD cohorts (MVP, PGC/deCODE, iPSYCH2) included in the meta-analysis yielded high genetic correlation, with rG ranging between 0.71 and 0.87. Comparative analysis of CanUD and cannabis use traits with a range of psychiatric and nonpsychiatric traits revealed striking differences, with CanUD showing far stronger overlap with pathological and negative traits (Fig. 2). The largest magnitude difference was in educational attainment, which showed a positive correlation with cannabis use but a negative correlation with CanUD. Covariate LDSC was used to calculate SNP-based heritability within each ancestral group. Significant SNP-based heritability was identified for the three larger ancestries: EUR h2 = 6.7% (standard error (s.e.) = 0.017), AFR h2 = 8.1% (s.e. = 0.013), and AMR h2 = 18.0% (s.e. = 0.042). There was high variance and a high point estimate in AMR. LDSC was used to calculate genetic correlation between cannabis use dependence cohorts included in this meta-analysis and also within MVP phenotype definitions (Supplementary Table 1). Genetic correlations were calculated for 1,335 traits (Fig. 2 and Supplementary Fig. 2). The strongest observed positive correlations were related to smoking initiation and alcohol dependence, while the strongest negative correlations were with ages of first intercourse and smoking cessation.
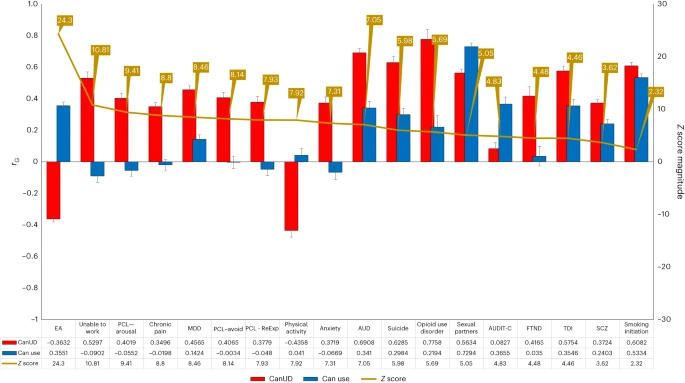
Comparison of genetic correlations between CanUD and cannabis use18. Left axis depicts the range of rG between 1 and −1. Red bars and blue bars depict the rG point estimate per trait for CanUD and cannabis use, respectively. Black error bars represent the standard error. Right axis displays the absolute magnitude of the Z statistic for the difference in rG between CanUD and cannabis use (gold line). SNP-based heritability for each comparison trait is included in the table. EA, educational attainment; ReExp, re-experience; AUDIT-C, Alcohol Use Disorders Identification Test-Consumption; TDI, Townsend deprivation index.
Cross-ancestry genetic correlation
Genetic correlations were calculated against available traits using POPCORN19 for CanUD in African ancestry and a selection of traits represented in Fig. 2. When compared to the same traits in EUR, there is no significant difference across ancestries (Supplementary Fig. 3).
Mendelian randomization
Multi-site chronic pain had a unidirectional causal effect on CanUD (inverse variance-weighted (IVW) β = 0.46, P = 2.90 × 10⁻⁵). There was a bidirectional causal effect of CanUD and SCZ (SCZ→CanUD IVW β = 0.17, P = 2.07 × 10⁻⁵, CanUD→SCZ IVW β = 0.17, P = 0.01). CanUD showed a unidirectional effect on lung cancer (IVW β = 0.18, P = 0.006) (Supplementary Fig. 1 and Supplementary Tables 5–13).
Conditional analysis
For EUR, we performed a multi-trait conditional and joint analysis (mtCOJO) of CanUD conditioned on two smoking traits from the GWAS and Sequencing Consortium of Alcohol and Nicotine use study to investigate potential confounding effects20. Two different datasets were used: smoking initiation and cigarettes per day. Individual runs were performed for the two cigarette smoking traits. A proportion of 18 of 22 original lead SNPs remained in the dataset following conditioning on smoking initiation (meaning they matched with variants in the conditioning data). For two out of four remaining SNPs, there were proxy SNPs in LD with each lead SNP showing GWS P values. Only rs545943750 and rs184064410 were excluded after conditioning due to missingness in the smoking data, leaving 20 of 22 lead loci from the CanUD GWAS available in the conditional analysis. All 20 remained GWS following conditioning. The results were similar with CanUD conditioning on cigarettes per day, with the same 20 lead loci remaining GWS after conditioning. Conditional analysis with smoking initiation or cigarettes per day did not substantially alter the magnitude of the lead CHRNA2 association (Pcond = 2.14 × 10⁻¹⁴). We used these summary statistics conditioned on cigarette smoking initiation to re-test the causal relationship between CanUD and lung cancer, and while the signal attenuated, it was still significant (IVW β = 0.2, P = 0.0025). The conditional analysis with cigarettes per day, however, removed the effect of CanUD on lung cancer (P = 0.79).
Multi-trait analysis of GWAS
Considering the high genetic correlation of CanUD with alcohol use disorder (AUD) and the Fagerström Test for Nicotine Dependence (FTND), we conducted an multi-trait analysis of GWAS (MTAG) analysis that identified 34 lead SNPs at 26 genomic risk loci, including four novel loci compared to the EUR meta-analysis, at P < 5 × 10⁻⁸ for CanUD (Supplementary Fig. 5 and Supplementary Table 14) when combined with AUD and FTND. The GWAS-equivalent sample size for CanUD was 200,762, augmenting the meta-analysis effective sample size of 161,053 by 20%. Ten genomic risk loci were significant (or in LD with significant variants) in both the GWAS and MTAG analyses. The remaining 16 significant variants were LD independent. The effect size of eight of the 26 significant SNPs in the MTAG analysis was significantly smaller than those obtained from the original GWAS (Supplementary Table 15), suggesting specificity to CanUD.
Transcriptome-wide association study
In TWAS analyses, 59 and 25 genes were detected (P < 2.5 × 10⁻⁶) using adult and fetal brain frontal cortex expression, respectively, with six genes in common (Fig. 3a). We tested these genes by permutation test, leaving 44 and 17 genes using adult and fetal models, with two genes in common (Fig. 3a). For the remaining genes within 1 Mb of one another, we applied gene-level probabilistic fine-mapping. In the end, we detected 36 and 15 genes using the adult and fetal models, which form 90% credible sets (with 90% estimated probability of containing the causal variant) that explain the corresponding genetic associations (Fig. 3a, b). These sets contained only one gene in common: DALR Anticodon Binding Domain Containing 3 (DALRD3) (Fig. 3a, b). The observed gene associations included four distinct GWAS loci: 3p21.31 (gene detected in adult and fetal brain cortex: DALRD3), 5q12.1 (fetal: ERCC8), 11q23.2 (adult: RP11-629G13.1) and 16q22.2 (adult: PHLPP2). Protein functions of these genes are described in the Discussion below. The remaining set of genes identifies 38 candidate novel genetic loci associated with CanUD, with potential underlying transcriptomic mechanisms in either adult or fetal brain cortex (Supplementary Table 3).
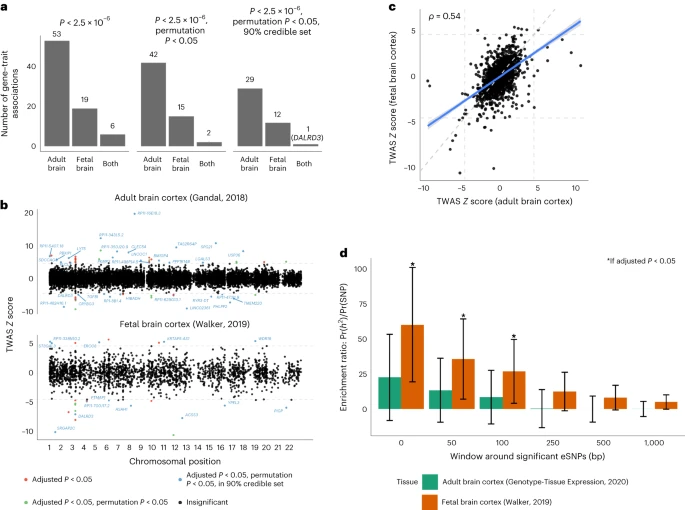
a, Number of TWAS gene–trait associations for adult and fetal brain frontal cortex, across significance thresholds. b, Miami plot of TWAS Z scores across analyses with adult (top) and fetal (bottom) brain frontal cortex. Genes are colored red if the gene passes transcriptome-wide significance, green if the gene additionally passes permutation testing and blue if the gene is estimated to be in the 90% credible set at the locus. All genes in blue are labeled. The horizontal line indicates threshold statistical significance following multiple testing correction. c, Scatterplot of standardized effect sizes (TWAS Z scores) across adult and fetal brain frontal cortex. A total of 10,722 genes were tested in adult tissue, while 2,293 genes were tested in fetal tissue. The dashed line indicates the expected relationship if no enrichment for adult or fetal brain. d, Enrichment ratio point estimate of proportion of SNP-based heritability explained by annotation and proportion of SNPs in annotation. Error bar shows a 95% Wald-type confidence interval. Bars marked with an asterisk indicate an enrichment ratio >1 at Benjamini–Hochberg adjusted P < 0.05.
Partitioned SNP-based heritability
Standardized TWAS effect sizes estimated using adult and fetal brain frontal cortex expression models showed moderate correlation (Spearman’s ρ = 0.54, P < 2.2 × 10⁻¹⁶; Fig. 3c). Accordingly, we next estimated the SNP-based heritability enrichment in adult and fetal brain cortex eQTL. Using LDSC, we estimated enrichment ratios for SNP-based heritability using different windows around expression SNPs for expression genes. We detected significant enrichments only for fetal brain frontal cortex expression SNPs at windows of 0 bp, 50 bp and 100 bp. In general, fetal brain frontal cortex eQTLs were far more enriched for CanUD trait heritability than adult brain cortex eQTLs (Fig. 3d).
gSEM
Using exploratory factor analysis (EFA), a four-factor model fit the data best, with the cumulative variance explained being 0.789, distributed relatively evenly across the four factors, with each accounting for between 22.7% and 29.2% of the overall variance explained (factor 1 of 0.23, factor 2 of 0.19, factor 3 of 0.18 and factor 4 of 0.18). Each of the four factors had high sums of square (SS) loadings (factor 1 SS of 3.5, factor 2 SS of 2.9, factor 3 SS of 2.8 and factor 4 SS of 2.7).
Using confirmatory factor analysis (CFA) to evaluate the four-factor model that allowed all factors to intercorrelate had a comparative fit index of 0.913, a standardized root mean square residual of 0.068, a chi-squared value of 1397.5 and an Akaike information criterion of 1483.5. Traits loading most strongly on factor 1 included ‘Unable to work’ (loading of 1.06 ± 0.04), Townsend deprivation index (loading of 0.56 ± 0.03), chronic pain (loading of 0.50 ± 0.04) and FTND (loading of 0.45 ± 0.07). Traits loading most strongly on factor 2 included number of sex partners (loading of 0.91 ± 0.02), cannabis use (loading of 0.70 ± 0.03) and initiation of regular smoking (loading of 0.58 ± 0.03). Psychiatric traits loaded most strongly on factor 3 and included major depressive disorder (MDD) (loading of 0.95 ± 0.02), post-traumatic stress disorder (PTSD) checklist score (PCL) total (loading of 0.88 ± 0.04), generalized anxiety disorder symptoms (loading of 0.86 ± 0.03), suicide attempt (loading of 0.59 ± 0.05) and SCZ (loading of 0.29 ± 0.02). SUD traits loaded most strongly on factor 4 and included CanUD (loading of 0.96 ± 0.03), opioid use disorder (loading of 0.85 ± 0.05) and AUD (loading of 0.81 ± 0.03). There were moderate correlations between factors 2 and 4 (r = 0.65), factors 1 and 3 (r = 0.64), factors 1 and 4 (r = 0.52) and factors 3 and 4 (r = 0.53). All correlations and loadings are summarized in Fig. 4.
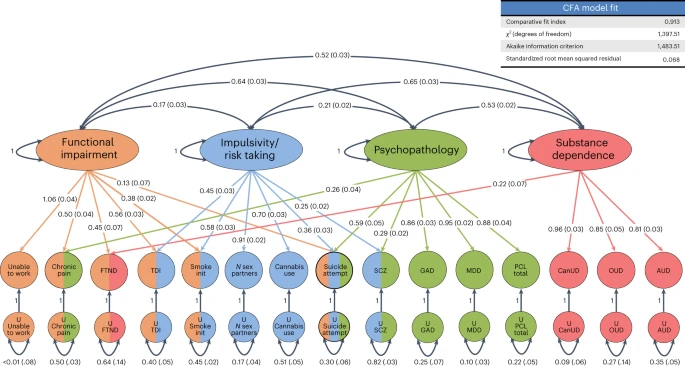
gSEM was used to cluster 14 traits correlated with CanUD. Exploratory and confirmatory factor analysis indicated four factors fit the data best. Factors fit mostly into categories that we designated as functional impairment (factor 1), impulsivity and risk taking (factor 2), psychopathology (factor 3) and substance dependence (factor 4). CanUD fit best (and strongly) in the substance dependence cluster. FTND fit into factors for functional impairment and substance dependence. Suicide attempts fit into functional impairment, impulsivity and risk taking, and psychopathology. Numbers outside the parenthesis are correlation coefficients between factors. Numbers inside parenthesis are stadard errors of means. Smoke init, initiation of regular smoking; GAD, generalized anxiety disorder; OUD, opioid use disorder.
Discussion
Recently, cannabis use has been legalized in various US states and elsewhere without fully examining the health consequences of individual or societal risks. An epidemiologic survey conducted by the National Survey on Drug Use and Health in the United States identified a past-year cannabis use prevalence of 17.5%, an increase from 11.0% in 2002, and 1.8% with CanUD, the same percentage recorded in 2002. Usage varies worldwide, with many regions of high prevalence21.
The findings we report here add to our understanding of CanUD biology on many levels. First, we greatly increased the available sample size for genomic analysis, mostly by incorporating MVP data, and identified multiple novel risk loci in four populations, improving on previous results in EUR by more than an order of magnitude and presenting the first genetic discoveries in the other populations studied. Using the GWAS data, we then showed overlapping genetic liability to other traits. Next, investigating how genetic variation underlying CanUD influences fetal brain gene expression, the brain in particular showed significant enrichment for SNP-based heritability. Essentially, SNPs that influence fetal brain gene expression explain a greater proportion of CanUD phenotypic variance than the overall GWAS association of all SNPs. We investigated the overlapping and shared underlying genetic architectures of several different traits and employed MR to demonstrate putative causal relationships between outcomes with substantial impact on human health, including an association with lung cancer risk. Cannabis is frequently consumed using methods involving inhaling combustion products, potentially exposing users to risks similar to those found in smoking other substances such as tobacco. Indeed, some of the shared genetic risk between CanUD and tobacco smoking may relate to propensity to smoke per se, independent of substance, a hypothesis that we currently lack the power to evaluate.
We identified 22 significant loci, most of them novel, for CanUD in EUR. We also replicated findings in CHRNA2 (meta P = 7.3 × 10⁻¹⁴, MVP only P = 1.1 × 10⁻⁵) and FOXP2 (meta P = 1.7 × 10⁻⁸, MVP only P = 2.0 × 10⁻³), with triple the effective sample size of the largest of those studies10, demonstrating once again the stability of GWAS findings as sufficient sample size and power to discover new loci are reached22,23. We discovered GWS loci in four ancestral groups: EUR, AFR, AMR and EAS. In AFR, two independent SNPs were associated on chromosome 5. The first (rs574008891) was within an intron of the gene that encodes methylcrotonyl-CoA carboxylase subunit 2 (MCCC2). The other significant locus (rs573117193) mapped to an intron in the solute carrier family 36 member 2 (SLC36A2) gene. These specific variants are absent in the other ancestries studied. For AMR, the one risk locus was rare (rs9815757, minor allele frequency (MAF) 0.1%) and mapped in an intergenic region downstream of leucine rich repeat containing 3B (LRRC3B). Finally, for EAS, one locus was associated with CanUD: rs78561048, near semaphorin 6D (SEMA6D). Follow-up analysis in larger samples is needed to assess the robustness of findings, particularly in AMR and EAS. Several variants showed concordant direction of effect across all four stratified ancestral groups (Table 1). For instance, rs10986600, significantly associated in EUR on chromosome 9, was nominally significant (P < 0.05) with same effect direction in AFR (0.04) and AMR (0.03) and significant in the multi-ancestry meta-analysis. This intronic variant of the protein phosphatase 6 catalytic subunit (PPP6C) is an eQTL for PPP6C, a gene linked to various cancers, including skin melanoma and lung squamous cell carcinoma. Multi-ancestry meta-analysis revealed an additional five loci not identified in the stratified analyses. Among them, the lead SNP on chromosome 15, rs147144681, which maps to an intron of the cholinergic receptor nicotinic alpha 3 subunit (CHRNA3) gene, is particularly noteworthy; as reported above, variation in CHRNA2 was among the first variants associated with CanUD and was replicated here. This suggests potential convergence involving the cholinergic system broadly and nicotinic receptors, specifically in the underlying etiology of CanUD. While nicotinic receptors are also associated with tobacco smoking-related traits24, the relative pattern of association for those traits is different from the observations for CanUD—for many smoking-related traits, a chromosome 15 nicotinic receptor cluster is associated with orders of magnitude greater support than other variants, including other nicotinic receptors; for CanUD, CHRNA2 is consistently the strongest association, also by orders of magnitude. We conducted conditional analysis for CHRNA2 and found the conditional P value remained robust following conditioning on smoking initiation20 (Pcond = 4.6 × 10⁻¹⁴). This replicates similar analyses performed by Demontis et al.7 and Johnson et al.10, which showed conditioning on smoking did not affect the CanUD association at this variant. Several other loci near cholinergic receptor subunit genes previously identified for smoking are not significant in our analysis of CanUD (CHRNA4, rs13036436, smoking P = 1.1 × 10⁻²⁹, CanUD P = 0.97; CHRNA5, rs667282, smoking P = 9.9 × 10⁻²⁵, CanUD P = 0.043). Conversely, the CHRNA3 variant we find associated with CanUD is not significant for smoking (rs147144681, smoking P = 0.0033, CanUD P = 3.3 × 10⁻⁸) (ref. 20).
Genetic correlations were calculated for 1,335 traits to identify genetic overlap with CanUD. Some traits with significant rG were tested for causal inference based on a combination of significant genetic correlation and a prior interest in phenotype (physical activity, multi-site chronic pain, Alzheimer’s disease and SCZ). We identified a bidirectional causal relationship between CanUD and SCZ. At the same time, the MR Egger analysis indicated this was not due to horizontal pleiotropy. This supports similar findings reported previously, confirming previous genetic–epidemiologic studies25 and verifying an important public health risk associated with CanUD. To highlight differences between cannabis use and CanUD, we compared the pattern of genetic correlations across 18 traits, which showed striking differences. CanUD was much more closely associated with psychopathology, recapitulating a general pattern seen with other comparisons of SUD and use traits26. For example, while we observed a substantial negative correlation between CanUD and educational attainment, cannabis use was associated with greater educational attainment. POPCORN was used to generate a cross-covariance score to allow for comparison of traits across ancestries using genetic correlations for EUR and AFR groups (Supplementary Fig. 3). We found a striking similarity for cross trait comparisons for both groups, indicating a similar underlying genomic architecture. This finding supports the possibility that some findings uncovered so far for EUR individuals, recruited in vastly greater numbers for genetic study, will provide some degree of generalizability across human populations.
Chronic pain may be a factor driving CanUD in some individuals, with significant unidirectional evidence for a causal effect of chronic pain27 on CanUD in the MR analysis. Cannabis use has been proposed as a treatment for chronic pain, and there are several clinical trials in progress28. This MR observation suggests that there may be merit in cannabis as a treatment for at least some kinds of pain. The small overall beneficial effect observed requires so many individuals to be treated that harmful effects (such as increased CanUD) also become a significant factor29. Our MR results suggesting that chronic pain has a causal influence on CanUD emphasize the need for follow-up investigations that address whether greater consideration should be given to the adverse effects, rather than just the therapeutic effects among individuals receiving cannabis-based medicines. A similar question arises with opioids, which although often prescribed for pain, can also cause great harm30: namely, what level of risk of CanUD is acceptable given cannabis’ potential to improve quality of life and reduce opioid exposure in chronic pain patients? Our results suggest that harms such as dependence and consequences, reflected in underlying genetics of the trait, may need to be weighed against the potential benefits of cannabis treatment for chronic pain. Future studies should consider this novel relationship to pain31 and clinical efficacy trials are underway.
Cigarette smoking substantially increases the risk of many forms of cancer, including lung cancer, through numerous well-studied mechanisms with established literature dating back more than 60 years32. The influence of cannabis on cancer risk is less well understood; it should be anticipated that these combustion products could have harmful pulmonary impacts—indeed, it would be surprising if smoking tobacco, but not smoking cannabis, increased cancer risk. MR yielded evidence for a unidirectional causal effect of CanUD on lung cancer. This result was robust to conditioning on data from the largest available smoking initiation GWAS but not conditioning on cigarettes per day, both traits that also have causal relationships with lung cancer but far more robust genetic instruments to evaluate this relationship. We do not currently have a way to assess genetic variation associated with the route of cannabis administration, but combustion is by far the most common method in the MVP and other cohorts studied. Given the trend toward increased legalization and usage, this apparent causal association needs to be monitored as it may have profound and underappreciated public health consequences. As the causal relationship with CanUD was not robust to conditioning on cigarettes per day, one probable explanation may be that there is horizontal pleiotropy between these traits in their influence on lung cancer.
Four GWS loci overlapped with TWAS prioritization from the EUR meta-analysis, using eQTL integration from samples of adult33 and fetal34 cortical tissue. These were DALRD3 (both fetal and adult), ERCC8 (fetal), RP11-629G13.1 (adult) and PHLPP2 (adult). The DALRD3 protein product, a DALR anticodon binding domain, forms a complex with the product of METTL2B. Nonsense mutations in DALRD3 are associated with developmental delay and early-onset epileptic encephalopathy35. ERCC8 encodes the excision repair 8, CSA ubiquitin complex subunit, which plays a role in DNA repair and is associated with the developmental disorder Cockayne syndrome36, as well as breast, esophageal and other cancers37,38. RP11-629G13.1 is a long noncoding RNA associated with downregulation of NCAM1 gene expression in multiple myeloma patients39. Significant partitioned SNP-based heritability was observed in fetal but not in the adult cortex, with 4.36% of trait SNP-based heritability explained by 0.12% of the total SNPs near fetal frontal cortex eQTLs. Only 1.77% of CanUD SNP-based heritability was explained using 0.13% of the total SNPs near adult cortex eQTLs. Fetal development may play a role in SUD susceptibility40, and substance use can influence fetal development during pregnancy and health outcomes during childhood41. Although exogenous exposure to cannabis may not occur until years or decades after birth, enriched fetal SNP-based heritability in this study argues a possible role for genetic effects on CanUD in the developing brain independent of exposure. SCZ risk is also modulated by risk factors during fetal development42 and genetic43 and environmental effects (including maternal food deprivation in the first trimester of pregnancy44). Temporal convergence of the initiation of genetic risk effects for both SCZ and CanUD, if validated experimentally, would provide insight into the genetic relationship between these disorders and could relate to a mechanism for the bidirectional risk relationship between cannabis use and SCZ.
gSEM was used to contextualize summary statistics from this project with those from other published GWAS studies. Exploratory and confirmatory factor analyses showed that four factors provide the best fit for the 14 correlated traits included in the analysis. Factors fit mostly into categories that relate to functional impairment (factor 1), impulsivity and risk taking (factor 2), psychopathology (factor 3) and substance dependence (factor 4). CanUD fit best (and strongly) in the substance dependence cluster (factor 4). FTND fit into factors for functional impairment and substance dependence. Suicide attempts fit into functional impairment, impulsivity/risk taking and psychopathology. This is consistent with research showing overlapping pathologies within addiction and shared genetic risk factors between them45.
This study has limitations. The use of electronic health records allows for a large sample of CanUD cases but limits the assessment of subdiagnostic cannabis use in controls. Although we accounted for subdiagnostic cannabis users by excluding them from controls when information was available, these are probably underreported. Future studies of individuals with ascertained cannabis use who do not meet criteria for CanUD would provide more insight into the specific genetic liability to dependence. As the traits of interest were gathered from previously published reports or queries of electronic health records (EHRs) for diagnostic codes, we did not have information regarding tetrahydrocannabinol (THC) blood levels or information on the potency of cannabis at each exposure. If these data were available, study of effects on cannabis potency on dependence and comorbidities would be of great interest. We identified a causal relationship between multi-site chronic pain and CanUD. As pain is a complex trait and different type of pain may interact differently with CanUD, our finding for multi-site chronic pain is not sufficient to draw conclusions about the interaction between CanUD and specific kinds of pain or pain syndromes. Our definition of CanUD was based on any report of abuse or dependence either as an inpatient or outpatient. Participants in this study span a period of changing legal status and increasing use of marijuana, a major secular trend. Given the age of the participants (Supplementary Table 16) and expected time from initial exposure to the development of a use disorder, nearly all participants would have been exposed to cannabis before legalization. The TWAS study did not include ascertainment for CanUD in the individuals who donated brain tissue used for analysis. We discovered GWS loci in ancestral groups, but AFR, AMR and EAS sample sizes were small compared to EUR. We did not perform MR or TWAS analyses in non-European samples because available GWAS and eQTL datasets are still limited in non-European ancestry populations, and cross-ancestry analyses carry risk of biases due to differences in the underlying LD structure between ancestries. More studies are needed of individuals of diverse ancestries to replicate these findings, estimate their robustness and ensure that the benefits provided by these studies are available to all people.
This is the largest genetic study of CanUD so far, including data from multiple international cohorts in more than one million participants and comprising four ancestral groups. We replicate two prior GWS findings while identifying 25 novel loci, and we leverage these novel data to investigate genetic overlap with other traits. We identify a clear difference between cannabis use and CanUD, with genetic liability to CanUD being much more closely associated with psychopathology and disability. We found greater heritability enrichment in fetal than adult brain tissue, supporting an important role of development in laying the biological basis for CanUD. We used MR to assess causal relationships and found evidence of bidirectional causal effects between CanUD and SCZ and unidirectional effects of multi-site chronic pain on CanUD, and of CanUD on lung cancer. Finally, using gSEM, we found that CanUD loads on a latent factor with other substance dependence traits, consistent with clinical observation, genetic epidemiology and prior genetic studies of other SUD traits. In particular, we highlight the possible relationship revealed herein between CanUD and lung cancer risk. This study yields new insights into the genetic architecture of CanUD and how this risk interacts with traits crucial to public health and raises important concerns regarding the potential adverse consequences of the secular trend toward increased cannabis use consequent to legalization.
Methods
Inclusion and ethics statement
We included researchers from the iPSYCH biobank and the PGC, who played a role in study design. This research was not restricted or prohibited in the setting of any of the included researchers. All studies were approved by local instituational research boards and ethics review committees. MVP was approved by the Veterans Affairs central instituational research board. We do not believe our results will result in stigmatization, incrimination, discrimination or personal risk to participants.
Cohorts
We used data release version 4 of the MVP. Linked and de-identified EHRs were queried using the Veterans Affairs Informatics and Computing Infrastructure to identify individuals with International Classification of Disease (ICD) codes for cannabis dependence or cannabis abuse (together, CanUD) (Supplementary Tables 2 and 3). The range of diagnosis dates was between May 1992 and December 2019. Two classifications were investigated: (1) cases identified by at least two separate outpatient visits or any number of inpatient visits to a US Veterans Affairs (VA) medical center for CanUD and (2) cases identified by at least one inpatient or outpatient visit for CanUD. Genetic correlation analysis indicated that these traits were almost identical from a genetic perspective (rG = 0.99) and SNP-based heritability (h2) was not statistically different (definition 1, h2 = 0.075, s.e. 0.0053, z = 14.1; definition 2, h2 = 0.087, s.e. 0.0062, z = 14.0; Pdiff = 0.14), so case definition per the second classification was retained for further analysis (that is, at least one inpatient or outpatient visit). All individuals diagnosed under the first disease definition were also diagnosed under the second more inclusive definition. Controls were defined as individuals without any VA EHR ICD codes for cannabis dependence, cannabis abuse or cannabis use (cannabis use codes included in ICD-9: 305.29 and included in ICD-10: F12.90, F12.920, F12.921, F12.922, F12.929, F12.93, F12.950, F12.951, F12.959, F12.980, F12.988 and F12.99). The PGC cohort was as previously described and was made up of 16 cohorts with varying phenotype definitions and ascertainments10. A leave-one-out analysis was performed to remove the iPSYCH1 sample, leaving 18,370 cases and 304,838 controls for European and African ancestries in the remaining PGC/deCODE sumstats. An updated expanded iPSYCH2 cohort was then added via meta-analysis (4,733 cases and 95,657 controls, all EUR). We also included samples from MGB Biobank (456 cases and 24,088 controls, all EUR) and new data from the Yale–Penn cohort46 beyond the individuals already included in the PGC study (an additional 310 cases and 1,471 controls for EUR, and 271 cases and 666 controls for AFR). Table 1 gives numbers for each cohort.
MVP genotyping, imputation, quality control, and GWAS and meta-analysis
Genotyping and imputation of MVP participants has been described previously11. Briefly, a customized Affymetrix Axiom Array was used for genotyping. MVP genotype data for biallelic SNPs were imputed using Minimac4 and a reference panel from the African Genome Resources panel by the Sanger Institute. Indels and complex variants were imputed independently using the 1000 Genomes (1KG) phase 3 panel and merged in an approach similar to that employed by the UK Biobank. Designation of broad ancestries was based on genetic assignment with comparison to 1KG reference panels47.
MVP GWAS was conducted using logistic regression in PLINK 2.0 using the first ten positive controls, sex and age as covariates. Variants were excluded if call missingness in the best-guess genotype exceeded 20%. Alleles with MAF <0.1% were excluded in EUR, AFR and AMR. Alleles with MAF <1% were removed from EAS due to smaller sample size. The MVP data represented the largest and most diverse cohort with 22,260 cases and 423,587 controls (EUR), 14,946 cases and 97,580 controls (AFR), 2,774 cases and 35,515 controls (AMR) and 194 cases and 6,649 controls (EAS) (Table 1). GWAS meta-analyses in the PGC datasets of the deCODE and PGC samples were conducted as previously described, although a leave-one-out analysis was conducted to remove data from iPSYCH1 so that a larger cohort could be independently analyzed10. This leave-one-out PGC meta-analysis contained 14,522 EUR cases and 298,941 controls and 3,848 AFR cases with 5,897 controls. This study includes new genotypes from iPSYCH (referred to as iPSYCH2), and all iPSYCH data (iPSYCH1 + 2) has been reprocessed. Pre-imputation quality control and imputation were performed on genotypes from the full set of genotyped individuals for iPSYCH1 and iPSYCH2 separately, using standard procedures for GWAS data. The iPSYCH1 samples were genotyped in 23 genotyping waves and thus additional steps were taken to eliminate potential batch effects. Only variants present in more than 20 waves and with no significant association with wave status were retained. Imputation was done using the pre-phasing/imputation stepwise approach implemented in EAGLE v2.3.548 and Minimac49, using the Haplotype Reference Consortium50 panel v1.0. GWAS of 4,733 EUR cases and 95,657 controls and was done on a merged set of best-guess genotypes with MAF >0.01 and imputation info score >0.8 (in both iPSYCH1 and iPSYCH2) using logistic regression with appropriate covariates (age, sex, psychiatric diagnoses (attention deficit hyperactivity disorder, autism spectrum disorder, SCZ, bipolar disorder and MDD), first ten positive controls and iPSYCH cohort of origin). A new Yale–Penn tranche was analyzed using PLINK 1.9 in unrelated individuals not previously included in any other GWAS or meta-analysis. This contributed 310 cases and 1,471 controls (EUR) and 271 cases and 666 controls (AFR). Finally, MGH Partners BioBank51 contributed 456 cases and 24,088 controls (EUR).
EUR cohorts were combined in a GWAS meta-analysis (Table 1). For AFR, we performed meta-analysis between the MVP, PGC and Yale–Penn cohorts. For AMR and EAS, only MVP included data so no meta-analysis was possible within these ancestries. GWAS meta-analyses were conducted using inverse variance weighing in METAL52 for both EUR and AFR. For within-ancestry meta-analyses, there were 42,281 EUR cases with 843,744 controls, and 19,065 AFR cases with 104,143 controls. The multi-ancestry meta-analysis53 included 1,044,620 total participants of EUR, AFR, AMR and EAS ancestries. Sex-stratified analysis was conducted in the only cohort available individual GWAS for the analysis—the MVP (Supplementary Fig. 7).
LDSC and SNP-based heritability
LDSC was used to calculate SNP-based heritability on the liability scale, using a lifetime population prevalence54 of 2% and a sample prevalence of 5% for EUR, 13.2% for AFR, and 7.2% for AMR within the MVP55. We used the lifetime population prevalence reported in the PGC/deCODE/iPSYCH1 cannabis paper10 for comparability. Typically, calculating SNP-based heritability depends on reliable reference ancestry to account for nonindependence of some variance due to LD. This is easily done for EUR, but admixed non-European ancestries pose a statistical challenge. Covariate LDSC12 uses sample covariates such as those derived from principal components analysis (a dimension reduction technique that produces eigenvalues for each variant) carried out in the study sample to adjust LD scores to enable calculation of SNP heritability in each ancestry using sample-specific LD scores. LDSC as implemented by the Complex Traits Genomics Virtual Lab56 was used to estimate genetic correlations57 to identify common genetic architecture across all 1,335 traits available for comparison. Additionally, LDSC was used to compare genetic correlations between CanUD and cannabis use (from a previously published study18).
Cross-ancestry genetic correlation
POPCORN19 was used to generate cross-ancestry covariance scores using 1KG reference panels from EUR and AFR. This method was applied to calculate genetic correlations between the AFR CanUD generated in this study against traits from Fig. 2 that had available allele frequencies and n count.
Mendelian randomization
Several traits with significant genetic correlation with CanUD and high public health importance were selected for follow-up MR analysis in EUR ancestry datasets (‘type of physical activity in the last four weeks = none’, multi-site chronic pain, Alzheimer’s disease, SCZ and lung cancer). These traits were first tested for polygenic overlap with CanUD; one trait did not survive this step (Alzheimer’s disease), and the remaining three traits moved on to MR analysis. MR was conducted using the TwoSampleMR package in R Studio58. We conducted MR Egger analysis to test for the effect of horizontal pleiotropy.
Conditional analysis
mtCOJO was carried out to study possible confounding of smoking for CanUD. GWAS summary statistics for smoking initiation and cigarettes per day from the GWAS and Sequencing Consortium of Alcohol and Nicotine use Phase 2 study of EUR ancestry were used for smoking20. The CanUD (target trait) GWAS data were conditioned on smoking initiation and cigarettes per day (covariate traits) GWAS data individually using the Genome-wide Complex Trait Analysis mtCOJO utility59. Output summary statistics from conditioned CanUD was then used to re-test the MR relationship between CanUD and lung cancer.
Transcriptome-wide association study
Transcriptome-wide association studies (TWAS) and FUSION60 software were employed to use variant–gene expression associations to enrich GWAS variant findings for genes involved with CanUD. The TWAS models were trained using prior published evidence for gene expression from adult brain cortex33 (1,695 samples; 14,750 models) and fetal brain frontal cortex34 (201 samples; 3,784 genes), with each gene having estimated positive cis-heritability at nominal P < 0.01 and the corresponding predictive model achieving five-fold cross-validation R2 > 0.01 at a nominal P < 0.01. Using a weighted burden test60, we generated a Wald-type Z score for each gene–trait association, with transcriptome-wide significance defined at P < 2.5 × 10⁻⁶, the Bonferroni-corrected significance level across 20,000 tests. To ensure proper alignment to the genetic ancestry of the eQTL and GWAS cohorts, we use a reference panel from EUR individuals in 1KG61. The TWAS samples did not include any ascertainment for CanUD in the brain tissue used for analysis.
For every transcriptome-wide significant gene–trait association, we conducted a permutation test by shuffling the SNP-gene weights in the prediction model 10,000 times60,62. This permutation generates a null distribution to compare to the original TWAS Z score to quantify the significance of the expression–trait associations conditional on the SNP–trait effects at the locus60. For genes that passed both transcriptome-wide significance and the permutation test at P < 0.05 within 1 Mb of another significant gene, we conducted probabilistic gene-level fine-mapping using FOCUS to estimate 90% credible sets of genes that explain the trait association signal at a locus63. We conducted FOCUS fine-mapping across genes detected by models trained in either adult or fetal brain tissue.
Partitioned SNP-based heritability estimation
To assess differences in enrichment of SNP-based trait heritability in the regions around eQTLs of adult and fetal expression, we employed stratified LDSC61. Genes with at least one significant eQTL were designated ‘eGenes’. We generated LD score annotations for 500-bp windows around lead eQTLs of eGenes from Genotype-Tissue Expression brain cortex (n = 205) and fetal brain frontal cortex (n = 201). We used Genotype-Tissue Expression to ensure similar sample sizes. We define the enrichment of SNP-based heritability as the proportion of heritability explained by a set of SNPs in the annotation divided by the proportion of all SNPs included in the annotation.
gSEM
gSEM64 was used to perform EFA and CFA of CanUD and 14 additional traits of interest that were genetically correlated. For EFA, factor structures composed of one to ten factors were examined. EFA model fit was evaluated by the amount of cumulative variance explained by the overall factor structure, the SS loadings (SS loading ≥1) for each included factor and the proportion of explained variance accounted for by each of the individual factors (that is, ≥10%). Traits with EFA factor loadings ≥0.20 were evaluated for optimal CFA model fit determined by conventional fit indices64. CFA models were estimated using diagonally weighted least squares estimation and a smoothed genetic covariance matrix. The 1KG phase 3 EUR reference panel was used for LD calculation47.
Multi-trait analysis of GWAS
We applied the MTAG method65 for the joint analysis of the genome-wide association statistics of CanUD (EUR meta-analysis from the present study), AUD (n = 167,721)66 and nicotine dependence (based on the FTND; n = 58,000)67. First, SNPs that were duplicated, had MAF ≤0.01 or had strand ambiguity were removed from the GWAS datasets. Of the 14,768,834 SNPs available from the GWAS meta-analysis of CanUD, 5,894,946 SNPs remained for the MTAG analysis after quality control. After the MTAG analysis with AUD and nicotine dependence, 3,540,940 SNPs remained. Significant variants were defined at P < 5 × 10⁻⁸.
Reporting summary
Further information on research design is available in the Nature Portfolio Reporting Summary linked to this article.
Data availability
All MVP summary statistics are made available through dbGAP request under accession phs001672.v7.p1.
Meta-analysis summary statistics are available through the Gelernter lab website: https://medicine.yale.edu/lab/gelernter/.
Meta-analysis data will also be made available through the Complex Trait Genetics Virtual Lab: https://vl.genoma.io/.
Data for TWAS models used are available as follows:
TWAS models from Gandal et al 2018: https://gandallab.org/lab_resources#:~:text=Gene%2Dlevel%20TWAS%20weights%C2%A0
eQTLs from GTEx 2020: https://storage.googleapis.com/gtex_analysis_v8/single_tissue_qtl_data/GTEx_Analysis_v8_eQTL.tar
eQTLs from Walker et al 2019: https://www.cell.com/cms/10.1016/j.cell.2019.09.021/attachment/a2b04323-f963-4714-8f6b-81bc24e5bed1/mmc1.xlsx.
Code availability
Code for software and packages used in this analysis are all publicly available through the citations for each method as introduced.
References
Martins, S. S. et al. Racial and ethnic differences in cannabis use following legalization in US states with medical cannabis laws. JAMA Netw. Open 4, e2127002–e2127002 (2021).
Cerdá, M. et al. Association between recreational marijuana legalization in the United States and changes in marijuana use and cannabis use disorder from 2008 to 2016. JAMA Psychiatry 77, 165–171 (2020).
Aldington, S. et al. Cannabis use and risk of lung cancer: a case-control study. Eur. Respir. J. 31, 280–286 (2008).
Volkow, N. D. et al. Effects of cannabis use on human behavior, including cognition, motivation, and psychosis: a review. JAMA Psychiatry 73, 292–297 (2016).
Volkow, N.D. Substance use disorders in schizophrenia—clinical implications of comorbidity. Schizophr. Bull. 35 469–472 (2009).
Martin, J. L., Gadegbeku, B., Wu, D., Viallon, V. & Laumon, B. Cannabis, alcohol and fatal road accidents. PLoS ONE 12, e0187320 (2017).
Demontis, D. et al. Genome-wide association study implicates CHRNA2 in cannabis use disorder. Nat. Neurosci. 22, 1066–1074 (2019).
Bybjerg-Grauholm, J. et al. The iPSYCH2015 case-cohort sample: updated directions for unravelling genetic and environmental architectures of severe mental disorders. Preprint at medRxiv https://doi.org/10.1101/2020.11.30.20237768 (2020).
Boutin, N. T. et al. The evolution of a large biobank at Mass General Brigham. J. Personalized Med. 12, 1323 (2022).
Johnson, E. C. et al. A large-scale genome-wide association study meta-analysis of cannabis use disorder. Lancet Psychiatry 7, 1032–1045 (2020).
Gaziano, J. M. et al. Million Veteran Program: a mega-biobank to study genetic influences on health and disease. J. Clin. Epidemiol. 70, 214–223 (2016).
Luo, Y. et al. Estimating heritability and its enrichment in tissue-specific gene sets in admixed populations. Hum. Mol. Genet. https://doi.org/10.1093/hmg/ddab130 (2021).
Agrawal, A. et al. A genome-wide association study of DSM-IV cannabis dependence. Addict. Biol. 16, 514–518 (2011).
Minica, C. C. et al. Heritability, SNP- and gene-based analyses of cannabis use initiation and age at onset. Behav. Genet. 45, 503–513 (2015).
Agrawal, A. et al. DSM-5 cannabis use disorder: a phenotypic and genomic perspective. Drug Alcohol Depend. 134, 362–369 (2014).
Verweij, K. J. et al. The genetic aetiology of cannabis use initiation: a meta-analysis of genome-wide association studies and a SNP-based heritability estimation. Addict. Biol. 18, 846–850 (2013).
Sherva, R. et al. Genome-wide association study of cannabis dependence severity, novel risk variants, and shared genetic risks. JAMA Psychiatry 73, 472–480 (2016).
Pasman, J. A. et al. GWAS of lifetime cannabis use reveals new risk loci, genetic overlap with psychiatric traits, and a causal influence of schizophrenia. Nat. Neurosci. 21, 1161–1170 (2018).
Brown, B. C., Asian Genetic Epidemiology Network Type 2 Diabetes Consortium, Ye, C. J., Price, A. L. & Zaitlen, N. Transethnic genetic-correlation estimates from summary statistics. Am. J. Hum. Genet. 99, 76–88 (2016).
Saunders, G. R. B. et al. Genetic diversity fuels gene discovery for tobacco and alcohol use. Nature 612, 720–724 (2022).
Connor, J.P. et al. Cannabis use and cannabis use disorder. Nat. Rev. Dis. Primers https://doi.org/10.1038/s41572-021-00247-4 (2021).
Levey, D. F. et al. Reproducible genetic risk loci for anxiety: results from approximately 200,000 participants in the Million Veteran Program. Am. J. Psychiatry 177, 223–232 (2020).
Levey, D. F. et al. Bi-ancestral depression GWAS in the Million Veteran Program and meta-analysis in >1.2 million individuals highlight new therapeutic directions. Nat. Neurosci. 24, 954–963 (2021).
Thorgeirsson, T. E. et al. A variant associated with nicotine dependence, lung cancer and peripheral arterial disease. Nature 452, 638–642 (2008).
D’Souza, D.C. et al. Consensus paper of the WFSBP task force on cannabis, cannabinoids and psychosis. World J. Biol. Psychiatry https://doi.org/10.1080/15622975.2022.2038797 (2022).
Gelernter, J. & Polimanti, R. Genetics of substance use disorders in the era of big data. Nat. Rev. Genet. 22, 712–729 (2021).
Johnston, K. J. A. et al. Genome-wide association study of multisite chronic pain in UK Biobank. PLoS Genet. 15, e1008164 (2019).
Fisher, E. et al. Cannabinoids, cannabis, and cannabis-based medicine for pain management: a systematic review of randomised controlled trials. Pain 162, S45–S66 (2021).
Stockings, E. et al. Cannabis and cannabinoids for the treatment of people with chronic noncancer pain conditions: a systematic review and meta-analysis of controlled and observational studies. Pain 159, 1932–1954 (2018).
Jayawardana, S. et al. Global consumption of prescription opioid analgesics between 2009-2019: a country-level observational study. EClinicalMedicine 42, 101198 (2021).
Nugent, S. M. et al. The effects of cannabis among adults with chronic pain and an overview of general harms: a systematic review. Ann. Intern. Med. 167, 319–331 (2017).
Smoking and Health: Report of the Advisory Committee to the Surgeon General of the Public Health Service (US Department of Health, Education, and Welfare, Public Health Service, 1964).
Gandal, M.J. et al. Transcriptome-wide isoform-level dysregulation in ASD, schizophrenia, and bipolar disorder. Science 362 (2018).
Walker, R. L. et al. Genetic control of expression and splicing in developing human brain informs disease mechanisms. Cell 179, 750–771 e22 (2019).
Lentini, J. M., Alsaif, H. S., Faqeih, E., Alkuraya, F. S. & Fu, D. DALRD3 encodes a protein mutated in epileptic encephalopathy that targets arginine tRNAs for 3-methylcytosine modification. Nat. Commun. 11, 2510 (2020).
Laugel, V. et al. Mutation update for the CSB/ERCC6 and CSA/ERCC8 genes involved in Cockayne syndrome. Hum. Mutat. 31, 113–126 (2010).
Moslehi, R. et al. Integrative genomic analysis implicates ERCC6 and its interaction with ERCC8 in susceptibility to breast cancer. Sci. Rep. 10, 21276 (2020).
Jing, J. J. et al. Epistatic SNP interaction of ERCC6 with ERCC8 and their joint protein expression contribute to gastric cancer/atrophic gastritis risk. Oncotarget 8, 43140–43152 (2017).
Ronchetti, D. et al. A compendium of long non-coding RNAs transcriptional fingerprint in multiple myeloma. Sci. Rep. 8, 6557 (2018).
McCrory, E. J. & Mayes, L. Understanding addiction as a developmental disorder: an argument for a developmentally informed multilevel approach. Curr. Addict. Rep. 2, 326–330 (2015).
Gunn, J. K. et al. Prenatal exposure to cannabis and maternal and child health outcomes: a systematic review and meta-analysis. BMJ Open 6, e009986 (2016).
Eyles, D. W. How do established developmental risk-factors for schizophrenia change the way the brain develops? Transl. Psychiatry 11, 158 (2021).
Gulsuner, S. et al. Spatial and temporal mapping of de novo mutations in schizophrenia to a fetal prefrontal cortical network. Cell 154, 518–529 (2013).
Susser, E. S. & Lin, S. P. Schizophrenia after prenatal exposure to the Dutch Hunger Winter of 1944–1945. Arch. Gen. Psychiatry 49, 983–988 (1992).
Hatoum, A.S. et al. The addiction risk factor: a unitary genetic vulnerability characterizes substance use disorders and their associations with common correlates. Neuropsychopharmacology https://doi.org/10.1038/s41386-021-01209-w (2021).
Levey, D. F. et al. Genetic associations with suicide attempt severity and genetic overlap with major depression. Transl. Psychiatry 9, 22 (2019).
1000 Genomes Project Consortium, et al. A global reference for human genetic variation. Nature 526, 68–74 (2015).
Loh, P. R. et al. Reference-based phasing using the Haplotype Reference Consortium panel. Nat. Genet. 48, 1443–1448 (2016).
Howie, B., Fuchsberger, C., Stephens, M., Marchini, J. & Abecasis, G. R. Fast and accurate genotype imputation in genome-wide association studies through pre-phasing. Nat. Genet. 44, 955–959 (2012).
Iglesias, A. I. et al. Haplotype reference consortium panel: practical implications of imputations with large reference panels. Hum. Mutat. 38, 1025–1032 (2017).
Karlson, E. W., Boutin, N. T., Hoffnagle, A. G. & Allen, N. L. Building the partners healthcare biobank at partners personalized medicine: informed consent, return of research results, recruitment lessons and operational considerations. J. Pers. Med 6, 2 (2016).
Willer, C. J., Li, Y. & Abecasis, G. R. METAL: fast and efficient meta-analysis of genomewide association scans. Bioinformatics 26, 2190–2191 (2010).
Magi, R. et al. Trans-ethnic meta-regression of genome-wide association studies accounting for ancestry increases power for discovery and improves fine-mapping resolution. Hum. Mol. Genet. 26, 3639–3650 (2017).
Hasin, D. S. et al. Prevalence of marijuana use disorders in the United States between 2001–2002 and 2012–2013. JAMA Psychiatry 72, 1235–1242 (2015).
Bulik-Sullivan, B. K. et al. LD Score regression distinguishes confounding from polygenicity in genome-wide association studies. Nat. Genet. 47, 291–295 (2015).
Lundberg, M., Campos, A., Renteria, M., Ngo, T. & Partida, G. C. Dissecting the genetic architecture of chronic pain using CTG-VL: complex-traits genetics virtual lab. Behav. Genet. 49, 517–517 (2019).
Bulik-Sullivan, B. et al. An atlas of genetic correlations across human diseases and traits. Nat. Genet. 47, 1236–1241 (2015).
Hemani, G. et al. The MR-Base platform supports systematic causal inference across the human phenome. Elife 7, e34408 (2018).
Zhu, Z. et al. Causal associations between risk factors and common diseases inferred from GWAS summary data. Nat. Commun. 9, 224 (2018).
Gusev, A. et al. Integrative approaches for large-scale transcriptome-wide association studies. Nat. Genet. 48, 245–252 (2016).
Finucane, H. K. et al. Partitioning heritability by functional annotation using genome-wide association summary statistics. Nat. Genet. 47, 1228–1235 (2015).
Bhattacharya, A. et al. Isoform-level transcriptome-wide association uncovers extensive novel genetic risk mechanisms for neuropsychiatric disorders in the human brain. Preprint at medRxiv https://doi.org/10.1101/2022.08.23.22279134 (2022).
Mancuso, N. et al. Probabilistic fine-mapping of transcriptome-wide association studies. Nat. Genet. 51, 675–682 (2019).
Grotzinger, A. D. et al. Genomic structural equation modelling provides insights into the multivariate genetic architecture of complex traits. Nat. Hum. Behav. 3, 513–525 (2019).
Turley, P. et al. Multi-trait analysis of genome-wide association summary statistics using MTAG. Nat. Genet. 50, 229–237 (2018).
Kranzler, H. R. et al. Genome-wide association study of alcohol consumption and use disorder in 274,424 individuals from multiple populations. Nat. Commun. 10, 1499 (2019).
Quach, B. C. et al. Expanding the genetic architecture of nicotine dependence and its shared genetics with multiple traits. Nat. Commun. 11, 5562 (2020).
Acknowledgements
This research is based on data from the MVP, Office of Research and Development, Veterans Health Administration. D.F.L. was supported by an NARSAD Young Investigator Grant from the Brain and Behavior Research Foundation and a Career Development Award CDA-2 from the Veterans Affairs Office of Research and Development (1IK2BX005058-01A2) and is Aimee Mann Fellow of Psychiatric Genetics. This work was supported by NIH grants R01DA054869 (J.G., H.E. and A.A.) and R01 AA026364 (J.G.), and by funding from the Department of Veterans Affairs Office of Research and Development, USVA, grant I01CX001849, and the VA Cooperative Studies Program study, no. 575B, the VA National Center for PTSD Research, and the West Haven VA Mental Illness Research, Education and Clinical Center. E.C.J. was funded by grant K01DA051759. H.J.E. is funded in part by R01DA054869. H.R.K. is funded by the Department of Veterans Affairs grant I01 BX004820 and the VISN 4 Mental Illness Research, Education and Clinical Center of the Crescenz VAMC. T.L. and M.L. were supported, in part, by a grant from the NIH (R01MH117646). J.W.S. is supported In part by R01MH118233. R.P. is supported by R33DA047527, R21DC018098 and One Mind. D.K. is funded by the Horizon 2020 Marie Sklodowska-Curie Individual Fellowship from the European Commission (101028810). H.Z. was supported by a NARSAD Young Investigator Grant from the Brain and Behavior Research Foundation (27835). F.R.W. was funded by grant F32MH122058. J.D.D. was funded by grant T32 AA028259. M.J.G. is supported by NIH grants R01MH121521 and R01MH123922. A.A. is funded in part by R01DA054869. This publication does not represent the views of the Department of Veterans Affairs or the United States Government. D.D. and A.D.B. were supported by grants from the Lundbeck Foundation (R102-A9118, R155-2014-1724 and R248-2017-2003), NIH/NIMH (1R01MH124851-01 to A.D.B.) and the University and University Hospital of Aarhus. The Danish National Biobank resource was supported by the Novo Nordisk Foundation. High-performance computer capacity for handling and statistical analysis of iPSYCH data on the GenomeDK HPC facility was provided by the Center for Genomics and Personalized Medicine and the Centre for Integrative Sequencing, iSEQ, Aarhus University, Denmark (grant to A.D.B.). D.D. was supported by the Novo Nordisk Foundation (NNF20OC0065561 and NNF21SA0072102) and the Lundbeck Foundation (R344-2020-1060).
Author information
Authors and Affiliations
Consortia
Contributions
D.F.L. and J.G. designed the study. D.F.L. and J.G. drafted the manuscript. M.B.S. provided ongoing feedback and refinement of the analytical plan. D.F.L., M.G., E.C.J., M.C. and V.M.R. conducted GWAS on included cohorts. K.M.H., D.F.L., Y.Z.N. and R.Q. discussed, created and refined the phenotype in the MVP. D.F.L., M.G., H.Z., J.M.G., M.B.S. and J.G. discussed and refined MVP analytic plans. D.F.L., M.G., J.D.D., D.M.H., F.R.W., A.B., D.K., P.G., M.B., S.L.L.E. and M.L. conducted original analyses. D.F.L., H.R.K., H.J.E., A.A., J.W.S., T.L., A.D.B., D.D., M.J.G., R.P. and J.G. supervised original analyses. All authors critically evaluated and revised the manuscript.
Corresponding authors
Ethics declarations
Competing interests
H.R.K. is a member of advisory boards for Dicerna Pharmaceuticals, Sophrosyne Pharmaceuticals, Clearmind Medicine and Enthion Pharmaceuticals; a consultant to Sobrera Pharmaceuticals; the recipient of research funding and medication supplies for an investigator-initiated study from Alkermes; and a member of the American Society of Clinical Psychopharmacology’s Alcohol Clinical Trials Initiative, which was supported in the last three years by Alkermes, Dicerna, Ethypharm, Lundbeck, Mitsubishi and Otsuka. J.G. and H.R.K. are holders of US patent 10,900,082 titled: ‘Genotype-guided dosing of opioid agonists’, issued 26 January 2021. R.P. and J.G. are paid for their editorial work on the journal Complex Psychiatry. R.P. reports a research grant from Alkermes. The remaining authors declare no competing interests.
Peer review
Peer review information
Nature Genetics thanks the anonymous reviewers for their contribution to the peer review of this work.
Additional information
Publisher’s note Springer Nature remains neutral with regard to jurisdictional claims in published maps and institutional affiliations.
Supplementary information
Supplementary Information
Supplementary Tables 1–16 and Supplementary Figs. 1–7.
Rights and permissions
Open Access This article is licensed under a Creative Commons Attribution 4.0 International License, which permits use, sharing, adaptation, distribution and reproduction in any medium or format, as long as you give appropriate credit to the original author(s) and the source, provide a link to the Creative Commons license, and indicate if changes were made. The images or other third party material in this article are included in the article’s Creative Commons license, unless indicated otherwise in a credit line to the material. If material is not included in the article’s Creative Commons license and your intended use is not permitted by statutory regulation or exceeds the permitted use, you will need to obtain permission directly from the copyright holder. To view a copy of this license, visit http://creativecommons.org/licenses/by/4.0/.
About this article

Cite this article
Levey, D.F., Galimberti, M., Deak, J.D. et al. Multi-ancestry genome-wide association study of cannabis use disorder yields insight into disease biology and public health implications. Nat Genet 55, 2094–2103 (2023). https://doi.org/10.1038/s41588-023-01563-z
Received:
Accepted:
Published:
Issue Date:
DOI: https://doi.org/10.1038/s41588-023-01563-z
This article is cited by
-
Pleiotropy and genetically inferred causality linking multisite chronic pain to substance use disorders
Molecular Psychiatry (2024)
-
Genetic influences and causal pathways shared between cannabis use disorder and other substance use traits
Molecular Psychiatry (2024)
-
Massive genetic study finds genes linked to cannabis addiction
Nature (2023)
