
Abstract
The severe acute respiratory syndrome coronavirus 2 (SARS‑CoV‑2) disease (COVID-19) pandemic has caused millions of deaths worldwide. Genome-wide association studies identified the 3p21.31 region as conferring a twofold increased risk of respiratory failure. Here, using a combined multiomics and machine learning approach, we identify the gain-of-function risk A allele of an SNP, rs17713054G>A, as a probable causative variant. We show with chromosome conformation capture and gene-expression analysis that the rs17713054-affected enhancer upregulates the interacting gene, leucine zipper transcription factor like 1 (LZTFL1). Selective spatial transcriptomic analysis of lung biopsies from patients with COVID-19 shows the presence of signals associated with epithelial–mesenchymal transition (EMT), a viral response pathway that is regulated by LZTFL1. We conclude that pulmonary epithelial cells undergoing EMT, rather than immune cells, are likely responsible for the 3p21.31-associated risk. Since the 3p21.31 effect is conferred by a gain-of-function, LZTFL1 may represent a therapeutic target.
Main
The COVID-19 pandemic is estimated to have caused over 4.6 million deaths so far1,2. The predominant cause of mortality is pneumonia and severe acute respiratory distress syndrome3. However, COVID-19 can cause multiple organ failure through cytokine release, microvascular and macrovascular thrombosis, endothelial damage, acute kidney injury and myocarditis4,5,6. Genome-wide association studies (GWAS) are important for identifying candidate genes and pathways that predispose to complex diseases7; genetically validated drug targets are more likely to lead to approved drugs8. Two large GWAS were carried out to determine whether common variants drive susceptibility to severe COVID-19 (refs. 9,10). Both studies identified a region of chromosome 3p21.31 as having the strongest association, while a third study also identified this locus as conferring susceptibility to infection11. The 3p21.31 risk haplotype, which arises from Neanderthal DNA12 and is currently unexplained with regards to the causal variant(s), causal gene(s) and specific role in COVID-19, confers a twofold increased risk of respiratory failure from COVID-19 (refs. 9,10) and an over twofold increased risk of mortality for individuals under 60 (ref. 13). Additionally, the risk variants at this locus are carried by >60% of individuals with South Asian ancestry (SAS), compared to 15% of European ancestry (EUR) groups, partially explaining the ongoing higher death rate in this population in the UK14,15.
Identifying the causal gene(s) and mechanism(s) behind GWAS hits poses several challenges. First, a causative variant is usually in linkage disequilibrium (LD) with many other variants and these can take different forms (SNPs, insertions, deletions and structural polymorphisms). Second, the genetic signals are completely cell type-agnostic, which makes it challenging to identify appropriate experimental models for further investigation. Third, there are multiple mechanisms by which variants can have an effect. Alteration of the protein-coding sequence or RNA splicing, both of which are relatively straightforward to disentangle, account for fewer than 20% of associations in polygenic disease16. The remaining variants and their target gene(s) can be very difficult to decode. Many are thought to lie within cis-regulatory elements17, such as enhancers, which are short DNA sequences that often control tissue- and developmental stage-specific gene expression. Deciphering the variants that affect enhancers is challenging because many enhancers are only active in specific cell types or at specific times; enhancers are often distant in the linear DNA sequence (often 104–106 base pairs (bp)) from the genes they control and the effects of sequence changes are not straightforward to predict.
We developed a comprehensive platform for decoding the effects of sequence variation identified by GWAS16 (Extended Data Fig. 1a). This combines computational and wet lab approaches to delineate the identity of causative variants, the cell types involved and effector genes. Initially, GWAS-identified haplotypes were screened for potential protein-coding sequence variants. Variants altering splice sites were then assessed using a combination of machine learning18 and RNA sequencing (RNA-seq) analysis. Conventional genomic approaches were then combined with machine learning19 to define whether variants were found within, and affected, cis-regulatory sequences from a panel of disease-relevant cell types; this allows for the identification of the key cell type(s) and the determination of the likely causative variant. Subsequently, chromosome conformation capture (3C) analysis20,21,22 was used to identify the gene promoters, which physically contacted the candidate enhancer sequence in the relevant cell type(s); these data were integrated with gene-expression analyses. Finally, genome editing was used to validate the regulatory effects of prioritized variants.
In this study, we applied this approach to identify rs17713054 as a probable causative variant and LZTFL1 as a candidate effector gene in pulmonary epithelial cells as contributing to the strong COVID-19 association at the 3p21.31 locus, with EMT identified as a relevant infection response pathway.
Results
The rs17713054 risk allele generates a CCAAT/enhancer binding protein beta motif
The 3p21.31 region contains variants associated with the autoimmune diseases type 1 diabetes23 and multiple sclerosis24, although the lead and tag variants identified in these studies are not in high LD with those associated with COVID-19 severity (Extended Data Fig. 1b). There are 28 candidate risk variants in LD with the original genome-wide significant SNPs9 at 3p21.31 (r2 > 0.8, EUR; Extended Data Fig. 1c). None of these variants affect coding sequences. One SNP, rs35624553, is in the 3′-UTR of the gene LZTFL1 (Fig. 1) but this is not a conserved microRNA (miRNA) binding site25 and neither miRdSNP26 nor MicroSNiPer27 predict that the variant alters miRNA binding. Four other variants are within LZTFL1 introns, including the lead SNP rs11385942 (ref. 9). None of these are predicted to alter messenger RNA splicing of LZTFL1, either by machine learning with SpliceAI18 or splicing quantitative trait locus (sQTL)-based approaches28, and the nearest exon junction to these variants is approximately 500 bp (Fig. 1). Therefore, a cis-regulatory mechanism is the most likely explanation for this haplotype.

COVID-19 risk variants from GWAS were assessed for multiple mechanisms. All genome-wide-significant variants and linked variants are shown (GWAS) as are variants present in the Vindija Neanderthal12 risk haplotype. The circles indicate variants assessed for splicing changes (blue circles, SpliceAI18: ∆S score (0–1, where 1 is the most damaging)), and presence in cis-regulatory elements using open chromatin in 95 ENCODE overlaid DNase I datasets (red circles), normal human bronchial epithelial cells and scATAC-seq from fetal ciliated and alveolar epithelia34. Histone H3 modification tracks show the presence of marks associated with active transcription (H3K27ac) at enhancers (H3K4me1) and promoters (H3K4me3). Variants in open chromatin are given deepHaem damage scores (0–1) with sign indicating increased (−) or decreased (+) accessibility. The region shown is chr3:45,800,000–45,870,000, hg38. HSMM, human skeletal muscle myoblast; NHEK, normal human epidermal keratinocyte.
We first examined open chromatin from 24 diverse immune cell populations29 (including T, B, natural killer and dendritic cells) in resting and stimulated states but did not identify any of the 28 severe COVID-19-associated variants at 3p21.31 in open chromatin (Extended Data Fig. 1d), making it unlikely that a cis-regulatory mechanism in these immune cell types is responsible. By considering open chromatin data from 95 diverse cell types, we identified 2 SNPs, rs17713054 and rs76374459, which are found in open chromatin30 (Fig. 1 and Extended Data Fig. 2). Machine learning approaches have proven accurate at predicting allele-specific changes in transcription factor binding and chromatin accessibility31,32, including de novo gain-of-function changes33. We previously developed a machine learning model, deepHaem19, which uses 694 DNase I hypersensitivity and assay for transposase-accessible chromatin using sequencing (ATAC-seq) datasets to predict changes to active regulatory elements. Importantly, deepHaem predicted that the 26 variants not found in open chromatin have no strong gain-of-function effect in any cell type (Extended Data Fig. 3).
Of the two variants in open chromatin, rs76374459 is unlikely to be causative. It is not contained within the Vindija Neanderthal risk haplotype12 and is not in tight LD with the 3p21.31 lead SNPs from either of two GWAS9,10 (rs11385942, r2 = 0.737/0.058, EUR/SAS; rs73064425, r2 = 0.747/0.058, EUR/SAS). In addition, it is in an erythroid-specific enhancer, a cell type not strongly implicated in SARS-CoV-2 infection; it is not predicted by machine learning to cause damaging effects (Fig. 1 and Extended Data Figs. 2 and 4). In contrast, rs17713054 is likely to be a causative SNP since it is in tight LD with both lead SNPs (rs11385942, r2 = 1.0/1.0, EUR/SAS; rs73064425, r2 = 0.986/0.995, EUR/SAS), is located in open chromatin in numerous COVID-19-relevant cell types, including epithelial and endothelial cells (Fig. 1 and Extended Data Fig. 2), where it is marked by epigenetic modifications associated with active enhancers (histone H3 lysine 4 monomethylation (H3K4me1) and histone H3 lysine 27 acetylation (H3K27ac)). Inspection of single-cell ATAC-seq (scATAC-seq) from healthy lung34,35 showed that this enhancer is present in several lung epithelial cell types, including the ciliated epithelium and club cells that line the respiratory tract, and in type 1 and type 2 pneumocytes, which form the alveoli (Fig. 1 and Extended Data Fig. 5). Interestingly, deepHaem predicted that the rs17713054 risk allele, which is the minor allele A (minor allele frequency (MAF): 0.0817 EUR, 0.377 SAS36), acts as a gain-of-function mechanism by augmenting an existing enhancer, resulting in increased chromatin accessibility in both epithelial and endothelial cells and particularly in primary lung tissue (Fig. 2a). Analysis of ATAC-seq for human aortic endothelial cells from 48 individuals37 showed that the rs17713054-containing enhancer was significantly more accessible in heterozygous A/G donors than homozygous G/G donors (Fig. 2b); in heterozygous samples, more reads originated the risk A allele than the non-risk G allele (Fig. 2c).

a, Ranked deepHaem chromatin accessibility damage scores for the risk A allele of rs17713054 in 694 cell types including primary cells. The line plot shows the cumulative percentage of samples for each tissue, an indication that lung tissue is enriched in the highly ranked damaging variants. b, Quantification of ATAC-seq reads in the rs17713054 enhancer (chr3:45,817,661–45,818,660, hg38) from aortic endothelium37. The bars show the mean and 1 s.d. Two-tailed Mann–Whitney U-test, comparing accessibility of the two genotypes; G/G n = 78 and G/A n = 8 independent experiments. c, ATAC-seq reads over rs17713054 alleles in heterozygous individuals; the gray lines denote paired counts from a single replicate. One-sided Wilcoxon matched-pairs signed-rank test, testing the higher accessibility of the A allele, n = 5. Three replicates were excluded due to low coverage. d, CEBPB DNA binding motif over the sequence around the rs17713054 risk A and non-risk G alleles. The P values for the motifs were determined using FIMO with reference and variant sequence for the entire enhancer and JASPAR motif MA0466.1. The motif over rs17713054 was only identified in the sequence with the A allele. e, Sasquatch DNase I hypersensitivity profile and shoulder-footprint ratio (SFR) scores for rs17713054 risk and non-risk (ref G) alleles using DNase I datasets for a subset of cells with open chromatin at this site. Larger SFR scores indicate a deeper footprint associated with greater likelihood of being bound by a transcription factor. ∆SFR scores are generated by subtracting the risk A SFR from the ref G SFR; negative values show an increased footprint depth in the risk allele.
Sequence analysis showed that the risk allele generates a second CCAAT/enhancer binding protein beta (CEBPB) motif38 in the enhancer (Fig. 2d). The biological relevance of this new motif is supported by strong expression of CEBPB in lung tissue28 and chromatin immunoprecipitation followed by sequencing (ChIP-seq) of CEBPB in HeLa, A549 alveolar basal epithelial adenocarcinoma and IMR-90 lung fibroblast cells39––which are homozygous G/G non-risk––showing weak binding at the enhancer (Extended Data Fig. 6a–d). Furthermore, deepHaem predicted that rs17713054-A would lead to increased CEBPB binding in IMR-90 and A549 cells (Extended Data Fig. 6e). An orthogonal DNase I hypersensitivity footprinting-based approach, Sasquatch40, uses genome-wide, cell type-specific motif footprints to predict how sequence-specific changes alter transcription factor binding. This found that motifs containing either allele have strong DNase I footprints. When comparing motifs with the risk A allele with the non-risk G allele, risk A motifs showed a weak gain in accessibility in fetal lung and IMR-90 lung fibroblast cells (Fig. 2e), corroborating a gain-of-function mechanism.
The rs1773054 enhancer interacts with the LZTFL1 promoter
The 3p21.31 locus is gene-dense and contains several candidates that could potentially be involved in COVID-19 pathogenesis. These include three chemokine receptors: CCR9 (which encodes a lymphocyte-expressed C-C chemokine receptor41); CXCR6 (which is associated with sarcoidosis and is a coreceptor for HIV42,43); and XCR1 (which encodes a X-C chemokine receptor). Transcriptome-wide association study (TWAS) analysis also identified CCR2, CCR3 and FYCO1, which lie up to 500 kilobases (kb) away, as candidate effector genes for the 3p21.31 COVID-19 association10. In addition, there are the two nearest genes that are less well studied: SLC6A20 (the SIT1 imino acid transporter associated with glycinuria44) and LZTFL1 (ref. 45), the homozygous loss of which causes the classical ciliopathy Bardet–Biedl syndrome46,47.
To identify candidate target genes of the rs17713054 enhancer we performed NuTi Capture-C20,21 from the promoters of genes in surrounding regulatory domains (Methods) in primary human umbilical vein endothelial cells (HUVECs) where the rs17713054 enhancer is accessible, as well as resting and stimulated primary CD4+ T cells, primary CD14+ monocytes, CD71+ CD235+ erythroid cells and H1 human embryonic stem cells (H1-hESCs), where the enhancer is not accessible. In all cell types tested, all 28 COVID-19-associated variants fell within a domain of interaction that contained only the promoters of LZTFL1, SLC6A20 and CCR9, and is delimited by convergent CTCF boundary motifs (Fig. 3a). Within this domain, the promoters of both LZTFL1 and SLC6A20 interacted more strongly with the rs17713054 enhancer than CCR9 (Fig. 3b). Reciprocal Capture-C from the rs17713054 enhancer also showed that its interactions were primarily constrained to the same domain (Extended Data Fig. 7a). Notably, inside this domain, several tissue-specific enhancers could be seen for immune, erythroid and endothelial cell types, altering the interaction profile of the ubiquitously accessible LZTFL1 promoter and indicating dynamic regulation (Supplementary Fig. 1).
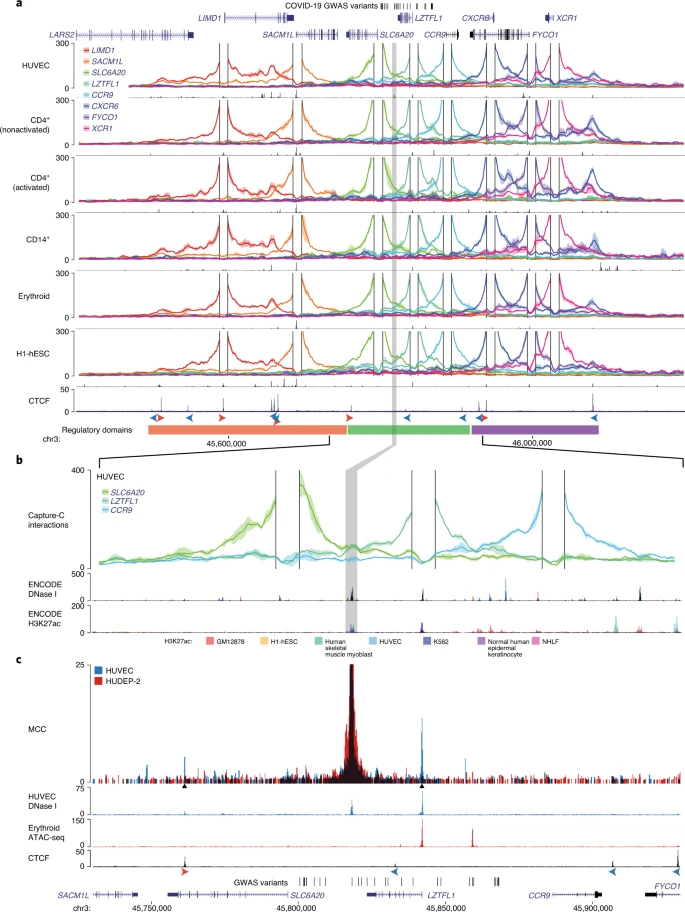
a, DpnII Capture-C-derived mean interaction count (n = 3 for all except CD14+, n = 2) and 1 s.d. (shading) for gene promoters in HUVECs, resting and activated T cells (CD4+ nonactivated/activated), monocytes (CD14+), CD71+ CD235+ erythroid cells and H1-hESCs. The enhancer containing rs17713054 is highlighted by a gray box. ATAC-seq/DNase I for each cell type is shown underneath in black. The CTCF track shows binding of the CCAAT-binding factor that acts as a boundary with forward and reverse motif orientation shown with arrowheads (red and blue, respectively). Three broad regulatory domains were identified as regions with overlapping interactions (region: chr3:45,400,000–46,200,000, hg38). Per-fragment interactions were smoothed using 400-bp bins and an 8-kb window. b, The rs17713054 regulatory domain in endothelial cells (HUVECs). Overlaid DNase I shows accessible sites in 95 cell types and H3K27ac shows active elements (region: chr3:45,730,000–45,930,000, hg38). Per-fragment interactions were smoothed using 250-bp bins and a 5-kb window. The solid line shows the mean interaction count (n = 3 independent samples) with 1 s.d. (shading). c, MCC of the rs17713054 enhancer in endothelial (HUVECs, blue) and erythroid (HUDEP-2, red) cells with tissue-specific open chromatin tracks (n = 3). Peak analysis of MCC using LanceOtron to compare the HUVEC and HUDEP-2 profiles identified two significantly enriched peaks in HUVEC cells (black triangles, P ≤ 1 × 10−999) that correspond to the LZTFL1 promoter and upstream CTCF site.
We went on to perform Micro Capture-C (MCC), a 3C method that provides higher resolution data than conventional approaches22, from the rs17713054 enhancer in endothelial cells. MCC in HUVECs delineated significant tissue-specific interaction with the LZTFL1 promoter and the nearest upstream boundary CTCF site but no other significant peaks of interactions with any of the other gene promoters in the region (Fig. 3c and Extended Data Fig. 7a). Importantly, we did not find a peak of interaction with SLC6A20, probably because ENCODE datasets show that SLC6A20 carries Polycomb repression marks in endothelial (HUVEC) and normal human lung fibroblast (NHLF) cells (Extended Data Fig. 7b). Additionally, the LZTFL1 promoter was more consistently accessible in cells where rs17713054 was also accessible (Extended Data Fig. 7c,d). Therefore, LZTFL1 is the most likely direct regulatory target of the rs17713054-containing epithelial–endothelial–fibroblast enhancer.
rs17713054 A is associated with higher gene expression in the lung
Disease biology, deepHaem, TWAS analysis10 and a phenome-wide association study11 identified lung tissue and function as key for the 3p21.31 COVID-19 association. Analysis of whole-lung RNA-seq28 showed that LZTFL1 is strongly expressed in the lung (Fig. 4a) and single-cell RNA-seq (scRNA-seq)48 showed that LZTFL1 is present throughout the respiratory epithelium but predominantly expressed in ciliated cells (Fig. 4b,c). Of the other candidate genes identified in this study and elsewhere10,49,50 (SLC6A20, CCR2, CCR3, CCR9, CXCR6 and FYCO1), only SLC6A20 and FYCO1 were consistently expressed in both lung bulk and scRNA-seq datasets, although CCR2 and CXCR6 were found in bulk RNA-seq. FYCO1 was found in most cell types and SLC6A20 was restricted to goblet cells and alveolar type 2 pneumocytes (Fig. 4 and Extended Data Fig. 8). Analysis using the Genotype-Tissue Expression28 (GTEx) portal for expression quantitative trait loci (eQTLs) showed that the rs17713054 A risk allele was associated with higher levels of expression in the lung of LZTFL1 and SLC6A20 but not the other genes (Fig. 4d and Extended Data Fig. 8). Colocalization analysis51 showed that these GWAS and eQTL associations are more likely as a result of a single variant (posterior probability (PP) = 0.2657) than two distinct variants (PP = 0.0566).
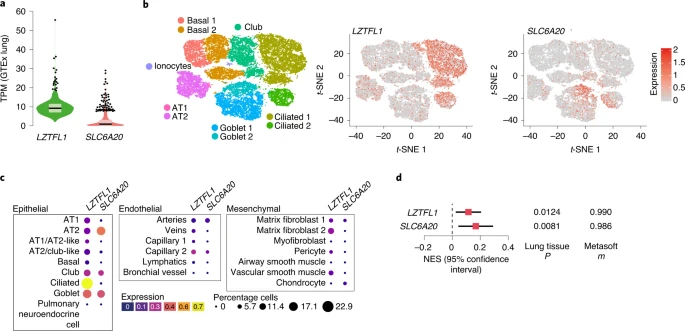
a, GTEx whole-lung RNA-seq expression profiles for LZTFL1 and SLC6A20 as transcripts per million (TPM). For the violin plots, minima and maxima are the top and bottom of the violin, the black lines show the means, the ends of the pale regions denote the first and third quartiles and the black dots denote outliers (n = 578 independent samples). b, 10x Genomics Chromium droplet scRNA-seq from the upper and lower airways and lung parenchyma48 from healthy volunteers or deceased transplant donors with ten epithelial populations (left). scRNA-seq expression profiles for LZTFL1 (middle) and SLC6A20 (right). c, Chromium single-nucleus RNA-seq35 from non-diseased adult lung (n = 3) with 22 epithelial, endothelial and mesenchymal populations, including AT1 and AT2 pneumocytes. d, GTEx eQTL analysis the rs17713054 risk A allele in the lung (n = 515 independent samples). The normalized effect size (NES) is the slope of the linear regression comparing the alternate (A) allele to the reference (G) allele. NES are calculated in a normalized space where magnitude has no direct biological interpretation. The lines show the 95% confidence interval, with significance values for single-tissue (two-sided P value without multiple test correction) and multi-tissue (PP/m value) analyses.
CRISPR–Cas9 genome editing52 allows the possibility to test the role of the rs17713054 enhancer in the regulation of LZTFL1 and SLC6A20. Since the enhancer shows accessibility in epithelial, endothelial and mesenchymal cells (Extended Data Fig. 9a), we used CRISPR–Cas9 ribonucleoprotein (RNP) editing to delete either a 108- or 191-bp region at high efficiency (>70%) from H441 distal lung epithelial cells, adult blood outgrowth endothelial cells, HUVECs and IMR-90 lung fibroblast cells (Extended Data Fig. 9b–d and Supplementary Fig. 2). Using real-time quantitative PCR (qPCR) we detected no effect on LZTFL1 expression after enhancer deletion (Extended Data Fig. 9e), which is consistent with a study that CRISPR interference in the 16HBE14o- bronchial epithelial cell line had no effect on nearby gene expression50. Since SLC6A20 is Polycomb-repressed in fibroblasts and endothelial cells, it was undetectable by qPCR with reverse transcription (RT–qPCR). To understand the unexpected result, we generated H3K27ac ChIP-seq in all four cell types (Extended Data Fig. 9f,g). The rs17713054 enhancer lacked strong H3K27ac and was probably inactive, explaining the lack of effect seen by deletion. Therefore, a suitable cell model for testing the effects of rs17713054, particularly in the lung epithelium, is not currently available.
Epithelial dysfunction in the COVID-19 lung
Given that the rs17713054 enhancer is present and LZTFL1 is expressed in lung epithelial cells, the respiratory epithelium is of particular interest for understanding the association at 3p21.31. EMT, a developmental pathway that allows terminally differentiated epithelial cells to dedifferentiate and acquire mesenchymal identity, plays a key role in the innate immune response, is a consequence of lung inflammation and is involved in both the development and resolution of pneumonitis53,54,55,56. SARS-CoV-2 is known to induce EMT in both lung carcinoma cell lines and in the respiratory tract57,58 and LZTFL1 is known to regulate EMT through Wnt/β-catenin, hedgehog and transforming growth factor-β (TGF-β) signaling59,60. In the context of malignancy, increased levels of LZTFL1 inhibits EMT, whereas decreased LZTFL1 promotes EMT45,59,60.
Defining EMT in complex tissues is challenging due to its diverse and dynamic nature but can be achieved through a combined assessment of cellular reorganization, an abundance of fibroblasts (which are a product of EMT), presence of EMT-promoting signaling pathways and coexpression of epithelial and mesenchymal markers61. Consistent with the work by others62,63, we saw widespread epithelial dysfunction and diffuse alveolar damage with reorganization indicative of EMT evident in postmortem biopsies of three patients with COVID-19. Dysfunction in ciliated airways included denudation, hyperplasia and squamous metaplasia (Fig. 5a). Features of diffuse alveolar damage included pneumocyte hyperplasia, hyaline membrane deposition, immune inflammation, fine and focal fibrosis and squamous metaplasia (Fig. 5b). Between the areas of interstitial expansion and fibrotic foci, there was an accumulation of fibroblasts, which is generally absent from healthy lung tissue.
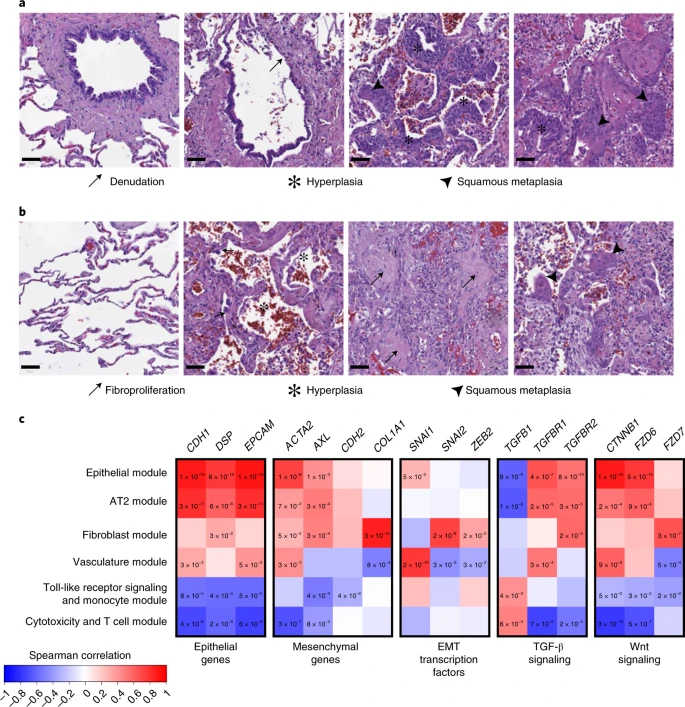
a,b, H&E-stained biopsies of the ciliated respiratory epithelium on bronchiole (a) and of alveolar space (b) in healthy lung (left) and the lung of patients with COVID-19 (middle and right). The samples of patients with COVID-19 are representative images from the staining of biopsies from three individuals and show loss of ciliated cell-lined bronchioles (denudation) and loss of alveolar monolayers populated by AT1 pneumocytes with few AT2 pneumocytes, with alveolar wall expansion and fine interstitial fibrosis. Scale bars, 50 µM. c, Spearman correlation of gene-expression profiles for EMT-related genes with the eigengenes of cell type modules identified by WGCNA analysis from spatially resolved expression data from the lung of patients with COVID-19. P values were identified by two-sided Hmisc analysis (without multiple test correction); values for significant correlations (P < 0.05) are shown and all correlation and P values are in the Source data.
We previously generated selective spatial transcriptomics from 46 areas of postmortem biopsies from patients with critical COVID-19 covering a spectrum of alveolar injury64. To explore the expression profiles of EMT-relevant genes we used both a cell deconvolution approach65, to estimate cell abundance through gene transcripts, and a weighted gene correlation network analysis66 (WGCNA), to identify modules of coregulated gene-expression patterns that were assigned to cell types or biological processes. As expected, epithelial marker genes (CDH1, EPCAM) were naturally associated with alveolar type (AT) 1 and AT2 pneumocytes, as well as both of the epithelial and AT2 pneumocyte WGCNA modules (Fig. 5c and Extended Data Fig. 10). However, AT1 was also positively associated with the hallmark EMT gene ACTA2 (actin alpha 2, smooth muscle; Hmisc rcorr asymptomatic P = 0.0014), as were both the AT2 and epithelial modules (P = 0.0069 and P = 9.59 × 10⁻⁹, respectively). These two modules were also positively associated with a second mesenchymal EMT marker gene, the receptor tyrosine kinase encoding AXL (P = 0.0002 and P = 0.0031). We next investigated EMT-associated transcription factors, finding SNAI1 (snail family transcriptional repressor 1) positively associated with the epithelial module (P = 0.0491) and AT1 cells (P = 0.0432), while fibroblasts were associated with SNAI2 (P = 1.08 × 10⁻⁶) and the fibroblast module was associated with both SNAI2 (P = 1.54 × 10⁻⁸) and ZEB2 (zinc finger E-box binding homeobox 2; P = 0.0144). Finally, we investigated the Wnt/β-catenin and TGF-β pathways, finding that both pneumocyte subtypes (AT1, AT2) and both epithelial modules were associated with TGF-β signaling receptor genes (TGFBR1 and TGFBR2) and Wnt signaling genes that encode β-catenin and frizzled receptors (CTNNB1 and FZD6). By contrast, neither CD8+ T cells nor the cytotoxicity and T cell module expressed epithelial or mesenchymal genes but they expressed TGFB1 (P = 0.0029 and P = 0.0005, respectively). The colocalized expression of mesenchymal genes with epithelial cells, along with the expression of EMT transcription factors and associated signaling pathways is indicative of the EMT process, highlighting the relevance of this cellular reorganization pathway in COVID-19. Therefore, the modulation of EMT by LZTFL1 may be of relevance to the pathological outcome of COVID-19 infection.
Discussion
We applied a machine learning and molecular biology platform for decoding GWAS hits and identified a relatively unstudied gene, LZTFL1, as a candidate causal gene potentially responsible for the twofold increased risk of respiratory failure from COVID-19 associated with 3p21.31. The risk allele of the SNP, rs17713054 A, leads to increased transcription through augmentation of an epithelial–endothelial–fibroblast enhancer, facilitated by the addition of a second CEBPB binding motif.
MCC identified LZTFL1 as the only gene to specifically interact with the rs17713054 enhancer. However, it is possible LZTFL1 may not be the sole causal gene at 3p21.31. Two TWAS identified 11 candidate genes at this locus10,49, including LZTFL1 and SLC6A20, but only these two genes have strong 3C contacts with the rs17713054 enhancer and lung eQTLs. TWAS cannot differentiate between direct and indirect regulation67. The absence of a 3C interaction with COVID-19 severity-associated variants suggests that there may be an indirect effect for other genes, with the caveat that it is possible that a direct effect may occur in an untested cell type. While the ultrahigh resolution MCC approach only identified physical contacts between LZTFL1 and rs17713054, traditional 3C found both CCR9 and SLC6A20 to be in the same regulatory domain. CCR9 is not expressed in the lung and rs17713054 is not in an active enhancer in immune cells, where CCR9 is expressed. Both LZTFL1 and SLC6A20 have higher expression in the presence of the rs17713054 risk allele; it is plausible that in cells where SLC6A20 is not Polycomb-repressed (for example, goblet cells and AT2 pneumocytes), it also directly interacts with the rs17713054 enhancer and would thus be affected by the risk allele.
The biological relevance of SLC6A20 to COVID-19 is unclear. It is primarily expressed in the kidneys and gastrointestinal tract and its associated Mendelian disease causes renal calculi due to failure of reuptake of glycine in the nephron44. Nevertheless, its function as an imino acid transporter is modulated by levels of angiotensin-converting enzyme 2 (ref. 68) (ACE2), which is a cell receptor for SARS-CoV-2 (ref. 69). Conversely, LZTFL1 is widely expressed in pulmonary epithelial cells, including ciliated epithelial cells, which have been identified as one of the main cellular targets for SARS-CoV-2 infection70. Furthermore, homozygous loss of LZTFL1 causes a classical ciliopathy––Bardet–Biedl syndrome46,47. The association of 3p21.31 variants with susceptibility to SARS-CoV-2 infection, as well as disease severity, highlights the importance of the respiratory epithelium for this locus11. LZTFL1 encodes a cytosolic leucine zipper protein, which associates with the epithelial marker E-cadherin and is involved in the trafficking of numerous signaling molecules45,71,72,73,74. We note that upregulation of LZTFL1 in the context of malignancy inhibits EMT45,59,60, a pathway known to be part of both wound healing and immune responses53,54,55,56.
Examination of postmortem COVID-19 lung biopsies demonstrated widespread epithelial dysfunction with EMT signatures62,63. Consistently, scRNA-seq showed a reduction in the total numbers of epithelial cells after infection75, with a lower epithelial composition correlating with a more rapid progression from symptom onset to death76. The samples analyzed in this study showed few areas of healthy tissue and it is possible that inflammation or neutrophil extracellular traps, rather than direct viral infection, was driving this epithelial dysfunction58 and that LZTFL1 acts earlier in disease progression, contributing to poor structural resolution of inflammation. Expression profiling of nasal epithelia from patients with COVID-19 detected EMT signals in the upper respiratory tract57. Similarly, SARS-CoV-2 infection of both a reconstructed human bronchial epithelium model and Syrian hamster induced dedifferentiation of airway ciliated cells77, highlighting the relevance of this pathway and cell type. As such, an effect of the 3p21.31 locus in the early epithelial response may contribute to susceptibility to SARS-CoV-2 infection11. Although both influenza and SARS-CoV-2 have been shown to induce EMT57,78, its role in viral infection is not entirely clear. While chronic EMT leads to fibrosis and severe inflammation, acute EMT may be a beneficial response. In the context of viral infection, EMT leads to a reduction of two of the cell receptors of SARS-CoV-2: ACE2 and transmembrane protease serine 2 (TMPRSS2) (refs. 57,79). A reduction in these cell surface markers as a result of EMT could reduce viral load by decreasing infection efficiency and preventing severe disease. Conversely, EMT allows for epithelial cells to proliferate, repair damaged tissue and replace lost cells, which may be required to overcome severe disease.
For the 3p21.31 COVID-19 risk locus, higher risk is associated with increased expression of LZTFL1, a known EMT inhibitor. Higher levels of LZTFL1 may delay the positive effects of an acute EMT response, blocking a reduction in ACE2 and TMPRSS2 levels and/or through slowing EMT-driven tissue repair. Further investigation of the potential role of LZTFL1 and EMT in pulmonary pathogenesis is needed. Our findings suggest that a gain-of-function variant in an inducible enhancer, causing increased expression of LZTFL1, may be associated with a worse outcome. This raises the possibility that LZTFL1 could be a potential therapeutic target for the treatment or prevention of COVID-19.
Methods
Human research ethics compliance
All samples and information were collected with written and signed informed consent. For erythroid cells, peripheral blood was obtained with approval from the North West Research Ethics Committee of the NHS National Research Ethics Services (03/08/097). Blood samples for CD4+ cells were obtained from donors recruited from the Cambridge BioResource. The study was approved by the East of England––Cambridgeshire and Hertfordshire Research Ethics Committee (05/Q0106/20). CD14+ samples were isolated from healthy donors with approval from the Oxfordshire Research Ethics Committee COREC (06/Q1605/55). Patient samples were acquired and analyzed with approval from the ethics committee of the University of Navarra (15/05/2020) and the Medical Sciences Interdivisional Research Ethics Committee of the University of Oxford (approval no. R76045/RE001). Hematopoietic stem and progenitor cells from healthy donors were stored in accordance with the Human Tissue Authority (license no. 12433).
Cell isolation, culture and stimulation
The H1-hESC (https://scicrunch.org/resolver/CVCL_9771) WA01 WiCell cell line (research resource identifier (RRID):CVCL_9771) was grown on Matrigel-coated (Corning) plates in mTeSR1 medium (STEMCELL Technologies). Cells were collected as a single-cell suspension using Accutase (Merck Millipore); fixation was carried out in mTeSR1 medium. Primary neonatal HUVECs (catalog no. CC-2517, Lonza; catalog no. C0035C, Gibco; catalog no. C-12200, PromoCell) were expanded in endothelial cell growth medium (Sigma-Aldrich) up to five passages according to the manufacturer’s protocol. For passaging, HUVECs were grown to 60% confluence, washed with Hanks’ Balanced Salt Solution at room temperature and subcultured after light trypsinization using trypsin-EDTA (Sigma-Aldrich) at room temperature with trypsin inhibitor (Sigma-Aldrich) added on rounding of the cells to achieve gentle release from the flask. HUVECs were fixed in Roswell Park Memorial Institute (RPMI) 1640 supplemented with 10% FCS. For erythroid cells, CD34+ hematopoietic stem and progenitor cells were isolated from the peripheral blood of 2 healthy males and 1 healthy female and differentiated ex vivo for 13 d as described previously82. CD4+ T cells were enriched from whole blood (93–99% pure, RosetteSep Human CD4+ T Cell Enrichment Cocktail; STEMCELL Technologies) and were plated at 250,000 cells per well in U-96 well plates (Greiner) and cultured in medium alone or stimulated with anti-CD3/CD28 T-activator beads (Dynabeads; Thermo Fisher Scientific) at a ratio of 0.3 beads per cell for 4 h at 37 °C in X-VIVO 15 (Lonza), 1% AB serum (Lonza) and penicillin-streptomycin (Thermo Fisher Scientific). Nonactivated or activated CD4+ T cells were pooled after 4 h of culture and fixed in growth medium. For CD14+ cells, peripheral blood mononuclear cells (PBMCs) were obtained by Ficoll-Paque (GE Healthcare) density centrifugation of whole blood collected into EDTA tubes (BD Vacutainer system) or leukocyte cones (NHS Blood and Transplant). Monocyte isolation was carried out by positive selection using magnetic-activated cell sorting with CD14+ beads (Miltenyi Biotec) according to the manufacturer’s instructions. IMR-90 (https://scicrunch.org/resolver/CVCL_0347) lung fibroblasts (CCL-186, RRID:CVCL_0347; ATCC) were cultured in Eagle’s minimal essential medium supplemented with 10% FCS, 1 mM of sodium pyruvate (Gibco), 1× MEM nonessential amino acids (Gibco) and penicillin-streptomycin (100 U ml−1 each). Cells were subcultured every 3 d after light trypsinization using 0.05% trypsin-EDTA (Gibco). Blood outgrowth endothelial cells (BOECs) were isolated as described previously83. Briefly 20–40 ml of fresh blood was diluted 1:1 with PBS, layered over Histopaque-1077 (Sigma-Aldrich) and centrifuged for 15 min at 500 g, brake off. PBMCs were washed with PBS then resuspended in EGM-2 BulletKit growth medium (Lonza) supplemented with 10% heat-inactivated FCS. Cells were cultured for 21–28 d in collagen-coated flasks until BOEC colonies formed. BOEC colonies were passaged by light trypsinization. BOEC cells were passaged twice before any experimentation to ensure endothelial cell purity, which was also confirmed by FACS and immunofluorescence. BOEC cells were fixed in growth medium. NCI-H441 (https://scicrunch.org/resolver/CVCL_1561) cells (HTB-174, RRID:CVCL_1561; ATCC) were grown in RPMI 1640 medium (Gibco) supplemented with 10% non-heat-inactivated FCS (Sigma-Aldrich) and 1% penicillin-streptomycin (Gibco); cells were given fresh medium every 2 d and passaged by light trypsinization twice weekly. Human umbilical derived erythroid progenitor line 2 cells84 (HUDEP-2 (https://scicrunch.org/resolver/CVCL_VI06), RRID:CVCL_VI06) were provided by RIKEN and were maintained at 0.7–1.5 × 10⁶ cells ml−1 in HUDEP expansion medium (serum-free expansion medium, 50 ng ml−1 of stem cell factor, 3 IU ml−1 of erythropoietin, 10 µM of dexamethasone, 1% L-glutamine, 1% penicillin-streptomycin) and changed into fresh medium containing 2× doxycycline every 2 d.
Variant effect sequence predictions
Linkage analysis was determined using the LDlink web tool v.5.1 (LDproxy, LDpair; https://ldlink.nci.nih.gov/). Candidate variants either achieved genome-wide significance in the first COVID-19 GWAS9 or were in tight linkage (r2 > 0.8) with lead variants from the first two large COVID-19 GWAS9,10. The deepHaem convolutional neural network19 was trained with 4,384 ENCODE peaks calls (694 open chromatin DNase I/ATAC-seq, 1,750 transcription factor ChIP-seq and 1,940 histone modification ChIP-seq) and is available via GitHub (model 4; https://github.com/rschwess/deepHaem). Identification of CEBPB motifs was performed by Find Individual Motif Occurrences (FIMO)85 analysis of reference and variant containing the enhancer sequence (chr3:45,817,661–45,818,660, hg38) with the JASPAR86 motif MA0466.1. Sasquatch40 was run using the default Workflow 3 settings (v1.0, 7-mer, propensity-based (erythroid), exhaustive) on the web interface (https://sasquatch.molbiol.ox.ac.uk/cgi-bin/foot.cgi). Masked SpliceAI18 predictions for each variant were extracted from the coding genome scan for substitutions, 1-base insertions and 1–4 base deletions (https://github.com/Illumina/SpliceAI). Conserved miRNA binding sites were identified using TargetScan25 (v7.2, http://www.targetscan.org/vert_71/). SNP predictions were identified using the miRdSNP26 database (v11.03, http://mirdsnp.ccr.buffalo.edu/browse-genes.php) and the MicroSNiPer27 web tool (release 19, http://vm24141.virt.gwdg.de/services/microsniper/index.php), using 6-mer, 7-mer, 8-mer and 9-mer settings.
Colocalization analysis
Harmonized summary statistics for severe COVID-19 (ref. 9) were downloaded from the GWAS Catalog87 (GCST90000256). Summary statistics for all lung eQTL–variant pairs (V8) in individuals with European-American ancestry were downloaded from the GTEx portal28. Coloc51 v.5.0.1 analysis of variants within 200 kb of the predicted causal variant (rs17713054) was implemented in R. Inputs of GWAS size (n = 3,795), GWAS case frequency (0.419), eQTL study size (n = 515) and association β, s.e.m., MAFs and z-scores were used in a sensitivity analysis88 that showed a prior probability of colocalization (p12) of 1 × 10⁻⁵ tested approximately equal prior probability of both H3 (two distinct causal variants for the GWAS and eQTL trait) and H4 (a single causal variant).
3C
Gene promoters were selected for Capture-C using 10-kb resolution Hi-C data on the 3D Genome Browser89 (http://3dgenome.fsm.northwestern.edu/index.html) from a range of cell types to identify putative regulatory domains and interactions with rs17713054. Capture-C was performed as described previously with either the NG or NuTi method20,21,90. Briefly 5–20 million cells were fixed with 2% formaldehyde and 3C libraries were generated using the high-resolution DpnII enzyme. Targeted enrichment was performed using SeqCap reagents (Roche) and 100-mer biotinylated oligonucleotides (Supplementary Table 2) at the optimal titrated concentration21. Libraries were sequenced using 75 bp paired-end reads on an Illumina NextSeq Platform to generate over 250,000 reads per viewpoint per sample. For MCC22, aliquots of 1–2 × 10⁷ cells were fixed for 10 min with 2% formaldehyde in 10 ml of growth medium. Formaldehyde was quenched with 125 mM of glycine and cells were pelleted (5 min, 500 g, 4 °C) and washed with PBS. Cells were resuspended in 1 ml of PBS and permeabilized with 0.005% digitonin. Cells were pelleted and resuspended in 800 µl of reduced calcium content micrococcal nuclease buffer (10 mM of Tris-HCl, pH 7.5, 1 mM of CaCl2). Chromatin was digested for 1 h at 37 °C inside intact, permeabilized cells in three separate reactions using 5–120 Kunitz units of micrococcal nuclease (New England Biolabs). Digestion was quenched by with 5 mM of EGTA (Sigma-Aldrich). Cells were pelleted and washed with PBS before end-repair and phosphorylation; cells were resuspended in 400 µl of DNA ligase buffer (Thermo Fisher Scientific) supplemented with 400 µM of each of deoxyATP, deoxyCTP, deoxyGTP and deoxyTTP and 5 mM of EGTA, 200 U ml−1 of T4 Polynucleotide Kinase (New England Biolabs) and 100 U ml−1 DNA Polymerase I, Large (Klenow) Fragment (New England Biolabs) for 2 h at 37 °C. To ligate DNA fragments, T4 DNA ligase (Thermo Fisher Scientific) was added at 300 U ml−1 and the reaction was incubated at room temperature for 8 h. Chromatin was de-crosslinked with proteinase K at 65 °C for over 4 h and DNA was extracted using either phenol chloroform with RNase treatment (Roche) and ethanol precipitation or using the DNeasy Blood and Tissue Kit (QIAGEN). MCC libraries were sonicated to 200-bp fragments and indexed using NEBNext Ultra II indexing reagents (New England Biolabs) with the following modifications: 2 µg of DNA was indexed; 5 µl of adapter was used; bead cleanups were performed with 1.5 volumes of AMPure XP beads; and Herculase II PCR reagents (Agilent) were used for the indexing PCR. Target enrichment was performed using double capture with 120-bp biotinylated oligonucleotides (Supplementary Table 3) with SeqCap Reagents (Roche). Enriched libraries were sequenced on the NextSeq platform using 150-bp paired-end reads to generate approximately 1 M reads per viewpoint.
3C data analysis
NuTi Capture-C data were mapped to the hg38 using CCseqBasicS91 (v5, https://github.com/Hughes-Genome-Group/CCseqBasicS) using Bowtie 2. Briefly, CCseqBasic5 (ref. 92) trims adapter sequences, flashes read pairs, digests fragments in silico and uses map reads before identifying sequences as either capture and reporter. Replicates were compared using CaptureCompare93 (v1, https://github.com/Hughes-Genome-Group/CaptureCompare), which normalizes cis reporter counts per 100,000 cis reporters, generates per-fragment mean counts for each cell type and then bins reporter counts in equally sized regions to generate a windowed profile. For MCC, adapters were removed using TrimGalore94 v.0.3.1, then fragments were reconstructed with FLASH95 v.1.2.11 into single sequences using the central area of overlapping reads. Fragments were mapped to the oligonucleotide DNA sequence ±350 bp using BLAT96 v.35 to identify ligation junctions, allowing splitting of reads into new paired FASTQ files using MCCsplitter.pl v1 and subsequent mapping to hg38 with Bowtie 2 (ref. 97) v.2.3.5. PCR duplicates were removed from the alignment files with MCCanalyser.pl v1 using both sonicated ends and ligation junction with a wobble of ±2 bp. MCCsplitter.pl and MCCanalyser.pl are available for academic use through the Oxford University Innovation software store (https://process.innovation.ox.ac.uk/software/p/16529a/micro-capture-c-academic/1). MCC tissue-specific peaks for rs17713054 were called using LanceOtron98 on the web tool ‘Find and Score Peaks with Inputs’ (v2, https://lanceotron.molbiol.ox.ac.uk) using the HUDEP-2 MCC profile as an input track.
Genome editing
For the deletion of the rs17713054 enhancer, cells were transfected with 5 µg of Alt-R S.p. Cas9 nuclease V3 RNP (Integrated DNA Technologies) and 0.1 nmol each of two guide RNAs (Supplementary Table 4). All transfections were carried out with 1–2 × 10⁵ cells in 20-µl reactions using a 4D-Nucleofector (Lonza); IMR-90 fibroblast cells were electroporated using Amaxa Cell Line Nucleofector Kit V reagents (Lonza) with program CM-120. HUVECs and BOECs were electroporated using Amaxa P5 Primary Cell 4D-Nucleofector X Kit S reagents (Lonza) with program CA-167 and H441 epithelial cells were electroporated using P3 Primary Cell 4D-Nucleofector X Kit S reagents (Lonza) with program EL-10. Cells were cultured for 24 h in 2 ml of antibiotic-free growth medium in a single well of a 6-well plate before expansion in fully supplemented media. Bulk DNA was extracted using the DNeasy Blood and Tissue Kit and the edited region (chr3:45,817,769–45,818,459; hg38) was amplified using the Platinum PCR SuperMix (Invitrogen) with 5′-GGAAAGAACACGCATAAACCATA-3′ (forward primer) and 5′-CTCATCCCACAGTGAACTAAGAA-3′ (reverse primer). Editing efficiency was determined using a D1000 TapeStation and Sanger sequencing with the forward primer and Synthego ICE analysis (https://ice.synthego.com/#/).
RT–qPCR
For expression analysis, cells were grown to >80% confluence in a single well of a 6-well plate. Cells were lysed by adding 1 ml of TRI Reagent (Sigma-Aldrich), snap-frozen and stored at −80 °C for less than 6 months. RNA was separated by adding 100 µl of 1-bromo-3-chloropropane, centrifuged in a Phase Lock Gel Heavy tube (5Prime) for 5 min at 10,000 g and precipitated in an equal volume of isopropanol (500 µl) with 1 µl of GlycoBlue (Thermo Fisher Scientific). DNA was removed using the DNA-free DNA Removal Kit (Invitrogen) and complementary DNA (cDNA) was generated using 1 µg of total RNA with SuperScript III First-Strand Synthesis SuperMix reagents (Thermo Fisher Scientific). qPCR was performed using a 1:10 dilution of cDNA, TaqMan Universal PCR Master Mix II without UNG (Thermo Fisher Scientific) and TaqMan Gene Expression Assays (Thermo Fisher Scientific) for LZTFL1 (Hs00947898_m1), SLC6A20 (Hs00610960_m1) and RPL18 (Hs00965812_g1) with FAM dye label. LZTFL1 expression was normalized to RPL18 and relative expression calculated by normalizing to the mean expression of LZTFL1 in RNP-treated cells from samples of the same cell type processed in the same batch.
ChIP-seq
For ChIP-seq, single-cell suspensions of 106 cells ml−1 in growth medium were generated after light trypsin treatment. Cells were fixed by adding 1% formaldehyde for 10 min at room temperature, which was quenched by adding glycine at a final concentration of 125 mM. Fixed cells were washed with PBS and snap-frozen. Cell lysis and immunoprecipitation was carried out using the ChIP Assay Kit (Merck Millipore) on 5 × 10⁶ cells in 2 ml of dilution buffer incubated overnight at 4 °C with 1 µl of rabbit polyclonal anti-H3K27ac (1:2,000 dilution; catalog no. ab4729, 0.3 µg, Abcam). DNA was isolated by phenol/chloroform isoamyl alcohol extraction and ethanol precipitation then indexed using the NEBNext Ultra II DNA Library Prep Kit for Illumina (New England Biolabs). Libraries were sequenced using 39-bp paired-end reads on a NextSeq platform. Reads were mapped to hg38 using Bowtie 2 (ref. 97), PCR duplicates filtered using SAMtools99 and BigWig files generated with deepTools100 v2.2.2.
FACS analysis
For FACS, approximately 105 cells were resuspended in 100 µl of staining buffer (PBS with 10% FCS) and incubated with 1 µl each of allophycocyanin-conjugated mouse anti-CD14 (1:100 dilution, 2 ng, clone M5E2, catalog no. 301807; BioLegend), phycoerythrin-conjugated mouse anti-CD309/VEGFR2 (1:100 dilution, 2 ng, clone 7D4-6, catalog no. 359903; BioLegend), fluorescein isothiocyanate (FITC)-conjugated mouse anti-CD31/PECAM (1:100 dilution, 2 ng, clone WM59, catalog no. 303103; BioLegend) and PE/Cyanine7-conjugated mouse anti-CD34 (1:100 dilution, 0.5 ng, clone 561, catalog no. 343616; BioLegend) for 20 min at 4 °C. Cell were diluted with 90 µl of staining buffer with 1:5,000 Hoechst 33258 (Thermo Fisher Scientific) and analyzed on an Attune NxT Flow Cytometer. Voltages and compensation were set using single-stain samples with UltraComp eBeads (Thermo Fisher Scientific) for antibodies and cells for Hoechst. Negative and positive populations were established using fluorescence minus one controls. Mononuclear cells were gated using forward scatter (FSC) and side scatter; single cells were gated using FSC-area and FSC-height and live cells were selected using a Hoechst-negative gate in FlowJo v.10.7.
ATAC-seq
ATAC-seq was performed as published elsewhere101,102 with 7.5 × 10⁴ cells per technical replicate and 2–4 technical replicates per samples. After spinning at 500 g for 15 min, cells were resuspended in lysis buffer (10 mM of Tris-HCl, pH 7.5, 10 mM of NaCl, 3 mM of MgCl2, 0.1% IGEPAL CA-630), centrifuged and nuclei washed with PBS. Nuclei were pelleted, PBS was discarded and nuclei were resuspended in tagmentation buffer (25 µl of 2× tagmentation DNA buffer, 2.5 µl of Tn5 Transposase (Illumina) and 22.5 µl of water) then incubated at 37 °C for 30 min. After transposition DNA was extracted using the MinElute PCR Purification Kit (QIAGEN), half the DNA was amplified for sequencing using the NEBNext High-Fidelity 2× PCR Master Mix (New England Biolabs) and further purified with the QIAquick PCR Purification Kit (QIAGEN). Libraries were sequenced using 39-bp paired-end reads on a NextSeq platform. Reads were mapped to hg38 using Bowtie 2 in NGseqBasic102 v20.
Immunofluorescence staining and microscopy
Cells were grown for 24–48 h on sterilized coverslips under standard growth conditions and fixed in 4% vol/vol paraformaldehyde in 0.25 M of HEPES for 15 min, followed by permeabilization in 0.2% vol/vol Triton X-100 in PBS for 10 min. After blocking with 10% vol/vol FCS in PBS, von Willebrand’s factor was detected using mouse anti-von Willebrand’s factor 1:100 (clone F8/86, catalog no. MA5-14029; Invitrogen) and goat anti-mouse Alexa Fluor 488 1:500 (catalog no. A32723; Thermo Fisher Scientific). DNA was stained with 1 µg ml−1 of 4,6-diamidino-2-phenylindole (DAPI) in PBS; after washing, coverslips were mounted in VECTASHIELD (Vector Laboratories). Widefield fluorescence imaging was performed on a DeltaVision Elite system (Applied Precision) using a Universal Plan Fluorite 40× 1.30 numerical aperture oil immersion objective (Olympus), a CoolSnap HQ2 charge-coupled device camera (Photometrics) and DAPI (excitation 390/18, emission 435/40) and FITC (excitation 475/28, emission 525/45) filters; 12-bit image stacks were acquired with a z-step of 200 nm giving a voxel size of 161.3 × 161.3 × 200 nm. All images were acquired using the same exposure settings. Using Fiji103 v2.1.0, three-dimensional images were flattened by maximum intensity projection and displayed at the same minimum/maximum intensity settings. Images were cropped for publication in Adobe Photoshop v.22.4.1.
Patients tissue analyses
Healthy lung samples were sourced from patients with chronic obstructive pulmonary disease during lung tumor resection, with a sample of normal lung acquired away from the tumor. The medical records of patients with COVID-19 were reviewed retrospectively104 and 3 were selected for in-depth analysis based on their clinical manifestation of acute respiratory distress syndrome, typical COVID-19 histology (with a 4–5 score on the Brescia-COVID Respiratory Severity Scale) and a lung-restricted (absence in heart, liver and kidney biopsies) presence of SARS-CoV-2. Postmortem lung tissues were obtained through open biopsy shortly after death and processed as described previously104. Briefly, tissues were immediately fixed in neutral-buffered formalin for <24 h and then paraffin-embedded. Sections (5 µm each) were cut from wedge biopsies (mean size = 1.78 cm2, s.d. = 0.55 cm2) for hematoxylin and eosin (H&E) analysis. Sections were analyzed by NanoString GeoMx Digital Spatial Profiling with normalization and downstream analysis by WGCNA66 and cell deconvolution65 as described previously64. For deconvolution with SpatialDecon in R v.1.0.0, cell profiles were obtained from the Human Cell Atlas healthy lung and scRNA-seq-appended with neutrophil data105 using the R ‘Lung_plus_neut’ dataset. Seven relevant cell types were selected for expression analysis from a total of 26 cell types. WGCNA was performed using the WGCNA R package v.1.70-3 and generated 17 biologically assignable modules of which 6 were selected for further analysis. Spearman correlation and unadjusted P value generation was performed with the Hmisc R package v.4.5-0 and visualized with corrplot v.0.84.
Public dataset analysis
Unless stated, ENCODE datasets were accessed using the UCSC Genome Browser106,107, which was also used to generate track figures. ENCODE DNase I BigWig files (hg38) were downloaded from the ENCODE portal (https://www.encodeproject.org/) and analyzed with deepTools100 (multiBigwigSummary; https://deeptools.readthedocs.io/en/develop/content/tools/multiBigwigSummary.html). Capture-C was analyzed using the CaptureCompendium suite v191 mapping to hg38 with Bowtie 2 (ref. 97) and using default settings. ATAC-seq and H3K27ac ChIP-seq data from erythroid progenitors, immune cells29,80,81 and aortic endothelium37 were downloaded from the Gene Expression Omnibus (GEO) (accession nos. GSE74912, GSE115684, GSE118189, GSE139377) and analyzed using NGseqBasic102 with default settings for Bowtie 2 (ref. 97). Aortic endothelial samples were genotyped by counting two or more reads from either allele in the combined ATAC-seq and ChIP-seq data. For allelic skew analysis, aortic endothelium ATAC-seq from heterozygous individuals was mapped with Bowtie 2 (ref. 97) and processed using WASP v0.3.4108 to correct for reference genome mapping bias. Three replicates with fewer than four remaining reads were excluded from the analysis. Mature erythroid chromatin modification and CTCF data (GSE125926) were previously reported by our group16, CTCF motifs were identified using the MEME Suite85 tools (v5.3.0, meme--dna--nmotifs 1--w 19--mod zoops--maxsize 1102788; fimo--thresh 1e-4--motif 1). scRNA-seq data35,48 were sourced from online portals (Lung Cell Atlas https://asthma.cellgeni.sanger.ac.uk/, Gene Expression Profiling https://www.lungepigenome.org/gene-expression/) on 9 October 2020 and 19 May 2021, respectively. scATAC-seq data34,35 were sourced from online portals (descartes https://descartes.brotmanbaty.org/bbi/human-chromatin-during-development/dataset/lung, Lung Genome Browser https://www.lungepigenome.org/) on 19 May 2021. The GTEx Project was supported by the Common Fund of the Office of the Director of the National Institutes of Health and by the National Cancer Institute, National Human Genome Research Institute, National Heart, Lung, and Blood Institute, National Institute on Drug Abuse, National Institute of Mental Health and National Institute of Neurological Disorders and Stroke. The multi-tissue eQTL and expression level data were obtained from the GTEx Portal V8 on the 14 October 2020 (https://gtexportal.org/home/snp/rs17713054).
Reporting Summary
Further information on research design is available in the Nature Research Reporting Summary linked to this article.
Data availability
Capture-C, Micro Capture-C, ATAC-seq and ChIP-seq data generated for this study (Fig. 3, Extended Data Figs. 7 and 9 and Supplementary Figs. 1 and 2) are available from the GEO under accession nos. GSE159867 and GSE175791). Processed Capture-C data can be visualized on the UCSC Genome Browser (http://datashare.molbiol.ox.ac.uk//datashare/project/fgenomics/publications/Downes_2021_Covid_GWAS/hub.txt) or on the CaptureSee website (https://capturesee.molbiol.ox.ac.uk/projects/capture_compare/3718). Numerical values for Figs. 2a–c and 5d and Extended Data Figs. 2–4, 6, 7, 9 and 10 are available in the Source data. Expression data (Fig. 3 and Extended Data Figs. 6 and 8) was from publicly available sources: GTEx Portal (https://gtexportal.org); Lung Cell Atlas (https://asthma.cellgeni.sanger.ac.uk/); and Lung Genome Browser (https://www.lungepigenome.org/). Publicly available open chromatin data (ATAC-seq/DNase-seq), transcription factor binding data (ChIP-seq) and epigenetic modification (ChIP-seq) data (Figs. 1 and 2, Extended Data Figs. 1, 2, 4–7 and 9 and Supplementary Figs. 1 and 2) were sourced from the ENCODE portal (https://www.encodeproject.org/), the GEO (accession nos. GSE74912, GSE115684, GSE118189, GSE125926), the UCSC Genome Browser (https://genome.ucsc.edu), descartes Human Chromatin Accessibility during Development atlas (https://descartes.brotmanbaty.org/bbi/human-chromatin-during-development/); and the Lung Genome Browser. Masked splicing prediction effects were downloaded from the SpliceAI database (https://github.com/Illumina/SpliceAI). The CEBPB motif (MA0466.1) was downloaded from the JASPAR database (http://jaspar.genereg.net). Conserved miRNA sites were identified on miRdSNP (http://mirdsnp.ccr.buffalo.edu/browse-genes.php). Source data are provided with this paper.
Code availability
All custom analysis code and links to software are available on GitHub (https://github.com/Hughes-Genome-Group/Downes_2021_LZTFL1_Covid.git). MCCsplitter.pl and MCCanalyser.pl are only available for academic use through the Oxford University Innovation software store (https://process.innovation.ox.ac.uk/software/p/16529a/micro-capture-c-academic/1).
References
Zhu, N. et al. A novel coronavirus from patients with pneumonia in China, 2019. N. Engl. J. Med. 382, 727–733 (2020).
Dong, E., Du, H. & Gardner, L. An interactive web-based dashboard to track COVID-19 in real time. Lancet Infect. Dis. 20, 533–534 (2020).
Marini, J. J., Hotchkiss, J. R. & Broccard, A. F. Bench-to-bedside review: microvascular and airspace linkage in ventilator-induced lung injury. Crit. Care 7, 435–444 (2003).
Levi, M., Thachil, J., Iba, T. & Levy, J. H. Coagulation abnormalities and thrombosis in patients with COVID-19. Lancet Haematol. 7, e438–e440 (2020).
Varga, Z. et al. Endothelial cell infection and endotheliitis in COVID-19. Lancet 395, 1417–1418 (2020).
Ackermann, M. et al. Pulmonary vascular endothelialitis, thrombosis, and angiogenesis in COVID-19. N. Engl. J. Med. 383, 120–128 (2020).
Visscher, P. M. et al. 10 years of GWAS discovery: biology, function, and translation. Am. J. Hum. Genet. 101, 5–22 (2017).
King, E. A., Wade Davis, J. & Degner, J. F. Are drug targets with genetic support twice as likely to be approved? Revised estimates of the impact of genetic support for drug mechanisms on the probability of drug approval. PLoS Genet. 15, e1008489 (2019).
Ellinghaus, D. et al. Genomewide association study of severe COVID-19 with respiratory failure. N. Engl. J. Med. 383, 1522–1534 (2020).
Pairo-Castineira, E. et al. Genetic mechanisms of critical illness in COVID-19. Nature 591, 92–98 (2021).
COVID-19 Host Genetics Initiative. Mapping the human genetic architecture of COVID-19. Nature, https://doi.org/10.1038/s41586-021-03767-x (2021).
Zeberg, H. & Pääbo, S. The major genetic risk factor for severe COVID-19 is inherited from Neanderthals. Nature 587, 610–612 (2020).
Nakanishi, T. et al. Age-dependent impact of the major common genetic risk factor for COVID-19 on severity and mortality. J. Clin. Invest., https://doi.org/10.1172/JCI152386 (2021).
Nafilyan, V. et al. Ethnic differences in COVID-19 mortality during the first two waves of the Coronavirus Pandemic: a nationwide cohort study of 29 million adults in England. Eur. J. Epidemiol. 36, 605–617 (2021).
Intensive Care National Audit & Research Centre. COVID-19 in critical care: England, Wales and Northern Ireland (2021).
Downes, D. J. et al. An integrated platform to systematically identify causal variants and genes for polygenic human traits. Preprint at bioRxiv https://doi.org/10.1101/813618 (2019).
Hindorff, L. A. et al. Potential etiologic and functional implications of genome-wide association loci for human diseases and traits. Proc. Natl Acad. Sci. USA 106, 9362–9367 (2009).
Jaganathan, K. et al. Predicting splicing from primary sequence with deep learning. Cell 176, 535–548.e24 (2019).
Schwessinger, R. et al. DeepC: predicting 3D genome folding using megabase-scale transfer learning. Nat. Methods 17, 1118–1124 (2020).
Davies, J. O. J. et al. Multiplexed analysis of chromosome conformation at vastly improved sensitivity. Nat. Methods 13, 74–80 (2016).
Downes, D. J. et al. High-resolution targeted 3C interrogation of cis-regulatory element organisation at genome-wide scale. Nat. Commun. 12, 531 (2021).
Hua, P. et al. Defining genome architecture at base-pair resolution. Nature 595, 125–129 (2021).
Robertson, C. C. et al. Fine-mapping, trans-ancestral and genomic analyses identify causal variants, cells, genes and drug targets for type 1 diabetes. Nat. Genet. 53, 962–971 (2021).
Patsopoulos, N. A. et al. Multiple sclerosis genomic map implicates peripheral immune cells and microglia in susceptibility. Science 365, eaav7188 (2019).
Agarwal, V., Bell, G. W., Nam, J.-W. & Bartel, D. P. Predicting effective microRNA target sites in mammalian mRNAs. eLife 4, e05005 (2015).
Bruno, A. E. et al. miRdSNP: a database of disease-associated SNPs and microRNA target sites on 3′UTRs of human genes. BMC Genomics 13, 44 (2012).
Barenboim, M., Zoltick, B. J., Guo, Y. & Weinberger, D. R. MicroSNiPer: a web tool for prediction of SNP effects on putative microRNA targets. Hum. Mutat. 31, 1223–1232 (2010).
Aguet, F. et al. The GTEx Consortium atlas of genetic regulatory effects across human tissues. Science 369, 1318–1330 (2020).
Calderon, D. et al. Landscape of stimulation-responsive chromatin across diverse human immune cells. Nat. Genet. 51, 1494–1505 (2019).
Thurman, R. E. et al. The accessible chromatin landscape of the human genome. Nature 489, 75–82 (2012).
Kelley, D. R., Snoek, J. & Rinn, J. L. Basset: learning the regulatory code of the accessible genome with deep convolutional neural networks. Genome Res. 26, 990–999 (2016).
Zhou, J. & Troyanskaya, O. G. Predicting effects of noncoding variants with deep learning-based sequence model. Nat. Methods 12, 931–934 (2015).
Bozhilov, Y. K. et al. A gain-of-function single nucleotide variant creates a new promoter which acts as an orientation-dependent enhancer-blocker. Nat. Commun. 12, 3806 (2021).
Domcke, S. et al. A human cell atlas of fetal chromatin accessibility. Science 370, eaba7612 (2020).
Wang, A. et al. Single-cell multiomic profiling of human lungs reveals cell-type-specific and age-dynamic control of SARS-CoV2 host genes. eLife 9, e62522 (2020).
Phan, L. et al. ALFA: Allele Frequency Aggregator (National Center for Biotechnology Information, U.S. National Library of Medicine, 2020); www.ncbi.nlm.nih.gov/snp/docs/gsr/alfa/
Stolze, L. K. et al. Systems genetics in human endothelial cells identifies non-coding variants modifying enhancers, expression, and complex disease traits. Am. J. Hum. Genet. 106, 748–763 (2020).
Hendricks-Taylor, L. R. et al. The CCAAT/enhancer binding protein (C/EBPα) gene (CEBPA) maps to human chromosome 19q13.1 and the related nuclear factor NF-IL6 (C/EBPβ) gene (CEBPB) maps to human chromosome 20q13.1. Genomics 14, 12–17 (1992).
Dunham, I. et al. An integrated encyclopedia of DNA elements in the human genome. Nature 489, 57–74 (2012).
Schwessinger, R. et al. Sasquatch: predicting the impact of regulatory SNPs on transcription factor binding from cell- and tissue-specific DNase footprints. Genome Res. 27, 1730–1742 (2017).
Uehara, S., Grinberg, A., Farber, J. M. & Love, P. E. A role for CCR9 in T lymphocyte development and migration. J. Immunol. 168, 2811–2819 (2002).
Liao, F. et al. STRL33, a novel chemokine receptor-like protein, functions as a fusion cofactor for both macrophage-tropic and T cell line-tropic HIV-1. J. Exp. Med. 185, 2015–2023 (1997).
Agostini, C. et al. Role for CXCR6 and its ligand CXCL16 in the pathogenesis of T-cell alveolitis in sarcoidosis. Am. J. Respir. Crit. Care Med. 172, 1290–1298 (2005).
Bröer, S. et al. Iminoglycinuria and hyperglycinuria are discrete human phenotypes resulting from complex mutations in proline and glycine transporters. J. Clin. Invest. 118, 3881–3892 (2008).
Wei, Q. et al. Tumor-suppressive functions of leucine zipper transcription factor-like 1. Cancer Res. 70, 2942–2950 (2010).
Zaghloul, N. A. & Katsanis, N. Mechanistic insights into Bardet-Biedl syndrome, a model ciliopathy. J. Clin. Invest. 119, 428–437 (2009).
Marion, V. et al. Exome sequencing identifies mutations in LZTFL1, a BBSome and smoothened trafficking regulator, in a family with Bardet–Biedl syndrome with situs inversus and insertional polydactyly. J. Med. Genet. 49, 317–321 (2012).
Vieira Braga, F. A. et al. A cellular census of human lungs identifies novel cell states in health and in asthma. Nat. Med. 25, 1153–1163 (2019).
Pathak, G. A. et al. Integrative genomic analyses identify susceptibility genes underlying COVID-19 hospitalization. Nat. Commun. 12, 4569 (2021).
Yao, Y. et al. Genome and epigenome editing identify CCR9 and SLC6A20 as target genes at the 3p21.31 locus associated with severe COVID-19. Signal Transduct. Target. Ther. 6, 85 (2021).
Giambartolomei, C. et al. Bayesian test for colocalisation between pairs of genetic association studies using summary statistics. PLoS Genet. 10, e1004383 (2014).
Mali, P. et al. RNA-guided human genome engineering via Cas9. Science 339, 823–826 (2013).
Dongre, A. & Weinberg, R. A. New insights into the mechanisms of epithelial–mesenchymal transition and implications for cancer. Nat. Rev. Mol. Cell Biol. 20, 69–84 (2019).
Kalluri, R. & Weinberg, R. A. The basics of epithelial-mesenchymal transition. J. Clin. Invest. 119, 1420–1428 (2009).
Lamouille, S., Xu, J. & Derynck, R. Molecular mechanisms of epithelial–mesenchymal transition. Nat. Rev. Mol. Cell Biol. 15, 178–196 (2014).
Thiery, J. P., Acloque, H., Huang, R. Y. J. & Nieto, M. A. Epithelial–mesenchymal transitions in development and disease. Cell 139, 871–890 (2009).
Stewart, C. A. et al. Lung cancer models reveal severe acute respiratory syndrome coronavirus 2–induced epithelial-to-mesenchymal transition contributes to coronavirus disease 2019 pathophysiology. J. Thorac. Oncol. https://doi.org/10.1016/j.jtho.2021.07.002 (2021).
Pandolfi, L. et al. Neutrophil extracellular traps induce the epithelial–mesenchymal transition: implications in post-COVID-19 fibrosis. Front. Immunol. 12, 663303 (2021).
Wei, Q. et al. LZTFL1 suppresses lung tumorigenesis by maintaining differentiation of lung epithelial cells. Oncogene 35, 2655–2663 (2016).
Wang, L. et al. LZTFL1 suppresses gastric cancer cell migration and invasion through regulating nuclear translocation of β-catenin. J. Cancer Res. Clin. Oncol. 140, 1997–2008 (2014).
Yang, J. et al. Guidelines and definitions for research on epithelial–mesenchymal transition. Nat. Rev. Mol. Cell Biol. 21, 341–352 (2020).
He, J. et al. Single-cell analysis reveals bronchoalveolar epithelial dysfunction in COVID-19 patients. Protein Cell 11, 680–687 (2020).
Borczuk, A. C. et al. COVID-19 pulmonary pathology: a multi-institutional autopsy cohort from Italy and New York City. Mod. Pathol. 33, 2156–2168 (2020).
Cross, A. R. et al. Spatial transcriptomic characterization of COVID-19 pneumonitis identifies immune pathways related to tissue injury. Preprint at bioRxiv https://doi.org/10.1101/2021.06.21.449178 (2021).
Danaher, P. et al. Advances in mixed cell deconvolution enable quantification of cell types in spatially-resolved gene expression data. Preprint at bioRxiv https://doi.org/10.1101/2020.08.04.235168 (2020).
Langfelder, P. & Horvath, S. WGCNA: an R package for weighted correlation network analysis. BMC Bioinformatics 9, 559 (2008).
Gusev, A. et al. Integrative approaches for large-scale transcriptome-wide association studies. Nat. Genet. 48, 245–252 (2016).
Singer, D. et al. Defective intestinal amino acid absorption in Ace2 null mice. Am. J. Physiol. Gastrointest. Liver Physiol. 303, 686–695 (2012).
Vuille-dit-Bille, R. N. et al. Human intestine luminal ACE2 and amino acid transporter expression increased by ACE-inhibitors. Amino Acids 47, 693–705 (2015).
Ravindra, N. G. et al. Single-cell longitudinal analysis of SARS-CoV-2 infection in human airway epithelium identifies target cells, alterations in gene expression, and cell state changes. PLoS Biol. 19, e3001143 (2021).
Promchan, K. & Natarajan, V. Leucine zipper transcription factor-like 1 binds adaptor protein complex-1 and 2 and participates in trafficking of transferrin receptor 1. PLoS ONE 15, e0226298 (2020).
Starks, R. D. et al. Regulation of insulin receptor trafficking by Bardet Biedl syndrome proteins. PLoS Genet. 11, e1005311 (2015).
Wei, Q. et al. Lztfl1/BBS17 controls energy homeostasis by regulating the leptin signaling in the hypothalamic neurons. J. Mol. Cell Biol. 10, 402–410 (2018).
Seo, S. et al. A novel protein LZTFL1 regulates ciliary trafficking of the BBSome and Smoothened. PLoS Genet. 7, e1002358 (2011).
Melms, J. C. et al. A molecular single-cell lung atlas of lethal COVID-19. Nature 595, 114–119 (2021).
Delorey, T. M. et al. COVID-19 tissue atlases reveal SARS-CoV-2 pathology and cellular targets. Nature 595, 107–113 (2021).
Robinot, R. et al. SARS-CoV-2 infection induces the dedifferentiation of multiciliated cells and impairs mucociliary clearance. Nat. Commun. 12, 4354 (2021).
Ruan, T. et al. H1N1 influenza virus cross-activates Gli1 to disrupt the intercellular junctions of alveolar epithelial cells. Cell Rep. 31, 107801 (2020).
Hoffmann, M. et al. SARS-CoV-2 cell entry depends on ACE2 and TMPRSS2 and is blocked by a clinically proven protease inhibitor. Cell 181, 271–280.e8 (2020).
Corces, M. R. et al. Lineage-specific and single-cell chromatin accessibility charts human hematopoiesis and leukemia evolution. Nat. Genet. 48, 1193–1203 (2016).
Ludwig, L. S. et al. Transcriptional states and chromatin accessibility underlying human erythropoiesis. Cell Rep. 27, 3228–3240.e7 (2019).
Scott, C. et al. Recapitulation of erythropoiesis in congenital dyserythropoietic anaemia type I (CDA-I) identifies defects in differentiation and nucleolar abnormalities. Haematologica, https://doi.org/10.3324/haematol.2020.260158 (2020).
Martin-Ramirez, J., Hofman, M., van den Biggelaar, M., Hebbel, R. P. & Voorberg, J. Establishment of outgrowth endothelial cells from peripheral blood. Nat. Protoc. 7, 1709–1715 (2012).
Kurita, R. et al. Establishment of immortalized human erythroid progenitor cell lines able to produce enucleated red blood cells. PLoS ONE 8, e59890 (2013).
Bailey, T. L. et al. MEME Suite: tools for motif discovery and searching. Nucleic Acids Res. 37, W202–W208 (2009).
Fornes, O. et al. JASPAR 2020: update of the open-access database of transcription factor binding profiles. Nucleic Acids Res. 48, D87–D92 (2020).
Buniello, A. et al. The NHGRI-EBI GWAS Catalog of published genome-wide association studies, targeted arrays and summary statistics 2019. Nucleic Acids Res. 47, D1005–D1012 (2019).
Wallace, C. Eliciting priors and relaxing the single causal variant assumption in colocalisation analyses. PLoS Genet. 16, e1008720 (2020).
Wang, Y. et al. The 3D Genome Browser: a web-based browser for visualizing 3D genome organization and long-range chromatin interactions. Genome Biol. 19, 151 (2018).
Downes, D. J. & Hughes, J. R. Chromosome conformation capture with nuclear titrated Capture-C (NuTi Capture-C). Protoc. Exch. https://doi.org/10.21203/rs.3.pex-1244/v1 (2020).
Telenius, J. M. et al. CaptureCompendium: a comprehensive toolkit for 3C analysis. Preprint at bioRxiv https://doi.org/10.1101/2020.02.17.952572 (2020).
Telenius, J. M., Davies, J. O. J. & Hughes, J. R. Hughes-Genome-Group/CCseqBasicS: Release for DOI https://zenodo.org/record/4196777#.YWQkYBDMKWY (2020).
Downes, D. J. et al. CaptureCompare https://zenodo.org/record/4194345#.YWQk_hDMKWY (2020).
Krueger, F. Trim Galore https://www.bioinformatics.babraham.ac.uk/projects/trim_galore/ (2015).
Magoč, T. & Salzberg, S. L. FLASH: fast length adjustment of short reads to improve genome assemblies. Bioinformatics 27, 2957–2963 (2011).
Kent, W. J. BLAT—the BLAST-like alignment tool. Genome Res. 12, 656–664 (2002).
Langmead, B. & Salzberg, S. L. Fast gapped-read alignment with Bowtie 2. Nat. Methods 9, 357–359 (2012).
Hentges, L. D., Sergeant, M. J., Downes, D. J., Hughes, J. R. & Taylor, S. LanceOtron: a deep learning peak caller for ATAC-seq, ChIP–seq, and DNase-seq. Preprint at bioRxiv https://doi.org/10.1101/2021.01.25.428108 (2021).
Li, H. et al. The Sequence Alignment/Map format and SAMtools. Bioinformatics 25, 2078–2079 (2009).
Ramírez, F. et al. deepTools2: a next generation web server for deep-sequencing data analysis. Nucleic Acids Res. 44, W160–W165 (2016).
Buenrostro, J. D., Giresi, P. G., Zaba, L. C., Chang, H. Y. & Greenleaf, W. J. Transposition of native chromatin for fast and sensitive epigenomic profiling of open chromatin, DNA-binding proteins and nucleosome position. Nat. Methods 10, 1213–1218 (2013).
Telenius, J. M. & Hughes, J. R. NGseqBasic––a single-command UNIX tool for ATAC-seq, DNaseI-seq, Cut-and-Run, and ChIP–seq data mapping, high-resolution visualisation, and quality control. Preprint at bioRxiv https://doi.org/10.1101/393413 (2018).
Schindelin, J. et al. Fiji: an open-source platform for biological-image analysis. Nat. Methods 9, 676–682 (2012).
Recalde-Zamacona, B. et al. Histopathological findings in fatal COVID-19 severe acute respiratory syndrome: preliminary experience from a series of 10 Spanish patients. Thorax 75, 1116–1118 (2020).
Desai, N. et al. Temporal and spatial heterogeneity of host response to SARS-CoV-2 pulmonary infection. Nat. Commun. 11, 6319 (2020).
Kent, W. J. et al. The human genome browser at UCSC. Genome Res. 12, 996–1006 (2002).
Rosenbloom, K. R. et al. ENCODE data in the UCSC Genome Browser: year 5 update. Nucleic Acids Res. 41, D56–D63 (2013).
van de Geijn, B., Mcvicker, G., Gilad, Y. & Pritchard, J. K. WASP: allele-specific software for robust molecular quantitative trait locus discovery. Nat. Methods 12, 1061–1063 (2015).
Acknowledgements
We thank P. Hirschfeld, M. Gosden, S. Carpenter, C. Harrold, L. Nussbaum, Y. Bozhilov, A. King, M. Badat, M. Salmon, L. Hentges, A. Brown, G. Scozzafava, A. Lledó Lara, T. Rostron, J. Torres, C. Eijsbouts, V. Iotchkova and M. Sergeant for their help with cell culture, experiments and data analysis, R. Beagrie for critical reading of the manuscript and D. Higgs for nurturing this research. This GWAS approach was developed as part of the Wellcome Investigation of Genome Wide Association Mechanisms Consortium funded by a Wellcome Strategic Award (no. 106130/Z/14/Z to J.R.H.). This work was also supported by Medical Research Council (MRC) Core Funding (no. MC_UU_00016/14 to J.R.H.). D.J.D. received funding from the Oxford University Medical Science Internal Fund: Pump Priming (no. 0006152). R.S. was supported by a Wellcome Doctoral Programme (no. 203728/Z/16/Z). S.N.S. received Kennedy Trust for Rheumatology Research Core support (no. KENN171803). F.I. received support from the Wellcome (no. 211122/Z/18/Z). J.O.J.D. is funded by an MRC Clinician Scientist Award (no. MR/R008108) and received Wellcome support (no. 098931/Z/12/Z). J.C.K. is a Wellcome Investigator (no. WT204969/Z/16/Z) and is supported by the National Institute for Health Research Oxford Biomedical Research Centre and the Chinese Academy of Medical Sciences Innovation Fund for Medical Science (no. 2018-I2M-2-002). A.M.M., D.R.G. and S.C.H. received support from the Wellcome (no. 110579/Z/15/Z). J.A.T. is supported by a Strategic Award from the Wellcome (no. 107212/Z/15/Z), Juvenile Diabetes Research Foundation (nos. 5-SRA-2015-130-A-N and 4-SRA-2017-473-A-N) and Wellcome Core Award to the Wellcome Centre for Human Genetics (no. 203141/Z/16/Z). C.E.d.A. and I.M. were supported by the Banco Bilbao Vizcaya Foundation ‘Ayudas a Equipos de Investigación Científica SARS-CoV-2 y COVID-19’. The funders had no role in study design, data collection and analysis, decision to publish or preparation of the manuscript.
Author information
Authors and Affiliations
Consortia
Contributions
D.J.D., A.J.C., O.M., N.R. and A.M.M. isolated, cultured and fixed the cells and processed 3C material. D.J.D., P.H., A.R.C., J.B., C.E.d.A., I.M., F.I. and J.O.J.D. designed and performed the experiments. D.J.D., P.H., A.R.C., R.S., J.B. and S.N.S. analyzed the data. C.E.d.A., I.M., D.R.G., S.C.H., J.C.K., J.A.T., F.I. and J.R.H. acquired the funding and oversaw the project. D.J.D., J.O.J.D. and J.R.H. conceived the work, generated the figures and wrote the manuscript.
Corresponding authors
Ethics declarations
Competing interests
J.R.H. and J.O.J.D. are founders and shareholders of Nucleome Therapeutics; J.R.H., J.O.J.D., D.J.D. and R.S. are paid consultants for Nucleome Therapeutics. J.R.H. and J.O.J.D. hold patents for Capture-C (nos. WO2017068379A1, EP3365464B1 and US10934578B2) and have a patent application for MCC. J.A.T. is a member of the GSK Human Genetics Advisory Board. The other authors declare no competing interests.
Additional information
Peer review information Nature Genetics thanks Luis Barreiro and the other anonymous, reviewer(s) for their contribution to the peer review of this work. Peer reviewer reports are available.
Publisher’s note Springer Nature remains neutral with regard to jurisdictional claims in published maps and institutional affiliations.
Extended data
Extended Data Fig. 1 3p21.31 severe COVID-19 locus SNPs are not in immune regulatory elements.
a, To decode GWAS variants either all genome wide significant variants and/or variants in linkage disequilibrium with sentinel variants are assessed for protein coding changes with ANNOVAR. Remaining variants are then assessed for changes in splicing of expressed genes using the SpliceAI machine learning approach18 or splicing quantitative trait loci (sQTL). Variants are then intersected with open chromatin with a panel of disease relevant cell types to asses cis-regulatory element altering potential. This potential is assessed for effects on open chromatin with deepHaem19 or transcription factor binding with both deepHaem and Sasquatch40. Finally, variants in enhancers are linked to target effector genes using high resolution chromosome conformation capture with NG/NuTi Capture-C20,21 or Micro Capture-C22. b, Heatmap of linkage disequilibrium (European; EUR) between a severe COVID-19 lead SNP (rs11385942) with lead SNPs for other GWAS traits identified in the region (chr3:45,710,500-45,954-500, hg38). c, Linkage analysis for a 3p21.31 severe COVID-19 lead SNP (rs11385942 - circle) showing variants within 100 kb and r2 > 0.2. No variants with r2 > 0.6 were seen beyond this range. d, Overlaid tracks of ATAC-seq from sorted populations of resting (blue) and stimulated (red) immune cells29. Overlapping signal appears black. Abbreviations: Memory (Mem.), Immature (Imm.), Mature (Mat.), Natural Killer cells (NK), Plasmacytoid Dendritic cells (pDC), Myeloid Dendritic cells (mDC), Monocytes (Mono.), Effector (Eff.), Helper (H.), Regulatory (Reg.), and Central (C.). Region: chr3:45,800,000-45,870,000, hg38.
Extended Data Fig. 2 DNase I accessibility over COVID-19 SNPs.
a. DNase I signal in each of 95 ENCODE datasets for rs17713054 (chr3:45,817,661-45,818,660, hg38) and rs7634459 (chr3:45,859,001-45,859,500, hg38) which were found in open chromatin. Datasets are grouped according to cell-type, numbers indicate tissue of origin (see panel c). Violin plots of ENCODE DNase I accessibility over rs17713054 grouped by cell type (b) and tissue of origin (c). Each sample is shown as a red dot, dashed lines show mean, dotted lines show quartiles.
Extended Data Fig. 3 deepHaem prediction of de novo open chromatin elements.
deepHaem19 negative damage scores, which predict gain-of-accessibility, for the 28 candidate COVID-19 severity variants in 694 cell-types. Positive scores (loss-of-function) were adjusted to zero. In general, variants generating de novo regulatory elements33 have scores lower than -0.1, which was not true for any variant in any cell type.
Extended Data Fig. 4 rs76374459 is likely benign in an erythroid enhancer.
ATAC-seq from progenitor80 and differentiating erythroid cells81. Haematopoietic Stem Cells (HSC), Multi-Potent Progenitors (MPP), Common Myeloid Progenitors (CMP), Myeloid-Erythroid Progenitors (MEP) from bone marrow or peripheral blood and erythroid Colony Forming Units (CFU-E), Pro-erythroblasts (ProE1, ProE2), Basophilic Erythroblasts (BasoE), Polychromatic Erythroblasts (PolyE), Orthochromatic Erythroblasts (OrthoE) and Orthochromatic/Reticulocytes (OrthoRet). ChIP-seq tracks from CD71+ CD23+ mature erythroid cells16 show presence of marks associated with active transcription (H3K27ac), enhancers (H3K4me1), promoters (H3K4me3) and boundaries (CTCF). b, deepHaem damage score for the risk-C allele versus non-risk-G allele of rs76374459 associated with severe COVID-19 in 694 cell-types. rs763774458 is found in open chromatin through-out erythropoiesis. A positive score predicts loss of accessibility, a negative score predicts increased accessibility.
Extended Data Fig. 5 Single nucleus ATAC-seq in adult lungs.
Chromium single nucleus ATAC-seq from non-diseased adult lung35 (n = 3) with 17 epithelial, endothelial, mesenchymal and hematopoietic populations, including Alveolar Type (AT) 1 and 2 Pneumocytes, Macrophage (MΦ) and Natural Killer (NK) cells. The rs17713054 containing element is highlighted in grey.
Extended Data Fig. 6 Pulmonary expression and binding analysis of CEBPB.
a, GTEx top five expressed tissues for CEBPB. For violin plots, minima and maxima are the top and bottom of the violin, black lines show means, ends of the pale regions denote first and third quartiles, and black dots denote outliers. Data from independent samples for Whole blood (n = 755), Lung (n = 578), Adipose (n = 541), Fallopian Tube (n = 9), Artery (n = 663). b, Chromium single nucleus RNA-seq from non-diseased adult lung35 (n = 3 independent samples) with 22 epithelial, endothelial and mesenchymal populations, including Alveolar Type (AT) 1 and 2 Pneumocytes and Pulmonary Neuroendocrine cells (PNECs). c, 10x Genomics Chromium droplet single-cell RNA sequencing (scRNA-seq) from upper and lower airways and lung parenchyma34 from healthy volunteers or deceased transplant donors with ten epithelial populations (i) with expression profiles for CEBPB (ii). d, ENCODE ChIP-seq for CEBPB in A549 alveolar basal epithelial adenocarcinoma cells, HeLa cells, and IMR-90 lung fibroblast cells with inset region (chr3:45,805,000-45,855,000; hg38) showing the rs17713054 containing enhancer. e, DeepHeam ChIP-seq binding prediction score for CEBPB in lung fibroblast (IMR-90), alveolar basal epithelial adenocarcinoma (A549), the erythroleukaemia line (K562), human endothelial kidney cells (HEK293), and the GM12878 lymphoblastoid cell line (LCL) predicts increased binding to the risk-A allele.
Extended Data Fig. 7 LZTFL1 is a direct target of rs17713054.
a, NuTi Capture-C and Micro Capture-C from the rs17713054 enhancer in Endothelial cells (HUVEC) shows specific interaction with only the promoter of LZTFL1 and an upstream CTCF site. CTCF track shows binding of the CCCTC-binding factor which acts as a boundary. b, ENCODE ChIP-seq for the active chromatin mark (H3K27ac), the repressive chromatin mark (H3K27me3) and EZH2, a member of the Polycomb Repressive Complex 2, in endothelial (HUVEC) and normal human lung fibroblast (NHLF) cells. Green bar denotes the 3C regulatory domain as identified by 3 C analysis. c, ENCODE DNase I seq tracks from a range of cell types and tissues, including airway epithelium and bronchial epithelium, where the rs17713054 enhancer is active. In these cell types the LZTFL1 promoter is DNase I accessible, but neither the CCR9 promoter nor the SLC6A20 promoter are. Region shown is chr3: 45,730,000-45,930,000 (hg38). d, Paired accessibility analysis of read counts per kilobase (RPK) over the LZTFL1 and SLC6A20 promoters and the rs17713054 enhancer in 156 ENCODE, immune and erythroid open chromatin datasets. Only the LZTFL1 promoter is widely accessible in the same cells as the affected enhancer.
Extended Data Fig. 8 Expression and eQTL analysis of 3p21.31 candidate lung effector genes.
a, Genomic position of genes identified as 3p21.31 candidate causal genes with method of identification, including two TWAS10,49. b, GTEx whole lung RNA-seq expression profiles for candidate causal genes as transcripts per million (TPM) with rs17713054 eQTL two-sided P value for lung. For violin plots, minima and maxima are the top and bottom of the violin, black lines show means, ends of the pale regions denote first and third quartiles, and black dots denote outliers. n = 578 independent samples. c, Chromium single nucleus RNA-seq35 from non-diseased adult lung (n = 3), including Alveolar Type 1 (AT1) and Type 2 (AT2) Pneumocytes and Pulmonary Neuroendocrine cells (PNECs).
Extended Data Fig. 9 CRISPR-Cas9 deletion of the rs17713054 enhancer.
a, ENCODE DNase I-seq in HUVEC and IMR-90 cells and ATAC-seq in Blood Outgrowth Endothelial Cells (BOECs) and H441 epithelial cells showing the rs17713054 containing enhancer with schematic of generated deletions and short guide RNA (sgRNA) binding sites. b, Example D1000 trace of genotyping PCR product amplified from cells transfected with Cas9 protein only, Cas9 protein with sgRNA1 + 2 (∆108), or Cas9 protein with sgRNA1 + 3 (∆191). c, Example Sanger sequencing trace following ICE analysis over the sgRNA1 and sgRNA2 binding sites in unedited cells, and the double strand break repair site in cells containing the 108 bp deletions. sgRNA sequence shown by black boxes, protospacer adjacent motif sites shown with red letters. d, Calculated deletion efficiency for each sgRNA pair and cell type. Transfections failing to achieve >70% deletion (blue circles) were excluded from expression analyses. n shown are for independent transfections e, Expression of LZTFL1 normalized to RPS18 and expressed as relative to the mean expression in Cas9 only treated cells for each cell type. Corrected P values from an ordinary one-way ANOVA with Dunnett’s multiple comparisons test. n shown are for independent samples from at least 3 independent transfections. For d,e bars show mean and one standard deviation. f, ChIP-seq for the active transcription marker (H3K27ac) was performed in umbilical vein endothelial cells (HUVECs), blood outgrowth endothelial cells (BOECs), H441 lung epithelial cells, and IMR-90 lung fibroblast cells. The rs17713054 enhancer (grey box, g) lacks strong modification under standard growth conditions in these cells.
Extended Data Fig. 10 COVID-19 patient lungs show signals of EMT.
Spearman correlation of gene expression profiles for EMT-related genes with the cell-types identified by deconvolution. AT1: Alveolar Type 1 pneumocytes, AT2: Alveolar Type 2 pneumocytes. P values were identified by two-sided Hmisc analysis (without multiple test correction), values for significant correlations are shown and all correlation and P values are in Source Data.
Supplementary information
Supplementary information
Supplementary Figs. 1 and 2 and Tables 1–4.
Source data
Source Data Fig. 2
Statistical Source Data for Fig. 2.
Source Data Fig. 5
Statistical Source Data for Fig. 5.
Source Data Extended Data Fig. 2
Statistical Source Data for Extended Data Fig. 2.
Source Data Extended Data Fig. 3
Statistical Source Data for Extended Data Fig. 3.
Source Data Extended Data Fig. 4
Statistical Source Data for Extended Data Fig. 4.
Source Data Extended Data Fig. 6
Statistical Source Data for Extended Data Fig. 6.
Source Data Extended Data Fig. 7
Statistical Source Data for Extended Data Fig. 7.
Source Data Extended Data Fig. 9
Statistical Source Data for Extended Data Fig. 9.
Source Data Extended Data Fig. 10
Statistical Source Data for Extended Data Fig. 10.
Rights and permissions
Springer Nature or its licensor (e.g. a society or other partner) holds exclusive rights to this article under a publishing agreement with the author(s) or other rightsholder(s); author self-archiving of the accepted manuscript version of this article is solely governed by the terms of such publishing agreement and applicable law.
About this article

Cite this article
Downes, D.J., Cross, A.R., Hua, P. et al. Identification of LZTFL1 as a candidate effector gene at a COVID-19 risk locus. Nat Genet 53, 1606–1615 (2021). https://doi.org/10.1038/s41588-021-00955-3
Received:
Accepted:
Published:
Issue Date:
DOI: https://doi.org/10.1038/s41588-021-00955-3
This article is cited by
-
Next-generation sequencing of host genetics risk factors associated with COVID-19 severity and long-COVID in Colombian population
Scientific Reports (2024)
-
Causality between COVID-19 and multiple myeloma: a two-sample Mendelian randomization study and Bayesian co-localization
Clinical and Experimental Medicine (2024)
-
Role of the Neanderthal Genome in Genetic Susceptibility to COVID-19: 3p21.31 Locus in the Spotlight
Biochemical Genetics (2024)
-
Evaluation of Genetic or Cellular Impairments in Type I IFN Immunity in a Cohort of Young Adults with Critical COVID-19
Journal of Clinical Immunology (2024)
-
Age-specific nasal epithelial responses to SARS-CoV-2 infection
Nature Microbiology (2024)
