
Abstract
Achieving a thorough understanding of the determinants of household water consumption is crucial to support demand management strategies. Yet, existing research on household water consumption determinants is often limited to specific case studies, with findings that are difficult to generalize and not conclusive. Here, we first contribute an updated framework for review, classification, and analysis of the literature on the determinants of household water consumption. Our framework allows trade-off analysis of different criteria that account for the representation of a potential water consumption determinant in the literature, its impact across heterogeneous case studies, and the effort required to collect information on it. We then review a comprehensive set of 48 publications with our proposed framework. The results of our trade-off analysis show that distinct groups of determinants exist, allowing for the formulation of recommendations for practitioners and researchers on which determinants to consider in practice and prioritize in future research.
Introduction
As urbanization is increasing globally, with trends that are unlikely to stabilize in the next decades1,2, water demand-side management strategies are emerging as key interventions to manage the current and future urban metabolism, and realize the potential of water conservation in cities3,4,5.
The domestic sector uses one of the largest portions of water in cities6,7. Therefore, achieving a thorough understanding of how, when, and how much water is used in households is of the upmost importance for water authorities and policy makers alike to design effective demand-side management strategies and inform future urban planning8. Knowledge of the behaviour surrounding water demand is vital to positively influence water conservation9 and to implement effective and enforceable water demand management strategies. Additionally, better knowledge and improved predictions of water demands also allow water authorities to better size new water storage, distribution, and treatment infrastructure, as well as plan future upgrades of current systems10.
Recent literature has shown that there is a large number of climate and socio-demographic variables, attitudes, beliefs, and other factors that can vary between different households and can potentially influence water consumption. These factors, called determinants, can all influence household water use in different ways. In addition, the collection of data on each determinant is just as varied as the determinant itself. Some, such as average temperature, are readily accessible on a regional scale and can be obtained and analysed with ease11,12,13. Others, such as people’s perception of behavioural control, are difficult to capture. They represent subjective and stated information, rather than measurable observations, and often require detailed surveys with multiple questions, followed by lengthy and time-consuming analysis, to determine whether any information can be inferred from the survey data14,15.
The advent of advanced metering infrastructure (or smart meters) provides unprecedented access to high spatial and temporal resolution information on water consumption16,17,18. As smart metering is becoming more and more common and accessible on a global scale19,20, it provides the opportunity to greatly increase knowledge on the different potential factors driving household water consumption21,22.
Despite the advances described above, most of the state-of-the-art determinant analyses to date are often limited to a few case studies, and the existing findings are difficult to generalize and not conclusive. More research is needed to explore the trade-offs among different criteria that account for the relevance of potential determinants for water consumption modelling and management, their proven impact on heterogeneous case studies, and the cost of labour and/or of equipment required to collect information about a determinant. While previous studies have already performed literature reviews or meta analysis to identify key determinants of household water consumption and household water demand modelling, they usually only provide a descriptive analysis of the literature, without proposing analytic tools, quantitative trade-off analysis, and recommendations for both practitioners and researchers8,9,20,23,24,25,26,27. Furthermore, following the need for more data with a higher granularity also highlighted by some of these previous studies, the literature has seen numerous recent developments enabled by smart metering information. Here, we contribute an updated framework for review, classification, and analysis of the literature on household water consumption determinants. We also comprehensively analyze 48 peer-reviewed scientific publications focused on the identification and analysis of the determinants of household water consumption, selected after application of exclusion criteria from a larger data base of 231 papers analyzed for contextual information. Water consumption data recorded at the individual household level became only recently available, with the development of smart metering studies. Yet, previous residential water consumption studies included domestic water consumption data aggregated at coarser spatial scales. The set of reviewed papers includes studies using water consumption data gathered at different scales, from individual households to census tract/municipality level, depending on data availability.
The ultimate goal of this review is to identify which determinants have proven impact via extensive research and, thus, are recommended for consideration in practical applications related to household water consumption characterization, modelling, and prediction. After identifying these proven-impact determinants, the other determinants identified are those that require more research to fill existing gaps related to validation over multiple case studies, impact evaluation, and assessment of the costs and benefits of gathering information on a particular determinant. Specifically, the contribution of this review is three-fold. First, we develop a multi-criteria assessment framework for analyzing the key determinants that influence household water demand. Assessment criteria include their popularity in the literature, impact on household water consumption, and cost for determinant quantification. Second, we apply the proposed assessment framework to a comprehensive set of state-of-the-art studies to derive insights about the predominant determinants of household water consumption. Finally, we provide a classification system of household water use determinants and recommendations for researchers and practitioners that can be used to inform future research and applications.
Paper search and exclusion criteria
To gain an understanding of the current state of research on the determinants of household water consumption, we systematically searched for peer-reviewed journal papers and technical reports and comprehensively reviewed the state-of-the-art literature following a three-step procedure.
We first searched for the combinations of keywords reported in Fig. 1 in the subject/title/abstract of papers published in the last 40 years and stored in the Elsevier “Engineering Village” databases28. These keywords returned a search of over 8200 papers, requiring the “limit to” feature to be used to narrow the search. This allows most irrelevant topics to be filtered and removed from the search, reducing the list of papers to 4326 (See Supplementary Notes 1 for the full list of removed keywords).
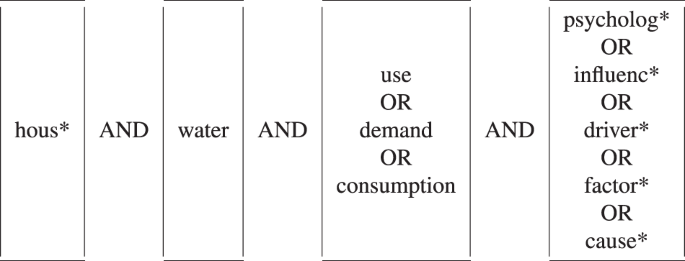
The represented query was used to search for papers on the determinants of household water consumption published in the last 40 years and stored in the Elsevier “Engineering Village” databases28. Subject, title, and abstract fields were considered for the initial search.
Second, we manually screened the title and abstract of each paper from the reduced sample of 4326 paper, checking for relevance within the scope of our study. This expert based screening for consistency returned a total of 231 papers referred to as general water consumption-related set of papers (see Supplementary References for the complete list). Some of these general water consumption-related papers are commonly cited within the literature found in the search. We reference them in the motivation of this study or discussion surrounding the results, but they were not necessarily analysed as part of the water consumption determinant assessment framework.
Finally, we reviewed all the general water consumption-related papers to determine if they actually analysed determinants against water use results, which is the main requirement for a paper to be included in our systematic review. Additionally, we formulated the following exclusion criteria:
-
(i)
We excluded papers that focus on water consumption in non-residential settings, including public buildings or touristic facilities29,30. However, we kept studies considering residential water consumption data or determinant data at the aggregate level for residential groups (e.g., census tracts).
-
(ii)
We excluded papers that focus on theoretical models or self reported data, without quantitative comparison to actual (metered) water consumption data31,32.
-
(iii)
We excluded papers that examine only a single type of indoor end use (e.g., only shower usage33).
-
(iv)
We excluded papers that do not focus on analysing determinants to water use, but were otherwise water related. These included papers with a primary focus on water use behaviour change, water restriction compliance, water efficient appliance uptake, water use estimation accuracy, or water price elasticity, without quantitative analysis of the determinants-to-water consumption relationship34,35,36,37,38,39.
-
(v)
We included papers that examined water consumption in both households and apartments. However, studies centred on just apartments (which often use water only indoor) were deemed to be beyond the scope of the review and were not included40.
As a result of the application of the above selection procedure, a database of 48 papers was compiled as the final set for systematic review and formulation of our assessment framework. This set of papers is hereafter referred to as framework analysis papers (see Supplementary Table 1).
Water consumption determinant assessment framework
In this study, we developed a two-phase comprehensive assessment framework to analyze the water consumption determinants reported in the framework analysis set of papers. At the conceptual level, the first phase of our framework, i.e., the determinant classification, is aimed at characterizing the nature of the identified water consumption determinants (e.g., physical, psychological) and categorizing them in groups based on their similarities, independently from their influence on water consumption. The second phase, named determinant analysis, is aimed at assessing the influence of different determinants in relation to water consumption, along with their relevance in the literature, and the effort required to retrieve them. The categories and attributes we defined for determinant classification and analysis are described in the next sections.
Determinant classification
We defined three main categories to classify the water consumption determinants: observable, latent, and external.
Observable determinants are defined as those determinants that can be physically seen or measured. They can be easily and/or directly measured and include objective features related to the occupants of the household and their house (e.g., occupant age, household size, household income, number of toilets).
Latent determinants relate to the way the occupants of the household think, feel, or act. Typically, they cannot be directly measured and need to be inferred from surveys/direct questions, and they can be subjective. Examples include attitude to water saving, individual habits, and beliefs.
External determinants are external to the house and might influence a suburb or groups of houses at a regional level. Examples might include weather variables, such as rainfall and/or temperature.
These three categories were used to facilitate the characterization and analysis of the determinants found in the literature, both in terms of ease of information gathering and impact on water consumption. For instance, observable determinants are generally easier to collect information on and, therefore, are expected to be more common in literature than latent determinants. External determinants often influence houses on a suburb or higher level, whereas observable determinants may have a different impact on every house on a street41. An overview of the determinant classification system is provided in Fig. 2. As shown in the figure, we further separated each of the three categories above into sub-categories to group the individual determinants that were closely related into the same categories. A detailed summary of the sub-categories, the determinants included, and the question defining each determinant are reported in Table 1 (observable determinants), Table 2 (latent determinants), and Table 3 (external determinants). The category of observable determinants is further broken down into three sub-categories, i.e., socio-demographic (relating to the people inside the household), house (relating to the structure of the house itself), and yard characteristics (relating to the yard and its irrigation). Latent determinants are further separated into the following categories: gardening, awareness, perception, habits, and other. External determinants are sub-classified depending on the variable of interest, i.e., average temperature, average rainfall, water price, and other. This sub-categorization is primarily useful for discovering latent determinants, because it enables specific questions related to subjective behavioral attitudes and/or habits to be grouped and analysed together. However, due to the low number of papers for each individual question, the analyses for the latent determinants is mainly undertaken at the category level.

Potential water use determinants are classified in three categories, namely observable, latent, and external. Observable determinants are defined as those determinants that can be physically seen or measured. Latent determinants relate to the way the occupants of the household think, feel, or act. External determinants are external to the house and might influence a suburb or groups of houses at a regional level.
Determinant analysis
After extracting and categorising the determinants of household water consumption from each paper in the framework analysis set, we assessed the influence of different determinants in relation to water consumption, along with their relevance in the literature, and effort required to retrieve them. The goal of this determinant analysis phase is to find the trade-off among how much a determinant has been studied in the literature, how much it impacts water demand, and the cost required to obtain information about this determinant, relating to both labour and equipment. We defined three criteria to perform the determinant analysis: representation, impact, and effort.
Representation refers to how popular a determinant is in the reviewed literature on household water consumption. The representation R of a determinant i is thus defined as its relative frequency in the set of framework analysis papers:
where Ni is the number of times a determinant i appeared in the studies considered and T is the total number of framework analysis papers (i.e., 48).
Impact refers to whether or not a particular determinant actually influences the water use in a household. If the measurement and inclusion of a determinant was found to change the accuracy of a prediction or have some other effect on the household water demand, then the determinant was said to have impact. Given a potential determinant of water consumption and the study where it was mentioned, we defined three possible categories of impact:
-
(i)
Yes (Y). Impact found and analyzed: determinant information was collected in the study, numerical analysis was undertaken (e.g., statistical analysis, regression) and the determinant was found to have an impact on demand/predictability by the authors of the paper.
-
(ii)
No/Low (NL). Impact found and analyzed: determinant information was collected in the study, numerical analysis was undertaken (e.g., statistical analysis, regression), but the determinant was found to have no or low impact on demand/predictability.
-
(iii)
Collected, but not analyzed (CNA). Determinant information was collected in the study, but no analysis was undertaken for one or a number of reasons, such as lack of sufficient data or not selecting the determinant as a focus. Studies containing determinants that fall in this category also analyzed other determinants falling in the previous two categories. For this reason, they were not excluded from the framework analysis set of papers. Despite collecting data on several determinants, these studies only performed quantitative analysis for a subset of determinants. This category does not include determinants that were only superficially mentioned (e.g., in the paper introduction) and, thus, did not refer to the specific case study analyzed in the paper.
A blanket “Yes” rating was given to all determinants where impact was found. This was done rather than assigning a low, medium, high impact rating because each paper used a different technique for assessing impact. This means that different metrics are used in different papers, hampering a direct comparison and grouping determinants into individual impact categories. Some papers, such as11 and7, compare determinants to other determinants in the paper, whereas other papers use statistics to determine which determinants have a larger impact. Some build mathematical models for impact assessment, such as structural equation models42,43,44, or multiple linear regression13,45,46. We defined the impact I of a determinant i as follows:
where \({N}_{i}^{\,{{\mbox{Yes}}}\,}\) is the number of papers where the determinant i is given a “Yes” rating and \({T}_{i}^{\,{{\mbox{(Yes + No)}}}\,}\) is the total of papers with “Yes” and “No” impact rating for determinant i. This excluded papers where the determinant had a CNA impact rating, because there was no definitive impact from this determinant from the papers that mentioned it.
Effort refers to the cost of labour and/or of equipment required to collect information about a determinant. For the purposes of this paper, effort is divided into three categories, i.e., Low, Medium, and High (Table 4). A low rating means that the information on the determinant is easily available for each house and can be obtained via a desktop study, with no interaction with the households needed. In contrast, the high effort rating corresponds to actually visiting the house and taking measurements and/or surveys.
In cases where the paper did not explicitly state the effort required to collect the information on the determinant, we assigned a low effort rating, assuming that no special effort was required (i.e., no ad hoc procedure for data gathering needed to be set up and described). Each of the categories is quantified by a corresponding effort rating factor, based on an estimate of the number of hours of labour required to collect information on a given determinant. This rating factor was then scaled such that the low rating is coupled with an effort rating factor equal to 1 (see more details in the Supplementary Notes 2). For a given determinant i, the overall effort rating Ei was determined by calculating the geometric mean of the effort rating across the analyzed papers:
where Ni,L, Ni,M, and Ni,H are the number of studies reporting determinant i with an associated low (L), medium (M), and high (H) effort, respectively, and Ti is the total number of papers reporting determinant i. We used the geometric mean, rather than the arithmetic mean, because the effort rating factor varies across two orders of magnitude.
Outcomes
Overview of paper search outcome
A general overview of the 231 general water consumption-related and 48 framework analysis scientific publications reviewed in this study (Fig. 3) shows that the number of papers published per year from the general water consumption-related set has been increasing, particularly since the early 2000s. Peaks of more than 10 papers per year in this category emerge since 2011, with a maximum peak of 34 papers recorded in 2018. This increasing trend in time can be attributed to the increasing development of smart metering studies, which have been increasingly allowing detailed household water demand/consumption and behavioral analysis20,47. As a selected subset of the general water consumption-related papers set, the number of framework analysis papers has also increased in the last decade, compared to the ’80s and ’90s, constituting up to 5 papers per year. The final set of papers includes small-case studies comprising only a few units (11 individual households are considered as a minimum in48), as well as large-scale studies comprising several thousands of households (e.g., more than 8000 individual households are considered in49), or entire communities/towns50.

The yearly count of the 231 general water consumption-related (blue) and 48 framework analysis (orange) scientific publications reviewed in this study is represented for the last forty years.
Figure 4 shows the locations of the studies from the framework analysis set, with larger blue dots indicating more studies. The geographical distribution of the reviewed studies indicates that the interest in the determinants of water use is worldwide. Prominent interest emerges in particular areas, such as the US west coast, the east coast of Australia, and the Mediterranean area in Europe, perhaps reflecting the combination of areas more prone to drought and/or having the higher economic capacity to undertake water use related research.

The location of the 48 framework analysis papers reviewed in this study is represented with blue markers. Marker size is proportional to the amount of studies in a specific location.
Determinant representation by class
From the analysis of the 48 framework analysis papers, we identified a range of heterogeneous determinants and quantified different combinations of determinant classes, namely observable, latent, and external (see Determinant classification). Figure 5 shows an overview of the representation for the different classes of determinants over the 48 analyzed papers. Observable determinants were the most popular (47 total studies, i.e., 98% representation), with latent and external having lower representation of 52% and 56%, respectively. The values represented in the figure confirm our hypotheses that observable determinants are more common in literature than latent determinants, due to their availability in public databases, either at the household level or at coarser spatial sub-urban scales (e.g., census data collected at the block group-level, such as those used in49). The slightly higher representation of external determinants, compared to latent determinants, is also as expected due to the widespread availability of weather records (e.g., temperature, rainfall) from national or international environmental agencies. While there is no full consensus in the literature on the effect of weather or price variables on water consumption51,52,53, the high degree of representation of external determinants demonstrates that they are considered in more than half of the studies.

The representation of different classes of determinants (observable, latent, and external) in the 48 reviewed framework analysis papers is represented with coloured circles. Intersections are also visualized. The size of each circle and the numerical labels indicate the number of studies in which each combination of determinant classes appeared.
It is worth observing that multiple classes of determinants are simultaneously analyzed in most of the reviewed studies, with fewer than 20% analyzing observable variables alone. Further, almost every time external or latent variables are considered, they appear in combination with observable variables. Only one study specifically focused on analyzing the motivations for using and conserving water based on only latent determinants42, while no studies exclusively considered external variables. In contrast, nearly 30% of the studies included both observable and external variables, approximately 23% of the studies considered latent and external variables simultaneously, and 27% of the studies included all three types of determinant classes.
The high representation of observable determinants (Fig. 5) suggests that observable variables are widespread in the literature on modelling and forecasting of household water consumption. The prevalence of this class of determinants seems also to confirm the findings from previous studies, which demonstrated that meteorological variables have a greater influence on medium-term prediction and urban/suburban scales, but socio-demographics become more relevant when household-scale and short-term water demand models are developed54,55.
Individual determinant representation, impact, and effort
To facilitate interpretation of the numerical values we obtained for the three determinant assessment criteria (i.e., representation, impact, and effort) we defined some regions of interest for each criterion based on thresholds (see the regions labelled as low/high/very high in Fig. 6). We selected the threshold values used to delimit the above regions of interest based on visual inspection of the empirical distribution of the representation, impact, and effort values. This simplification is carried out to facilitate the inference of general qualitative conclusions, while accounting for the low number of papers and, at the same time, high number of determinants. As a result, representation values above/below 30% are considered high/low. Impact values below 75% are considered low, values between 75% and 90% are considered high, and values above 90% are considered very high. Effort rate values above/below 8 are considered high/low.

The three criteria to perform determinant analysis, i.e., representation (top), impact (middle), and effort rate (bottom) are associated with individual determinants. Observable determinant class is shown in green, latent class in blue, and external in orange. Shaded background indicates different levels of intensity for each analysis criterion. See Tables 1–3 for determinant acronyms definition (the determinants included in the categories marked as “Other” in the tables are not represented for better clarity).
From the resulting data visualized in Fig. 6, we can infer the following insights about determinant representation, impact, and effort. First, the determinants with the highest representation (top plot in Fig. 6) were household income (> 70%), family size (> 60%), and age (> 45%). As already suggested by the outcomes of class representation (Fig. 5), all the above determinants with high representation are observable. One exception is the awareness determinant, which is the only non-observable determinant we found with high representation. The majority of the other determinants had a representation rate of 10% to 30%.
Second, the number of determinants with a high or very high impact (middle plot in Fig. 6) is much larger than the number of determinants with high representation. It must be noted that a high impact does not necessarily mean that a determinant was found to have a high influence on water consumption, but rather that it was found to have some influence on water consumption in many publications. Interestingly, some determinants from all classes achieve high or very high levels of impact. Observable determinants with very high impact include socio-demographic information (number of occupants), house characteristics (house age, value), and outdoor characteristics (garden size, and presence of rainwater tanks). While these latter attributes related to gardens ranked among those with the highest impact, garden composition was found to have one of the lowest impact rates across the analyzed studies. Also, the observable determinants related to the education level of occupants was found to have low impact. A latent variable that emerges as very important (GARD_C) is also related to garden characteristics, but, rather than representing any physical variable, it accounts for the psychological value given by occupants’ attitudes and habits towards gardening. Finally, all external variables were found to have high or very high impact, with rainfall and water price emerging as the two with impact above 90%.
The bottom plot of Fig. 6 shows that there was a wide variability in the effort rate for each individual determinant. Data on most of the observable determinants can be generally gathered with low effort, but some (e.g., appliance inventory and irrigation system) require house visits, and thus require high effort. In turn, all latent variables display an effort rate higher than 6, and three out of four are classified as high-effort. Conversely, data on all external determinants can be retrieved with low effort, as they are usually available from national agencies (weather data) and water utilities (water price). Obtaining information on higher effort determinants likely requires getting in contact with individual householders, via phone/online surveys, or house visits.
Overall, the results reported in Fig. 6 suggest that there are trade-offs between representation, impact, and effort. In the next section, we perform a joint analysis of the three criteria and their trade-off to infer the implications of the outcomes of this study for researchers and practitioners.
Trade-off analysis and implications for researchers and practitioners
Figure 7 shows the interaction between the representation, impact, and effort criteria. The distribution of blue and orange points in the figure demonstrates that there are different trade-offs among the three criteria. Each trade-off can have a different set of implications to derive recommendations for researchers and also practitioners. We identified the three groups of determinants marked with (A), (B), and (C) to illustrate the different needs of research and practice. Group A is characterized by high impact, high representation, and low effort. Determinants in this group include household family size, occupants’ age, and occupants’ income. This group of well-studied determinants with proven impact might be particularly interesting for practitioners aiming to gather knowledge on household water consumption with budget constraints. Group (B), which includes, among others, information on the household irrigation system, appliance efficiency, and occupant gender, is characterized by medium-to-high impact, but low representation, and a range of low to high effort. While this group might not be very appealing for practitioners due to low representation, researchers might be interested in focusing on these determinants to increase their representation and, thus, validate or contrast the limited findings on these determinants that appear in the literature. Finally, Group C refers to determinants with low representation and, compared to those in groups A and B, lower impact. As they also might require high gathering efforts, these determinants should be treated with caution until more research is performed to prove their potential impact on a larger sample of studies.

Impact (x-axis) vs Representation (y-axis) vs Effort (color) of each determinant. Each point refers to a specific determinant. See Tables 1–3 for determinant acronyms definition. The determinants classified as “High effort" are those with an effort value larger than 8.0, vice-versa for the “Low effort" determinants. Determinants are organized in three groups: Group A - high impact, high representation, and low effort; Group B - medium-to-high impact, low representation, and mixed low and high effort; Group C - low representation, low impact, mixed effort.
Accounting for similar trade-offs across the entire sample of determinants that we have identified from the review of the literature enables determinant-specific recommendations to be derived for practitioners and researchers. In the last step of this review and determinant classification effort we thus develop a trade-off analysis framework that considers different combinations of representation, effort, and impact to formulate such recommendations. In keeping with the goal of this study, our trade-off analysis aims at identifying groups of determinants that have proven cost-effective impact via extensive research and, thus, can be recommended for use in practice, compared with groups of determinants that require more research to address open questions related to representation, impact, and effort. The proposed trade-off analysis framework includes four main recommendation categories:
U
In this category, we include determinants characterized by high representation, high/very high impact, and low effort. We consider these determinants as determinants that practitioners can “definitely use" (U), as they have been extensively researched and have been shown to have an impact in most cases, while being affordable. For the same reasons, higher levels of research priority should be devoted to less explored determinants, while these can serve as references. The determinants included in box (A) in Fig. 7 belong to this group.
IR-UC
In this category, we classify those determinants characterized by low representation, high/very high impact, and low effort. Given their promising, but not extensively proven, impact, and overall affordability, further research on these determinants should be prioritized to increase their representation (IR). We consider these determinants as determinants that practitioners can “use with caution" (UC), as they have not been extensively researched, but at the same time might have high impact at low-cost. The determinants included in box (B) in Fig. 7 and classified as low effort (blue color) belong to this group.
LE/IR-UC
In this category, we include determinants characterized by generally low representation, high/very high impact, and high effort. Similarly to the previous category, we believe that practitioners can use these determinants “with caution" (UC), as they have not been extensively researched and require high effort for data collection, but at the same time might have high/very high impact. Given their promising, but not extensively proven, impact, and high cost, further research on these determinants should be prioritized, primarily to lower the effort (LE) needed to collect them and, thus, facilitate their consideration in more studies (increased representation - IR). The determinants included in box (B) in Fig. 7 and classified as high effort (orange color) belong to this group.
IR/LE/AI-NP
In this category, we include determinants characterized by low representation, low impact, and mainly high effort. Given the limited knowledge on these determinants, we suggest that these determinants are “not prioritized" (NP) for use by practitioners unless further research demonstrates that the effort required to collect these determinants is worth the benefit of considering them. Further research should then aim at increasing their representation (IR), lowering the effort needed to obtain data on these determinants (LE), and further assessing their impact (AI) to acquire better knowledge on their actual value. The determinants included in box (C) in Fig. 7 belong to this group.
Summary information on the above categories is reported in Table 5. Based on the proposed trade-off analysis framework and the threshold values defined in Fig. 6, we associated each of the different determinants identified in the framework analysis papers with a level of recommendation (see Fig. 8). Some relevant insights for researchers and practitioners emerge. First, only observable determinants are classified as “U". At present, there are some socio-demographic determinants (i.e., number of occupants, income level, and occupant age) that can be reliably used by practitioners in most cases to model household water consumption and can be easily and affordably retrieved.

Each household water consumption determinant identified in the framework analysis papers is associated with a level of recommendation. Determinants are classified according to the three defined classes (columns), i.e., observable, latent, and external. Four levels of recommendation (rows) are formulated for practitioners and researchers. They are sorted in decreasing order of representation and proven impact in research, as well as confidence for use in practical applications. Confidence for use in practical applications decreases going from green ("U" level of recommendation) to orange ("IR/LE/AI-NP" level of recommendation).
Second, all external variables (i.e., average rainfall, temperature, and water price) are classified as IR-UC. Consequently, they have a proven impact, but have been used sporadically in connection with household water consumption (while they have been used more often at larger, urban scales), thus results might be case-specific and further research is needed to assess their impact on a larger number of studies.
Third, a mix of observable and latent external variables deserves further research to lower effort (e.g., by improving technology/data gathering practices or identifying lower-effort proxies for the same type of information) and increase representation. These variables are either observable determinants, the collection of which requires significant effort and house visits/calls to occupants (e.g., to build an inventory of appliance efficiency or storing information on irrigation systems), or latent variables the impact of which is still not proven due to low representation. The increasing availability of high-resolution metering and behavioral studies fostered by smart metering development is likely to contribute more knowledge on these determinants and more complete guidelines for use by practitioners in the coming years7,17,20.
Fourth, we would like to stress that the recommendation “Do not favor adoption until further research" for the determinants classified as IR/LE/AI-NP does not mean that they should not be considered in future applications or no research should be done on them. Conversely, we recognize that many existing studies are based on limited data or data with coarser spatio-temporal resolutions, thus conclusive statements on the impact of such determinants would require further validation. Since large uncertainty about their impact remains, more studies are actually needed to increase the representation of these determinants and increase the statistical significance and generality of their impact assessment. Joint research that also includes other determinants with higher levels of representation could be beneficial to discover more information on the determinants in this group and better understand whether practitioners should eventually include one/more of these determinants in their analysis. Further research could be also developed to assess the degree to which these determinants are correlated with others, and hence redundant, and to which extent these and other determinants can relate to particular characteristics of water consumption (e.g., demand peaks, end use components).
Finally, some of the determinants that we recommend to use with caution (UC) in practice, and that should be prioritized for research, might become determinants to definitely use (U) in the future. Two limitations currently prevent us to recommend “definitely use" for these determinants, i.e., generally low representation and high effort for data collection. Low representation indicates that the determinant has not been well-studied in the literature. Hence it might not be generalizable to a wide range of locations. To address the disadvantages of low representation, the following is recommended for practitioners:
-
Check the literature and if there are studies with similar context (location/climate/application) to the practitioners’ required application, and the impact of the determinant is high, then the determinant could be considered for use.
-
Continue to monitor the literature, to see if new studies appear using that determinant.
The other limitation, high effort, means that in the reviewed past studies it has been costly for practitioners to collect some of the required determinants. With the advent and widespread use of new technologies, the effort required to collect some of the required high-effort determinants may be substantially reduced. Lowering the effort related to some high-impact, yet also high-effort, determinants (see, e.g., those indicated with orange color in Group B in Fig. 7) would have a two-fold benefit. The direct reduction of the costs required to collect information on those determinants will also enable wider consideration of these determinants in a larger number of studies, thus increasing their representation. As technology enhances the capture of such determinants, there is an opportunity to revisit past studies/datasets and increase the representation of these determinants, which might then transition to determinant group A in in Fig. 7. To address the current limitations and disadvantages of high effort, the following is recommended for practitioners:
-
Monitor the use of emerging technologies that provide an opportunity to lower the cost required to collect the determinant. For example, there is an opportunity for analysis of high resolution satellite maps/photos to provide automated estimates of observable determinants such as garden size (GSZE) over large number of households, which would lower the cost substantially56. Similarly, latent determinants such as water consumption awareness (AWARE_C) could be based on the uptake of user-friendly smart metering and phone apps on water consumption if they were widely available17,57.
-
Evaluate overall costs vs benefits based on preliminary experiments on small sample data (to evaluate benefits while avoiding high costs), and consider the use of lower cost proxy data for the “high effort” determinant.
These recommendations provide some guidance for practitioners to handle determinants classified as “use with caution”.
Limitations and future research
This work provides evidence and a quantitative framework for the analysis of household water consumption determinants, yet several limitations and questions remain for further research. First, alternative formulations of determinant representations, impact, and effort could lead to different results. This also stands for the subjective thresholds we adopted to distinguish between high and low representation, impact, and effort. Such thresholds and criteria formulation could be changed based on needs and subjective judgement.
Second, in this review we focused on the analysis of individual determinants of household water consumption. However, some determinants could be correlated, present redundant information, or be accounted for in alternative ways to build models for forecasting water demand (e.g., rainfall amount versus rainfall occurrence53). Input feature engineering, variable redundancy, and data accuracy can substantially affect the performance of water demand models. Future studies focused on comparative analysis of alternative determinant formulations and inter-links/dependencies among different determinants can help define non-redundant determinant sets to train models of water demand and recommendations for variable pre-processing.
Third, the findings of this study are consistent with previous review papers that identified both observable and latent variables as the most important with respect to domestic water consumption58. Yet, other meta-analyses and review studies found partly contradictory results. Differently from our study26, found that the most important determinants of water use behaviour are related to individual opportunities and motivations, gender, income, and education level. In turn59, formulated a model that accounted for a wide range of variables including demographics, dwelling characteristics, household composition, conservation intention, trust, perceptions, habits, and perceived behavioral control. It must be noted that the above studies do not consider household water consumption per se as we do here, but relate potential determinants of water consumption also to individual consumption or behavior changes (i.e., changes in water consumption over time). Future, potentially contrasting, studies could then expand the scope of this work and relax the exclusion criteria we adopted here to achieve more inclusive comparative analyses that investigate the effect of different determinants in relation to quantified intervals of total household water consumption, and other heterogeneous aspects of domestic water demand, including statistics on end use components (e.g., flow rate, duration, or frequency of individual appliances)60 and temporal changes of water consumption levels due to external stressors such as droughts, or demand management interventions39,49, for example.
Fourth, the set of framework analysis papers includes case studies primarily located in the United States, Australia, and Europe (see Fig. 4). Geographical coverage is thus skewed. There is a need for more studies from other geographical regions (including countries with low-income economies) in order to obtain a more balanced picture and consolidate/expand the results obtained so far.
Finally, recent works have highlighted that urban and household water demands have been modelled at different spatial and temporal resolutions47. The choice of the temporal and spatial resolution of interest is determined both by data availability and the specific modelling and management purpose. Multi-scale studies combining different levels of spatial and temporal aggregation of water demands and potential determinants would further advance our analysis and contextualize specific recommendations for data collection and processing at the different spatial and temporal scales of interest.
Outlook and summary
In this paper, we contributed a comprehensive literature review and assessment framework to evaluate state-of-the-art research on the determinants of household water consumption. Starting from a search that returned over 8200 papers, we identified 48 papers that clearly identify whether a particular determinant can have an impact on household water demand (see Supplementary Table 1 for the list of selected papers). We then developed a classification system and assessment framework to analyze these 48 papers with the following two-fold goal. First, we classified the potential determinants of household water consumption into three main categories, i.e., observable, latent, and external based on their nature and ease of information retrieval. Second, we defined three quantitative criteria to analyze the influence of different determinants in relation to water consumption and quantified them for the determinants identified in the reviewed papers. These three indicators look at (i) how frequently a determinant appears in the literature (representation), (ii) whether or not a particular determinant has been observed to influence household water consumption (impact), and (iii) what the cost for labour and/or equipment required to collect information on a particular determinant is (effort).
Our trade-off analysis of representation, impact, and effort shows that there are some distinct groups of water consumption determinants. Each group has different implications for practitioners and researchers and our analysis provides valuable guidance for practitioners and researchers on which determinants to consider in a range of situations. We identified a group of high impact, high representation, and low effort determinants which include household family size, occupants’ age, and income. These observable determinants have been widely studied in the literature and their impact on household water consumption has been demonstrated in several cases. Moreover, as information on these determinants can be obtained with low effort, this group may be of interest for practitioners that need to estimate or model household water consumption with budget constraints and little room for exploratory analysis. A wide range of other determinants may be more interesting for research purposes. This range include information on the external determinants, including climate variables and water price, which is usually easily accessible and does not require ad hoc data gathering campaigns, yet only a limited number of studies has correlated these determinants with water consumption at the household scale, demonstrating potentially high impact. In turn, some other observable determinants and most latent determinants that relate to subjective perceptions, awareness, habits, or opinions, require a higher data-gathering effort and have a more uncertain impact on household water consumption, often only demonstrated in specific case studies. Given the higher cost and more uncertain return, further analysis on these determinants can be prioritized by researchers before direct use in practice. Practitioners and researchers should also monitor emerging technologies that could potentially lower the cost of data gathering on wide-scale and provide an opportunity to analyse past data sets and increase the representation of these determinants.
This study also highlights several limitations that required further research to achieve general and conclusive interpretations on the link between the multi-faceted characteristics of household water consumption (including end-use components61, consumption change, and demand patterns) and its determinants. Overall, our literature review contributes a further step to systematically analyze the determinants of household water demand, develop a general understanding, and derive several recommendations to guide future research and practice. Moreover, the assessment framework we proposed here is ready to be used by water authorities and other parties that are interested in identifying informative sets of variables to predict household water consumption with a high degree of confidence, while taking into account budget and data availability.
Data availability
The authors declare that all data supporting the findings of this review are available within the paper, in the Supplementary Information, and in the reference list.
References
Gerland, P. et al. World population stabilization unlikely this century. Science 346, 234–237 (2014).
Kundu, D. & Pandey, A. K. World urbanisation: Trends and patterns. In Developing National Urban Policies, 13–49 (Springer, 2020).
Gleick, P. H. et al. Waste not, want not: The potential for urban water conservation in California (Pacific Institute for Studies in Development, Environment, and Security Oakland, CA, 2003).
Turner, A. et al. Guide to demand management and integrated resource planning (update on original 2008 guide). (2010).
Chini, C. M. & Stillwell, A. S. The metabolism of U.S. cities 2.0. J. Industrial Ecol. 23, 1353–1362 (2019).
Collins, R., Kristensen, P. & Thyssen, N. Water resources across Europe-confronting water scarcity and drought. Ph.D. thesis, Univerza v Mariboru, Fakulteta za kmetijstvo in biosistemske vede (2009).
Arbon, N., Thyer, M., Hatton MacDonald, D., Beverley, K. & Lambert, M. Understanding and predicting household water use for Adelaide. Goyder Inst. Water Res. Technical Rep. Ser. 14, 15 (2014).
Jorgensen, B., Graymore, M. & O’Toole, K. Household water use behavior: An integrated model. J. Environ. Management 91, 227–236 (2009).
Russell, S. & Fielding, K. Water demand management research: A psychological perspective. Water Resour. Res. 46, https://doi.org/10.1029/2009WR008408 (2010).
Donkor, E. A., Mazzuchi, T. A., Soyer, R. & Alan Roberson, J. Urban water demand forecasting: review of methods and models. J. Water Resour. Plan. Management 140, 146–159 (2014).
Beal, C., Stewart, R., Huang, T. & Rey, E.South East Queensland residential end use study (Urban Water Security Research Alliance Brisbane, Australia, 2011).
Bernardo, V., Fageda, X. & Termes, M. Do droughts have long-term effects on water consumption? Evidence from the urban area of Barcelona. Appl. Econ. 47, 5131–5146 (2015).
Haque, M. M., Egodawatta, P., Rahman, A. & Goonetilleke, A. Assessing the significance of climate and community factors on urban water demand. Int. J. Sustainable Built Environ. 4, 222–230 (2015).
Gregory, G. D. & Leo, M. D. Repeated behavior and environmental psychology: the role of personal involvement and habit formation in explaining water consumption. J. Appl. Soc. Psychol. 33, 1261–1296 (2003).
Fielding, K. S., Russell, S., Spinks, A. & Mankad, A. Determinants of household water conservation: The role of demographic, infrastructure, behavior, and psychosocial variables. Water Resour. Res. 48 (2012).
Cominola, A., Giuliani, M., Castelletti, A., Rosenberg, D. E. & Abdallah, A. M. Implications of data sampling resolution on water use simulation, end-use disaggregation, and demand management. Environ. Modelling Softw. 102, 199–212 (2018).
Stewart, R. A. et al. Integrated intelligent water-energy metering systems and informatics: Visioning a digital multi-utility service provider. Environ. Modelling Softw. 105, 94–117 (2018).
Monks, I., Stewart, R. A., Sahin, O. & Keller, R. Revealing unreported benefits of digital water metering: Literature review and expert opinions. Water 11, 838 (2019).
Beal, C. & Flynn, J. The 2014 review of smart metering and intelligent water networks in Australia and New Zealand. Report prepared for WSAA by the Smart Water Research Centre, Griffith University (2014).
Cominola, A., Giuliani, M., Piga, D., Castelletti, A. & Rizzoli, A. E. Benefits and challenges of using smart meters for advancing residential water demand modeling and management: A review. Environ. Modelling Softw. 72, 198–214 (2015).
Cominola, A. et al. Segmentation analysis of residential water-electricity demand for customized demand-side management programs. J. Clean. Prod. 172, 1607–1619 (2018).
Cominola, A. et al. Data mining to uncover heterogeneous water use behaviors from smart meter data. Water Resour. Res. 55, 9315–9333 (2019).
Arbués, F., Garcıa-Valiñas, M. Á. & Martınez-Espiñeira, R. Estimation of residential water demand: a state-of-the-art review. J. Socio-Econ. 32, 81–102 (2003).
Inman, D. & Jeffrey, P. A review of residential water conservation tool performance and influences on implementation effectiveness. Urban Water J. 3, 127–143 (2006).
House-Peters, L. A. & Chang, H. Urban water demand modeling: Review of concepts, methods, and organizing principles. Water Resour. Res. 47 (2011).
Addo, I. B., Thoms, M. C. & Parsons, M. Household water use and conservation behavior: A meta-analysis. Water Resour. Res. 54, 8381–8400 (2018).
Koop, S., Van Dorssen, A. & Brouwer, S. Enhancing domestic water conservation behaviour: A review of empirical studies on influencing tactics. J. Environ. Management 247, 867–876 (2019).
Elsevier. Engineering Village. https://www.elsevier.com/solutions/engineering-village (Dec. 2020) (2020).
Bertone, E. et al. Role of financial mechanisms for accelerating the rate of water and energy efficiency retrofits in Australian public buildings: Hybrid bayesian network and system dynamics modelling approach. Appl. Energy 210, 409–419 (2018).
Toth, E., Bragalli, C. & Neri, M. Assessing the significance of tourism and climate on residential water demand: Panel-data analysis and non-linear modelling of monthly water consumptions. Environ. Modelling Softw. 103, 52–61 (2018).
Trumbo, C. W. & O’Keefe, G. J. Intention to conserve water: Environmental values, reasoned action, and information effects across time. Soc. Nat. Resour. 18, 573–585 (2005).
Russell, S. V. & Knoeri, C. Exploring the psychosocial and behavioural determinants of household water conservation and intention. Int. J. Water Resour. Development 36, 940–955 (2020).
Makki, A. A., Stewart, R. A., Panuwatwanich, K. & Beal, C. Revealing the determinants of shower water end use consumption: Enabling better targeted urban water conservation strategies. J. Cleaner Prod. 60, 129–146 (2013).
Millock, K. & Nauges, C. Household adoption of water-efficient equipment: The role of socio-economic factors, environmental attitudes and policy. Environ. Resour. Econ. 46, 539–565 (2010).
Cooper, B., Burton, M. & Crase, L. Urban water restrictions: Attitudes and avoidance. Water Resour. Res. 47 (2011).
Willis, R. M., Stewart, R. A., Panuwatwanich, K., Williams, P. R. & Hollingsworth, A. L. Quantifying the influence of environmental and water conservation attitudes on household end use water consumption. J. Environ. Manag. 92, 1996–2009 (2011).
Polebitski, A. S. & Palmer, R. N. Analysis and predictive models of single-family customer response to water curtailments during drought 1. JAWRA J. American Water Resour. Assoc. 49, 40–51 (2013).
Cooper, B. What drives compliance? An application of the theory of planned behaviour to urban water restrictions using structural equation modelling. Appl. Econ. 49, 1426–1439 (2017).
Cominola, A. et al. Long-term water conservation is fostered by smart meter-based feedback and digital user engagement. npj Clean Water 4, 1–10 (2021).
Jordán-Cuebas, F. et al. Understanding apartment end-use water consumption in two green residential multistory buildings. J. Water Resour. Plan. Manag. 144, 04018009 (2018).
Xenochristou, M., Hutton, C., Hofman, J. & Kapelan, Z. Water demand forecasting accuracy and influencing factors at different spatial scales using a gradient boosting machine. Water Resour. Res. 56, e2019WR026304 (2020).
Corral-Verdugo, V., Frias-Armenta, M., Pérez-Urias, F., Orduña-Cabrera, V. & Espinoza-Gallego, N. Residential water consumption, motivation for conserving water and the continuing tragedy of the commons. Environ. Manag. 30, 527–535 (2002).
Syme, G. J., Shao, Q., Po, M. & Campbell, E. Predicting and understanding home garden water use. Landsc. Urb. Plan. 68, 121–128 (2004).
Landon, A. C., Kyle, G. T. & Kaiser, R. A. An augmented norm activation model: The case of residential outdoor water use. Soc. Nat. Resour. 30, 903–918 (2017).
Domene, E. & Saurí, D. Urbanisation and water consumption: Influencing factors in the metropolitan region of Barcelona. Urb. Stud. 43, 1605–1623 (2006).
Ashoori, N., Dzombak, D. A. & Small, M. J. Modeling the effects of conservation, demographics, price, and climate on urban water demand in Los Angeles, California. Water Resour. Manag. 30, 5247–5262 (2016).
Di Mauro, A., Cominola, A., Castelletti, A. & Di Nardo, A. Urban water consumption at multiple spatial and temporal scales. a review of existing datasets. Water 13, 36 (2021).
Kossieris, P. & Makropoulos, C. Exploring the statistical and distributional properties of residential water demand at fine time scales. Water 10, 1481 (2018).
Bolorinos, J., Ajami, N. K. & Rajagopal, R. Consumption change detection for urban planning: Monitoring and segmenting water customers during drought. Water Resour. Res. 56, e2019WR025812 (2020).
Romano, G., Salvati, N. & Guerrini, A. Estimating the determinants of residential water demand in Italy. Water 6, 2929–2945 (2014).
Adamowski, J. F. Peak daily water demand forecast modeling using artificial neural networks. J. Water Resour. Plan. Manag. 134, 119–128 (2008).
Marzano, R. et al. Determinants of the price response to residential water tariffs: Meta-analysis and beyond. Environmental Modelling Softw. 101, 236–248 (2018).
Zounemat-Kermani, M. et al. Neurocomputing in surface water hydrology and hydraulics: A review of two decades retrospective, current status, and future prospects. J. Hydrol. 125085 (2020).
Liu, J., Savenije, H. H. & Xu, J. Forecast of water demand in Weinan city in China using WDF-ANN model. Phys. Chemis. Earth, Parts A/B/C 28, 219–224 (2003).
Babel, M. S. & Shinde, V. R. Identifying prominent explanatory variables for water demand prediction using artificial neural networks: a case study of Bangkok. Water Resour. Manag. 25, 1653–1676 (2011).
Quesnel, K. J., Ajami, N. & Marx, A. Shifting landscapes: decoupled urban irrigation and greenness patterns during severe drought. Environmental Res. Lett. 14, 064012 (2019).
Sarni, W., White, C., Webb, R., Cross, K. & Glotzbach, R. Digital water: Industry leaders chart the transformation journey. Int. Water Assoc. Xylem Inc. https://iwa-network.org/publications/digital-water/ (2019).
Llausàs, A. & Saurí, D. A research synthesis and theoretical model of relationships between factors influencing outdoor domestic water consumption. Soc. Nat. Resour. 30, 377–392 (2017).
Jorgensen, B. S., Martin, J. F., Pearce, M. W. & Willis, E. M. Predicting household water consumption with individual-level variables. Environ. Behav. 46, 872–897 (2014).
Makki, A. A., Stewart, R. A., Beal, C. D. & Panuwatwanich, K. Novel bottom-up urban water demand forecasting model: revealing the determinants, drivers and predictors of residential indoor end-use consumption. Resour., Conserv. Recycling 95, 15–37 (2015).
Mazzoni, F. et al. Investigating the characteristics of residential end uses of water: A worldwide review. Water Res. 230, 119500 (2023).
Acknowledgements
The authors acknowledge support by the German Research Foundation and the Open Access Publication Funds of the Technical University of Berlin for covering publication costs.
Funding
Open Access funding enabled and organized by Projekt DEAL.
Author information
Authors and Affiliations
Contributions
M.T. and H.M. designed the research. L.P. collected and analyzed most of the papers, and drafted an early-stage outline of this paper. All authors helped collect and review the papers in the final selection. A. C. (Andrea Cominola), L.P., M.T., H.M., P.P., R.S., and A.C. (Andrea Castelletti) developed the review framework. A.C. (Andrea Cominola), L.P., M.T., A.C. (Andrea Castelletti), and H.M. developed the final version of the paper. All authors reviewed the manuscript.
Corresponding authors
Ethics declarations
Competing interests
The authors declare no competing interests.
Additional information
Publisher’s note Springer Nature remains neutral with regard to jurisdictional claims in published maps and institutional affiliations.
Supplementary information
Rights and permissions
Open Access This article is licensed under a Creative Commons Attribution 4.0 International License, which permits use, sharing, adaptation, distribution and reproduction in any medium or format, as long as you give appropriate credit to the original author(s) and the source, provide a link to the Creative Commons license, and indicate if changes were made. The images or other third party material in this article are included in the article’s Creative Commons license, unless indicated otherwise in a credit line to the material. If material is not included in the article’s Creative Commons license and your intended use is not permitted by statutory regulation or exceeds the permitted use, you will need to obtain permission directly from the copyright holder. To view a copy of this license, visit http://creativecommons.org/licenses/by/4.0/.
About this article

Cite this article
Cominola, A., Preiss, L., Thyer, M. et al. The determinants of household water consumption: A review and assessment framework for research and practice. npj Clean Water 6, 11 (2023). https://doi.org/10.1038/s41545-022-00208-8
Received:
Accepted:
Published:
DOI: https://doi.org/10.1038/s41545-022-00208-8
This article is cited by
-
Tracking and tracing water consumption for informed water sensitive intervention through machine learning approach
npj Clean Water (2024)
-
Enhancing the explanation of household water consumption through the water-energy nexus concept
npj Clean Water (2024)
-
An integrated approach to water conservation: fuzzy logic assessment of water tariffs in Abu Dhabi Emirate’s residential sector
Bulletin of the National Research Centre (2023)
