
Abstract
We evaluated the occurrence of antibiotic-resistant bacteria, antibiotic-resistant gene, and metal concentration in a tropical river of Sri Lanka as a pre-emptive effort to understand the seasonal impact on their prevalence. Resistance for norfloxacin, ciprofloxacin, levofloxacin, kanamycin monosulfate (KM), tetracycline (TC), and sulfamethoxazole (ST) was measured with Kirby–Bauer disc diffusion method. The prevalence of Escherichia coli ranged from 10 to 27 CFU (colony-forming unit) ml−1 in Kelani River in Sri Lanka, and most of the E. coli isolates were resistant to more than one antibiotic. However, the resistance for TC and ST was much higher than other antibiotics. We found that the resistance percentage for older antibiotics like TC and ST was higher than the newer antibiotics. We detected genes that confer resistance to TCs, sulfonamides, β-lactams, and fluoroquinolones. Seasonal variation in the resistance of fluoroquinolones was much higher than the non-fluoroquinolones, but the effect was antagonistic. Overall, the significant seasonal variations imply the importance of mixed source and environmental conditions for development and transmission of antibiotic resistance.
Introduction
Antibiotic resistance and multidrug resistance are emerging environmental concern owing to its potential threat to human health, and fast-growing and widespread increase. Several reports like World Health Organization (WHO) 2016, CDC Threat Report 2013, and WHO 1998 has predicted millions of deaths in the world per year due to anti-microbial resistance (AMR). In recent times, studies reported the increase of antibiotic-resistant gene (ARG) and antibiotic-resistant bacteria (ARB) with the increase in antibiotics, nutrients, metals, and microplastic contaminants in the water bodies1,2,3. Further, animal- and human-derived manure, wastewaters, and feces entering the water bodies via treatment plants or direct application to soil or runoff4,5 are considered as crucial sources of ARG and ARB transmission6,7. Groundwater is still protected to a certain extent owing to retention/filtration/adsorption of ARB and ARG by the porous medium. Among various surface water bodies, ARG and ARB transport is much more dynamic in nature in the rivers8,9. However, rivers have quick transport for ARGs, and Lake systems are likely to have a much longer retention time of the same10,11.
Rivers that play major roles in the economic growth of any emerging nation has religious and societal importance as well12. Yet, more often than not, rivers act as a disposal site for different types of waste in several urban cities of the emerging economies. Further, rivers along the urban section receive a significant amount of both antibiotics and antibiotic-resistant fecal bacteria from the wastewater treatment plant (WWTP) effluents. Antibiotic resistance has been reported in several rivers around the world, especially in the Indian rivers like Manjra River, Tamariparani River13,14, Musi River15, Brahmaputra River, and River Ganges. Several religious festivals, including Simhastha Mahakumbh Mela16, which attracts millions of people from the world to bathe in the holy river, were investigated for inducing antibiotic resistance.
Introduction of ARGs into water bodies via anthropogenic activities include runoff from urban areas, aquaculture17, agriculture, animal husbandry18, and effluent from hospitals and treatment plants19,20. For a closed system like a lake, the catchment area (including the capacity of WWTPs), land-use land cover (e.g., urban city, agriculture area), and location of point source (e.g., WWTP, hospital, aquaculture sites) have a critical role in determining the impact of human activities on ARGs20,21. Swiss lakes and South Platte River Basin with a higher capacity of WWTPs in the catchment have shown a greater abundance of sul22,23. Sites in close vicinity to a sewage discharge show a relatively high abundance of ARGs in Geneva lake2. An abundance of sul and tet genes was reported in lakes along the Yangtze River, close to built-up land24. Similarly, ARGs were also found in high concentrations near Nanhu Lake and Shahu Lake, in an urban area of China3. Further, the urban rivers affected by treated/untreated wastewaters are shown to have antibiotic-resistant pathogens like vancomycin-resistant Klebsiella pneumonia, Acinetobacter, Enterococci, Pseudomonas spp. and Shigella spp.25,26,27,28.
A relation between all the pollutants, that is, metals, viruses, PPCPs, and microplastic has already been studied for the tropical river, lakes, and sewage treatment plants in India29,30, and thus there is a lot more to look up now towards the seasonal variability of these micro-pollutants. The presence of these emerging contaminants has become a serious threat for the urban residential colonies as they are more vulnerable to it31,32. Overall, the seasonality influence on ARB and ARG has yet not been dealt with in detail, which is highly required for a better understanding of its transport, concentration, and transmission in the river systems. Our hypothesis is that seasonality is likely to have major influences on antibiotic resistance in the rivers of monsoon-dominated tropical countries with emerging countries. Therefore, we selected the Kelani River (Fig. 1a, b), the most crucial river in Sri Lanka, to understand the seasonal influence of ARG and ARB. Sri Lanka has unique settings in several ways, including that it has two monsoons, only wet and dry periods and no winter, yet a considerable variation in the rain distributions as represented by 6 years average mean rainfall distribution (Fig. 1c). Our specific objectives of the present study were: (i) to quantify the seasonal variations in the prevalence of E. coli ARB and ARG between the dry and wet season, and (ii) to understand the underlying factors governing the variation in the relation between in situ parameter, metal, E. coli prevalence, and antibiotic resistance through multivariate statistical techniques.

Sampling was carried out in the wet season (October 2017), coded as K11–K14, and dry season (March 2018), coded as K22–K24. Base map has been prepared using licensed version of ArcMAP.
Results and discussion
Prevalence of E. coli and their antibiotic susceptibility
Escherichia coli prevalence (colony-forming unit (CFU) ml−1) was observed in the Kelani River from upstream (K1; Seethawaka Export Processing Zone [EPZ]) to downstream (K4; Ambathale intake) (Table 1). We did not observe the large change in the range of prevalence of total coliform in October (23–31 CFU ml−1) and March (17–26 CFU ml−1), but the maximum number of E. coli isolated in October (27 CFU ml−1) was three times higher than in March (n = 9 CFU ml−1). At the Seethawaka EPZ sampling point, a considerably higher E. coli prevalence was measured as compared to downstream sampling points, which probably suggests flushing of poorly treated industrial wastewater of Seethawaka EPZ. If we compared the maximum observed E. coli (CFU ml−1) of the Kelani River with some rivers in the emerging countries, the Kelani condition seems better than Chaophraya River (70 CFU ml−1), and Ping River (42 CFU ml−1), of Thailand, the Brahmaputra River (42 CFU ml−1), Sabarmati River (42 CFU ml−1), and the Ganges Rivers (42 CFU ml−1) of India and almost comparable with rivers like Nan (4.8 CFU ml−1), Wang (0.47 CFU ml−1), and Yom (5.4 CFU ml−1) in Thailand33.
We tested susceptibility and resistance of E. coli isolated from the samples for three fluoroquinolones, that is, norfloxacin (NFX), ciprofloxacin (CIP), and levofloxacin (LVX), and three non-fluoroquinolones, namely, kanamycin monosulfate (KM), tetracycline (TC), and sulfamethoxazole (ST). The resistance percentage of the fluoroquinolone (LVX, CIP, and NFX) decreased from upstream K1 to downstream K4 in the Kelani river (Fig. 2). This could be due to the self-purification of the river or the degradation of available antibiotics. Observed seasonal variation is hinting at the influences of climatic factors on the antibiotic susceptibility. Fluoroquinolones (LVX, CIP, NFX) showed a similar trend as their susceptibility also decreased in the summer season at all locations except the susceptibility for NFX at sampling location K4.

Bar diagram exhibiting percentage of different class of antibiotic resistance (i.e., resistant, intermediate, and susceptible). For a levofloxacin (LVX), b ciprofloxacin (CIP), c norfloxacin (NFX), d kanamycin monosulfate (KM), e tetracycline (TC), and f sulfamethoxazole (ST) in the Kelani River of 2017 representing wet season (K11–K14) and dry season (K22–K24) in 2018.
When compared to the Chaophraya River, Thailand, which was subjected to a similar kind of study, fluoroquinolones (LVX, CIP, and NFX) have demonstrated a higher resistance percentage along the urbanized area33. However, for the Chaophraya River, land-use patterns were considered as the governing factor to influence resistance for the fluoroquinolones, which seems not true for the Kelani River, which seems to have influenced by climatic factor, rains, enrichments, dilutions, WWTP, and DWTP like the presence of the WWTPs located upstream of the first (after Seethawala EPZ) and third sampling points (after biyagama EPZ). For non-fluoroquinolone (KM, ST, and TC) higher resistance was observed at downstream locations compared to upstream locations, which probably indicates the antibiotic use pattern affecting the resistance33. A thorough investigation is needed to further strengthen these results by adding more sampling locations at both the ends, that is, before the Seethawaka WWTP, and along with the urbanized downstream areas.
Antibiotic resistance genes
A higher concentration of ARG was found in more urbanized sites of Sri Lanka (Fig. 3). Two out of three genes studied (blaCTX1 and qnrs) were found to be considerably higher at all sites in the summer (March) season than in winter (October). This shows that there is a substantial impact of seasons on the prevalence of ARG as well. It may be attributed to a higher influx of ARG in the downstream during wet seasons with higher discharge. Genes that confer resistance to the old antibiotics, TCs (tet) and sulfonamides (sul), were detected in all samples (Table 2). The detection of sul1 in both seasons is following the antibiotic resistance test results where resistance to sulfonamides (i.e., ST) was observed. Sulfonamides are old antibiotics that have been extensively used in the past but are not used anymore for human consumption because of its toxicity. However, it is still used in agriculture, and the genes encoding resistance for these antibiotics were found to be persistent34,35. A study found that genes conferring resistance to fluoroquinolones (qnrS, aac(6′)-Ib-cr) were more likely to co-occur with ampC in a plasmid of Serratia marcescens36. Gene ampC gene, which confers resistance to β-lactam antibiotics (e.g., ampicillin) was detected in 2017 but not in 2018. Metals showed varied results among each other, yet higher EC and increased metals may be enhancing the occurrence of ARGs3. Apparent selecting pressure of antibiotics on ARG abundance is observed in the rivers of emerging countries like Pakistan37, China (Haihe River38, Beijiang River39), Thailand, and India40.

Scattered plot exhibiting ARG concentration for a blaCTX, b qnrS, and c sul1 in the Kelani River. (The major observation was that the number of copies in the dry season of March 2018 was higher than the wet season of October 2017. Error bars show the variation in terms of standard deviation using sample triplicate analysis).
Tracing the multi- and cross-resistance through source apportionment
In our study, variations among in situ parameters, metal, fecal coliform, ARB, and ARG, were explained by four principal components (PCs) explaining 84.74% of the total variance in the data (Supplementary Table 1) and presented as the scattered plot in Fig. 4a, b. The first component (PC_1) accounted for 26.84% variance and was comprised of pH, temperature, EC, ARG (blaCTX1 and qnrs), and ARB (LVX). The second component (PC_2), represented by metal (Mn), ARG (sul1), oxidation–reduction potential (ORP), and E. coli, showed a variance of 21.47%. While PC_3 included Zn, NFX, KM, and TC and explained variance of 19.08%, PC_4 showed higher loading for Pb and Cd, accounting for only 17.35% variance in the data. On the other hand, the cluster diagram illustrated that the number of components was four in October 2017, which decreased to three in March 2018 (Fig. 4c, d), implying the seasonality significance on the variability of antibiotic resistance.
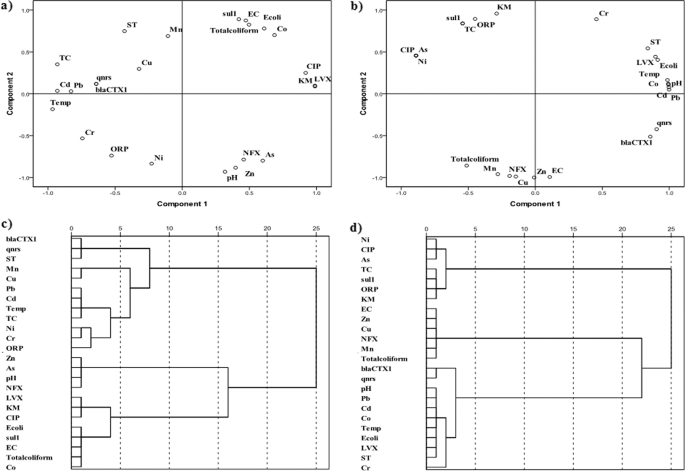
X–Y scatter plots of first two principal component loading for a 2017 and b 2018, and dendrogram representation of the result of cluster analyses for c 2017 and d 2018. The significant observation was that the governing factors and cluster decreased in the dry season of March with respect to the wet season in October 2018.
We made two distinct of observations from X–Y plot of PC_1 and PC_2: (i) metal association with antibiotic resistance was higher in October as evident from the positive–negative domain of PC_1 and PC_2 at left upper domain; and (ii) ARB and ARG parameters occupied all four domains of the plus created by loadings of PC_1 and PC_2 in March 2018, which were restricted to only positive loading domains of PC_1. This may further imply that during October, related antibiotic parameters were at the forefront governing greater variation in the river water. However, in the next 6 months, by the month of March, the water quality of the river might have become more consistent in terms of both fecal and antibiotic resistance contaminations. This is an interesting observation, which hints at the requirement of scientific discussions on causative and associative features of traditional water quality parameters with anti-microbial features of the given ambient water. This further relates to the need of identification of proper markers for ARB and ARG prevalence in the environment as it is quite evident that the prevalence of E. coli is not a valid marker as seen in several WTPs studies and pollution levels, that is, biological oxygen demand, dissolved oxygen (DO), metal, microplastic, salinity, or other can be predictive feature to a certain extent only.
Figure 5 summarizes the results of this study in the conceptual flow diagram. As evident, almost all the sampling locations on Kelani River, Sri Lanka contained E. coli strains that exhibited the resistance to more than one antibiotic. Among six antibiotics examined for possible resistance, TC and ST resulted in the highest resistance and considerable seasonal impact on the prevalence of ARB and ARGs in the river was observed. We observed an increase in the number of ARG copies during dry season, that is, March 2018 than that of the wet season, that is, October 2017. It implies that ARG prevalence and transport are not only source dependent but are also dependent on factors such as seasonality, discharge, hydrological processes like evaporation, rainfall, runoff, and combined sewer overflow, associated water quality parameters, disease types in a particular time, and accordingly prescribed antibiotic, as well as people’s perception, awareness, and attitude. However, the number of factors regulating the ARG transmission in the studied river system got reduced in March 2018 than that in October 2017. Close associations of both ARB and ARGs seem to be there with contaminant or ionic enrichment, leading to an increase in the overall electrical conductivities (ECs) of the river water in the dry season.

Conceptual model depiction of the result summary highlighting the influence of seasonality on antibiotic resistance.
Finally, we foresee an appalling need to reduce the infection mode of antibiotic resistance like best water and sanitation practices, awareness of cleanliness, more efficient and specific nature-based treatment solutions, and controlling the wastewater discharge to the surface water, especially rivers in the emerging countries are required to control the antibiotic concentration of surface waters. It is imperative to identify the available antibiotic concentrations to come up with a treatment mechanism. Further, ARBb and ARGs cannot be truly quantified by their concentrations in water columns, but the monitoring extension towards sediments is also required. This alternatively means that there is a need for implementation of a tertiary treatment with effective disinfection and management of sludge. Identification of the critical locations where higher antibiotic resistance E. coli can be found along with the current level of resistance toward the antibiotic categories is crucial. Last but not least, data related to seasonal variations in the ARB and ARG around the world is still scarce and needs to be substantiated from various parts of the world, especially from the emerging countries for better management and control of antibiotic resistance menace.
Methods
Study area
Among 103 rivers originating from the central hills of Sri Lanka, the Kelani is the fourth longest river (144 km) that flows to the west coast through Colombo city and ends in Mattakkuliya area. The river crosses 192 km through Colombo, Nuwara–Eliya, Gampaha, and Kegalle. Kelani river basin comprises ~2230 km2, which receives ~2400 mm of annual average rainfall (Fig 1c) and has fair variation in them throughout this stretch (Fig 1d). It supports the life of 25% of the Sri Lankan population in some way or other41. Interestingly, the Kelani River is the most polluted river in Sri Lanka41,42, yet a drinking water source for about 80% of Colombo municipals. The lower Kelani River basin is heavily urbanized, whereas its upper basin is mainly covered with dense vegetation of rubber, tea, or natural greenery43. Various industries are located along the banks of this river and known as EPZ, consisting of 180 acres of beverage processing, latex, apparel, chemical manufacturing, and food processing industrial area. Ambatale intake point at the Kelani River is considerably under threat due to domestic and industrial wastewater44.
Surface water sampling
Based on the multiprobe in situ analyses (Hanna 981A) of pH, temperature, EC, DO, ORP, and bicarbonate using titration method, four locations on the Kelani River in Sri Lanka (Fig. 1) were selected for further analyses of ARB, ARG, and metals like As, Cd, Co, Cr, Cu, Mn, Ni, Pb, and Zn. For metal analysis, the samples were collected in polyethylene bottles of 125 ml. Samples were filtered using 0.45 µm filters, and concentrated HNO3 was used for preservation. Samples were analyzed for metals by inductively coupled plasma-mass spectrometry (PerkinElmer’s NexION® 2000). In order to understand the influence of seasonality, sampling was carried out in October 2017 representing wet season (coded as K11–K14) and March 2018 representing dry season (coded as K22–K24) (Fig. 1b). Due to alike nature of upstream samples in October 2017, we have analyzed only three samples in March 2018.
Antibiotic susceptibility test
We isolated E. coli using the membrane filtration method. Firstly, we diluted the samples with phosphate-buffered 0.8–0.85% NaCl solution by following 10-fold dilution steps. Then, the culture media were prepared with Chromocult® Coliform Agar ES (Merck, Japan) at 34.5 g l−1 in distilled water and autoclaved at 121 °C and 0.1 MPa for 15 min. After adding 4 ml of diluted samples to 36 ml of buffer solution, it was poured into 37 mm monitor kits (Advance Toyo, Tokyo, Japan) consisting of a filter paper with a pad to absorb the culture media. After incubating for 22–24 h at 35.5 °C, the Petri dishes were removed and E. coli colonies were identified by a dark blue/violet color. The number of E. coli colonies per ml of water sample (CFU ml−1) was obtained by counting the dark blue colonies, and other coliforms by counting the pink to red colonies; the total coliform count is the sum of E. coli and other coliforms.
The isolated E. coli colonies were evaluated for resistance to antibiotics such as fluoroquinolones (NFX, CIP, LVX), aminoglycosides (KM), TCs, and sulfonamides (ST) using the KB disk diffusion method according to the previous work33. Twenty individual colonies of E. coli with similar shapes were cultured in sterile PERLCORE Tryptic-Soy Broth (EIKEN Chemical Co., Ltd, Japan) at 35 ± 2°C to obtain turbidity of the McFarland No. 0.5 corresponding to a cell density of 1.5 × 10 CFU ml−1. The PERLCORE Sensitivity Test (ST) Agar (EIKEN Chemical Co., Ltd, Japan) was prepared following the manufacturer’s protocol. The media solution was autoclaved at 121 °C for 20 min, cooled to 55 °C, and then 20–25 ml of the agar solution was set into 90 mm Petri dishes. After the agar was set, the prepared E. coli culture was smeared on the ST agar with a sterile cotton swab. After 3–5 min, antibiotic discs (KB Disk, EIKEN Chemical Co., Ltd., Japan) were placed on the ST agar with a distance between the disks of at least 24 mm. The dishes were placed in a preheated incubator (37 °C) within 15 min of placing the discs. After incubation for 16–18 h at 35–37 °C, the diameter of growth inhibition of the E. coli plates was measured45,46.
Screening for antibiotic resistance genes
We collected 2 L of water samples at each sampling site and stored in sterile plastic bags. Samples were stored in the ice box and darkness during transport to the laboratory. We filtered (50–800 ml) samples through polycarbonate membrane filter based on their turbidity and then soaked the used filter in 500 µl of 2× DNA/RNA shield (ZymoResearch, USA) for DNA preservation. DNA was extracted from the mixture using the FastDNATM spin kit (MP Biomedicals, LLC, Ohio, USA). The absorbance method was used to check the purity of the DNA extracts as well as for their quantification. Briefly, DNA samples show an absorbance ratio of ≥1.78 at λ260 versus λ280. PCR was then performed in a thermocycler (Bio-Rad 2720) with reaction conditions given in Supplementary Table 2 for 30 cycles to amplify the ARGs. We tested two groups of ARGs that confer resistance to their respective antibiotics with mechanism of action as: (1) inhibition of DNA gyrase: aac-(6′)-1b-cr, gyrA, parC, qnrB, and qnrS for fluoroquinolones; (2) inhibition of folate synthesis: tetW for TCs, and dfr1 for trimethoprim; and (3) inhibition of cell wall synthesis: blaCTX, blaSHV, blaTEM, and ampC for β-lactams. The primers used for the amplification of ARG are listed in Supplementary Table 3.
Quantification of ARG
Real-time quantitative reverse transcription PCR (qRT-PCR) was used in Stratagene MX3000P (Agilent Technologies, USA) using PrimeScriptTM RT Master Mix (Perfect Real Time, RR036B, Takara Inc., Japan) for the quantification of qnrS, sul1 blaCTX, and16S rRNA. Each batch was run using duplicate field samples and blank samples for contamination checks. The annealing temperature (Ta) and primer concentrations were optimized for each primer pairs. Detailed PCR amplification conditions are provided elsewhere. Briefly, amplification was followed by one cycle of denaturation (95 °C), reannealing at each primers Ta, and followed by temperature ramping to 95 °C to generate dissociation curves.
Quality assurance/quality control and statistical analyses
For better quality control, several blanks were used during the experiment with separate media, monitor kit, and dilution buffer. Statistical Package for Social Sciences version 21 was used to carry out PC analysis (PCA) and hierarchical cluster analysis after data normalization by obtaining z-scores and orthogonal varimax rotation. Results were then represented in a three-dimension PCA diagram. Cluster analysis was done using the Ward method to show proximity among the analyzed parameters of all samples.
Data availability
Additional data other than available with paper and its supplementary files will be made available on request from the authors.
References
Wright, G. D. & Poinar, H. Antibiotic resistance is ancient: implications for drug discovery. Trends Microbiol. 20, 157–159 (2012).
Czekalski, N., Gascón Díez, E. & Bürgmann, H. Wastewater as a point source of antibiotic-resistance genes in the sediment of a freshwater lake. ISME J. 8, 1381–1390 (2014).
Yang, Y., Xu, C., Cao, X., Lin, H. & Wang, J. Antibiotic resistance genes in surface water of eutrophic urban lakes are related to heavy metals, antibiotics, lake morphology and anthropic impact. Ecotoxicology 26, 831–840 (2017).
Rizzo, L. et al. Urban wastewater treatment plants as hotspots for antibiotic resistant bacteria and genes spread into the environment: a review. Sci. Total Environ. 447, 345–360 (2013).
Zhang, X.-X., Zhang, T. & Fang, H. H. P. Antibiotic resistance genes in water environment. Appl. Microbiol. Biotechnol. 82, 397–414 (2009).
Su, H. C. et al. Persistence of antibiotic resistance genes and bacterial community changes in drinking water treatment system: from drinking water source to tap water. Sci. Total Environ. 616–617, 453–461 (2018).
Skariyachan, S. et al. Environmental monitoring of bacterial contamination and antibiotic resistance patterns of the fecal coliforms isolated from Cauvery River, a major drinking water source in Karnataka, India. Environ. Monit. Assess. 187, 279, https://doi.org/10.1007/s10661-015-4488-4 (2015).
Fernando, D. M. et al. Detection of antibiotic resistance genes in source and drinking water samples from a first nations community in Canada. Appl. Environ. Microbiol. 82, 4767–4775 (2016).
Lyimo, B., Buza, J., Subbiah, M., Smith, W. & Call, D. R. Comparison of antibiotic resistant Escherichia coli obtained from drinking water sources in northern Tanzania: a cross-sectional study. BMC Microbiol. 16, 1–10 (2016).
Jiang, L. et al. Prevalence of antibiotic resistance genes and their relationship with antibiotics in the Huangpu River and the drinking water sources, Shanghai, China. Sci. Total Environ. 458, 267–272 (2013).
Guo, X., Li, J., Yang, F., Yang, J. & Yin, D. Prevalence of sulfonamide and tetracycline resistance genes in drinking water treatment plants in the Yangtze River Delta, China. Sci. Total Environ. 493, 626–631 (2014).
Diwan, V. et al. Seasonal variations in water-quality, antibiotic residues, resistant bacteria and antibiotic resistance genes of Escherichia coli isolates from water and sediments of the Kshipra River in Central India. Int. J. Environ. Res. Public Health 15, 1–16 (2018).
Fick, J. et al. Contamination of surface, ground, and drinking water from pharmaceutical production. Environ. Toxicol. Chem. 28, 2522–2527 (2009).
Ramaswamy, B. R., Shanmugam, G., Velu, G., Rengarajan, B. & Larsson, D. G. J. GC-MS analysis and ecotoxicological risk assessment of triclosan, carbamazepine and parabens in Indian rivers. J. Hazard. Mater. 186, 1586–1593 (2011).
Gothwal, R. & Thatikonda, S. Mathematical model for the transport of fluoroquinolone and its resistant bacteria in aquatic environment. Environ. Sci. Pollut. Res. 25, 20439–20452 (2018).
David, S. & Roy, N. Public health perspectives from the biggest human mass gathering on earth: Kumbh Mela, India. Int. J. Infect. Dis. 47, 42–45 (2016).
Van Boeckel, T. P. et al. Global trends in antimicrobial use in food animals. Proc. Natl Acad. Sci. USA 112, 5649–5654 (2015).
Zhu, Y.-G. et al. Diverse and abundant antibiotic resistance genes in Chinese swine farms. Proc. Natl Acad. Sci. USA 110, 3435–3440 (2013).
Guo, J., Li, J., Chen, H., Bond, P. L. & Yuan, Z. Metagenomic analysis reveals wastewater treatment plants as hotspots of antibiotic resistance genes and mobile genetic elements. Water Res. 123, 468–478 (2017).
Yang, Y. et al. Antibiotics and antibiotic resistance genes in global lakes: a review and meta-analysis. Environ. Int. 116, 60–73 (2018).
Martínez, J. L., Coque, T. M. & Baquero, F. What is a resistance gene? Ranking risk in resistomes. Nat. Rev. Microbiol. 13, 116 (2015).
Czekalski, N., Sigdel, R., Birtel, J., Matthews, B. & Bürgmann, H. Does human activity impact the natural antibiotic resistance background? Abundance of antibiotic resistance genes in 21 Swiss lakes. Environ. Int. 81, 45–55 (2015).
Pruden, A., Arabi, M. & Storteboom, H. N. Correlation between upstream human activities and riverine antibiotic resistance genes. Environ. Sci. Technol. 46, 11541–11549 (2012).
Yang, Y., Liu, W., Xu, C., Wei, B. & Wang, J. Antibiotic resistance genes in lakes from middle and lower reaches of the Yangtze River, China: effect of land use and sediment characteristics. Chemosphere 178, 19–25 (2017).
Aminov, R. I. Horizontal gene exchange in environmental microbiota. Front. Microbiol. 2, 1–19 (2011).
Martinez, J. L. Environmental pollution by antibiotics and by antibiotic resistance determinants. Environ. Pollut. 157, 2893–2902 (2009).
Marathe, N. P. et al. Untreated urban waste contaminates Indian river sediments with resistance genes to last resort antibiotics. Water Res. 124, 388–397 (2017).
Proia, L. et al. Antibiotic resistance along an urban river impacted by treated wastewaters. Sci. Total Environ. 628–629, 453–466 (2018).
Ram, B. & Kumar, M. Correlation appraisal of antibiotic resistance with fecal, metal and microplastic contamination in a tropical Indian river, lakes and sewage. NPJ Clean Water https://doi.org/10.1007/978-981-32-9771-5_1 (2020).
Kumar, M. et al. Concurrence of antibiotic resistant bacteria (ARB), viruses, pharmaceuticals and personal care products (PPCPs) in ambient waters of Guwahati, India: urban vulnerability and resilience perspective. Sci. Total Environ. 693, 133640 (2019).
Kumar, M. et al. Treatment enhances the prevalence of antibiotic-resistant bacteria and antibiotic resistance genes in the wastewater of Sri Lanka, and India. Environ. Res. https://doi.org/10.1007/978-981-32-9771-5_1 (2020).
Kumar, M., Chaminda, T., Honda, R. & Furumai, H. Vulnerability of urban waters to emerging contaminants in India and Sri Lanka: resilience framework and strategy. APN Sci. Bull. 9, 57–66 (2019).
Honda, R. et al. Impacts of urbanization on the prevalence of antibioticresistant Escherichia coli in the Chaophraya River and its tributaries. Water Sci. Technol. 73, 362–374 (2016).
Xu, Y. Bin et al. Distribution of tetracycline resistance genes and AmpC β-lactamase genes in representative non-urban sewage plants and correlations with treatment processes and heavy metals. Chemosphere 170, 274–281 (2017).
Calero-Cáceres, W., Méndez, J., Martín-Díaz, J. & Muniesa, M. The occurrence of antibiotic resistance genes in a Mediterranean river and their persistence in the riverbed sediment. Environ. Pollut. 223, 384–394 (2017).
Yang, H. F., Cheng, J., Hu, L. F., Ye, Y. & Li, J. Bin. Plasmid-mediated quinolone resistance in extended-spectrum-β-lactamase- and AmpC β-lactamase-producing Serratia marcescens in China. Antimicrob. Agents Chemother. 56, 4529–4531 (2012).
Khan, G. A., Berglund, B., Khan, K. M., Lindgren, P. E. & Fick, J. Occurrence and abundance of antibiotics and resistance genes in rivers, canal and near drug formulation facilities—a study in Pakistan. PLoS ONE 8, 4–11 (2013).
Luo, Y. et al. Trends in antibiotic resistance genes occurrence in the Haihe River, China. Environ. Sci. Technol. 44, 7220–7225 (2010).
Ling, Z., Yang, Y., Huang, Y., Zou, S. & Luan, T. A preliminary investigation on the occurrence and distribution of antibiotic resistance genes in the Beijiang River, South China. J. Environ. Sci. (China) 25, 1656–1661 (2013).
Huerta, B. et al. Exploring the links between antibiotic occurrence, antibiotic resistance, and bacterial communities in water supply reservoirs. Sci. Total Environ. 456, 161–170 (2013).
Mahagamage, M., Chinthaka, S. D. M. & Manage, P. M. Assessment of water quality index for groundwater in the Kelani river basin, Sri Lanka. Int. J. Agric. Environ. Res. 2, 1158–1171 (2016).
Liyanage, C. P. & Yamada, K. Impact of Population Growth on the Water Quality of Natural Water Bodies. Sustainability 9, 1405 (2017).
Kehelella, K. H., Chaminda, G. G. T., Silva, G. H., Honda, R. & Kumar, M. Water quality modeling in Kelani river downstream. In Conf. Proc. 6th International Symposium on “Advances in Civil and Environmental Engineering Practices for Sustainable Development” (ACEPS-2018), ISSN: 2279-1329, 104–109 (Galle, Sri Lanka, 2018).
Herath, G. & Amaresekera, T. Assessment of urban and industrial pollution on water quality: Kelani River Sri Lanka. Southeast Asian Water Environ. 2, 91–98 (2007).
Sewwandi, H., Sulfikar, Chaminda, T., Honda, R. & Kumar, M. Antibiotic resistant Escherichia coli in Kelani River, Sri Lanka. In 6th International Symposiumon Advances in Civil and Environmental Engineering Practices for Sustainable Development (ACEPS-2018) (2018). https://doi.org/10.1515/9783110254587.7.
Sulfikar, S. S., Honda, R., Chaminda, T. & Kumar, M. in Emerging Issues in the Water Environment During Anthropocene: A South East Asian Perspective (eds Kumar, M., Snow, D. D. & Honda, R.) 1–14 (Springer, Singapore, 2020).
Acknowledgements
We acknowledge Asia Pacific Network (Reference Number: CRRP2016-06MY-Kumar) and JSPS KAKENHI (Grant Nos. 18KK0114 and 15H05223) for funding the research. We acknowledge Bhagwana Ram, Himaya Sewwandi, and Sulfikar for their help in routine analyses and summarizing the data.
Author information
Authors and Affiliations
Contributions
M.K. performed the entire interpretation, prepared the final draft of the paper, and revised and replied to the editors and referee comments. ARG data was generated under the supervision of R.H., while ARB data was generated under T.C. All three authors were the joint PIs of this APN-funded research, and sampling was done under the supervision of all three.
Corresponding author
Ethics declarations
Competing interests
The authors declare no competing interests.
Additional information
Publisher’s note Springer Nature remains neutral with regard to jurisdictional claims in published maps and institutional affiliations.
Supplementary information
Rights and permissions
Open Access This article is licensed under a Creative Commons Attribution 4.0 International License, which permits use, sharing, adaptation, distribution and reproduction in any medium or format, as long as you give appropriate credit to the original author(s) and the source, provide a link to the Creative Commons license, and indicate if changes were made. The images or other third party material in this article are included in the article’s Creative Commons license, unless indicated otherwise in a credit line to the material. If material is not included in the article’s Creative Commons license and your intended use is not permitted by statutory regulation or exceeds the permitted use, you will need to obtain permission directly from the copyright holder. To view a copy of this license, visit http://creativecommons.org/licenses/by/4.0/.
About this article

Cite this article
Kumar, M., Chaminda, G.G.T. & Honda, R. Seasonality impels the antibiotic resistance in Kelani River of the emerging economy of Sri Lanka. npj Clean Water 3, 12 (2020). https://doi.org/10.1038/s41545-020-0058-6
Received:
Accepted:
Published:
DOI: https://doi.org/10.1038/s41545-020-0058-6
This article is cited by
-
Distribution of bacterial community structures and spread of antibiotic resistome at industrially polluted sites of Mini River, Vadodara, Gujarat, India
Environmental Monitoring and Assessment (2024)
-
Selected freshwater fish species for assessing the water quality of the lower catchment of the Kelani River, Sri Lanka
Environmental Monitoring and Assessment (2022)
-
Potential discharge, attenuation and exposure risk of SARS-CoV-2 in natural water bodies receiving treated wastewater
npj Clean Water (2021)
-
Making Waves Perspectives of Modelling and Monitoring of SARS-CoV-2 in Aquatic Environment for COVID-19 Pandemic
Current Pollution Reports (2020)
