
Abstract
Identification of factors predicting and driving mortality in PD is important for patient information, disease management, and design of future clinical trials. This study included newly diagnosed PD patients and normal controls (NC) from a population-based study with repeated assessments over a 10-year period. We used the Kaplan–Meier method to estimate survival, Cox proportional hazards regression models to identify baseline risk factors of mortality, and Cox regression models with time-dependent covariates to evaluate the impact of four clinical milestones of advanced PD (visual hallucinations, recurrent falls, dementia, and nursing home placement) on mortality risk. During the 10-year study, 65 (34.2%) of 190 patients and 25 (12.3%) of 203 NC died, with an unadjusted hazard ratio (HR) of 2.85 (95% CI 1.80–4.52) and a HR of 2.48 (95% CI 1.55–3.95) when adjusted for confounders, including comorbidities. Higher age, more severe motor impairment, and postural instability-gait difficulty (PIGD) phenotype were independent baseline predictors of mortality. Each clinical milestone alone more than doubled the risk of death and had a cumulative effect on mortality, with a HR of 10.83 (95% CI 4.39–26.73) in those experiencing all four milestones. PD patients have an increased mortality risk that is disease-related and becomes evident early during the course of the disease. While motor severity and PIGD phenotype were early risk factors of mortality, clinical milestones signaled a substantially increased risk of death later during the disease course, highlighting their potential significance in clinical disease staging and prognosis.
Introduction
Although most studies report increased mortality in Parkinson’s disease (PD), the reported estimates vary substantially, and some studies even found that survival is unaltered1,2,3,4. Similar variability is observed for various mortality risk factors, including demographics and motor and non-motor symptoms. At the same time, important clinical milestones (visual hallucinations, recurrent falls, dementia, and nursing home placement) remain understudied5,6,7,8,9.
Previous studies have estimated the degree of increased mortality risk in PD to range from 0.9 to 3.81,2. The lack of accurate estimates can, in part, be explained by heterogeneity in study design. For example, the use of non-representative cohorts may yield higher mortality estimates than observed in the general PD population, as hospital-based studies are more likely to recruit advanced or atypical cases. Further, PD commonly occurs in the elderly population in which chronic comorbidities are common, and few studies have accounted for comorbidities, which may be an important source of confounding.
Accurate survival estimates and identification of early and late risk factors are valuable for health care planning and to recognise clinical features that might impact survival in clinical trials. However, given the limitations of previous studies, further studies are warranted to evaluate the true impact of PD on mortality. Against this background, we aimed to investigate survival in a group of incident PD patients followed for ten years from diagnosis compared to controls with comparable comorbidity status. Further, we sought to establish the contribution of key clinical milestones of advanced PD to excess mortality.
Results
Baseline characteristics
We included 393 subjects in this study; 190 patients with PD and 203 NC. Their demographics and clinical baseline characteristics are shown in Table 1.
Mortality in PD and controls
During the study period, 65 (34.2%) of 190 patients and 25 (12.3%) of 203 NC died (Fig. 1). The risk of dying for PD patients was substantially increased during the first 10 years after diagnosis compared to controls, with hazard ratios (HR) of 2.85 (95% CI 1.80–4.52, p < 0.001) in the unadjusted model and 2.48 (95% CI 1.55–3.95, p < 0.001) after adjustment for potential confounders. The Cox regression analysis met the assumptions of proportional HRs (Supplementary Fig. 1).

Ten year survival curves of PD and NC are displayed here. The shaded area represents the confidence intervals.
Baseline risk factors of mortality in PD
In addition to increased age (HR 2.20; 95% CI 1.52–3.17, p < 0.001), higher UPDRS motor scores (HR1.02; 95% CI 1.01–1.05, p = 0.02) and PIGD motor phenotype (HR 1.83; 95% CI 1.09–3.01, p = 0.02) were independent baseline predictors of mortality in PD. Neither sex, smoking, baseline HY stage, MMSE score, MADRS score, nor Charlson Comorbidity Index (CCI)10 predicted mortality among the PD patients (all p > 0.05, Supplementary Table 1).
Clinical milestones and mortality in PD
A total of 89 PD patients experienced hallucinations within the 10-year follow-up, with a median time from baseline to this milestone of 4.9 years (IQR 2.2–7.0). Similarly, a total of 88 patients experienced recurrent falls and for these patients, the median time from baseline was 6.0 years (IQR 3.7–8.1). Among those who developed PDD, the median time from baseline to dementia diagnosis was 5.1 years (IQR 4.5–8.0). Lastly, for those admitted to a nurse-staffed long-term care facility (n = 43), the median time to admittance from baseline was 6.4 years (IQR 4.5–7.6).
Falls and hallucinations were the clinical milestones with the longest time between occurrence and death, followed by the development of PDD, and admission to a nursing facility (Table 2). Cox regression models revealed that each of these milestones was associated with a substantially increased risk of dying when compared to those who did not experience the milestone (Table 2). Further analyses demonstrated that the risk of dying increased substantially with the cumulative number of milestones evolving over time (Table 2, Fig. 2). While the risk of dying during follow-up was more than doubled after the first event (HR 2.24; 95% CI 1.02–4.93, p = 0.043), it was about fourfold increased after the second and third events, and more than 10-fold increased for those developing all four event milestones (HR 10.83; 95% CI 4.39–26.73, p < 0.001).
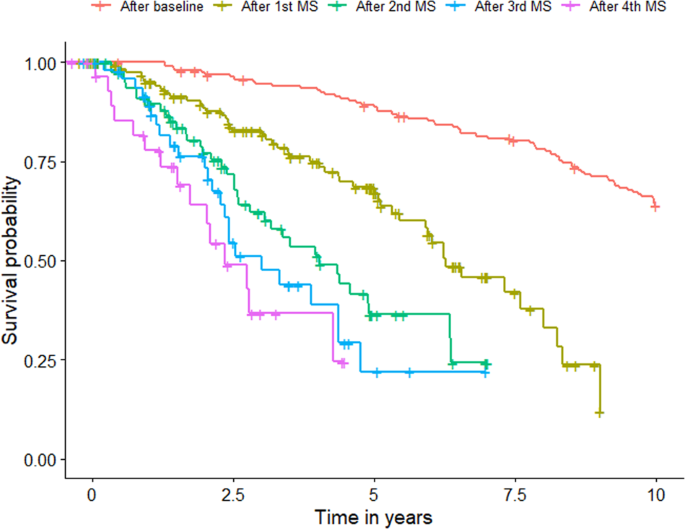
Here we display the survival curves for the presentation of clinical milestones (MS) cumulatively. The red curve represents the complete cohort’s survival and is included as a reference. The curve labels represent the cumulative presentation of the clinical milestones.
Discussion
In this prospective population-based study of an incident PD cohort, we found excess mortality linked to PD that was evident early during the disease and more than doubled the risk of dying over the 10-year follow-up period independently of age, sex, smoking, and comorbidity status. While motor severity and phenotype were early disease-related risk factors of mortality in PD, the development of clinical milestones signaled a substantially increased risk of death later during the disease course. Thus, evaluating these clinical milestones may represent a meaningful way of assessing disease stage and prognosis in PD.
Other incident PD cohorts have reported a similar hazard rate for mortality in PD while adjusting for comorbidities, with slightly more than double the risk of death in patients with PD, but each of these cohorts included only one sex due to the original design of their studies11,12. Further, medical records–based studies have also reported similar risk while adjusting for the same confounders13,14 as well as captured how this risk gradually increases with advancing disease4. In contrast, the risk of death observed in our study is higher compared with the meta-analysis of other incident PD cohorts1. This could be related to the adjustment for comorbidities in our model, which could have uncovered a more substantial effect of PD on mortality than reported by prior studies. Additional factors contributing to the discrepancies in the reports of mortality risk attributed to PD in the literature are related to the different methods used to report risk15,16.
We showed that differences in mortality became evident early during the course of PD, which contradicts some studies of early PD suggesting that patients are not at increased risk of mortality until the later disease stages. Failure to detect the risk of mortality associated with PD in these studies might instead be explained by a study’s low statistical power or by recruiting an unbalanced control group in comorbidities, reducing the possibility of detecting the actual effect.
Previous studies have shown that life expectancy is lower in atypical parkinsonism than in PD patients3, however in our study the long follow-up period and rigorous diagnostic procedures make it unlikely that we have included atypical parkinsonism cases in our cohort; a claim that is further supported by our post-mortem findings in a substantial subset of patients. In our study, those with higher motor severity and PIGD phenotype are at the highest risk of early death and probably drive the early differences seen on a group level. Motor impairment and PIDG phenotype have similarly been associated with more deleterious forms of PD and more severe changes in both dopaminergic and non-dopaminergic brain structures17. Although the results of our study showed that motor symptoms predicted long-term survival at baseline, non-motor symptoms, assessed with the MMSE and MADS scales, and comorbidities were not associated with mortality. The latter finding indicates that the increased mortality risk in PD is disease-related and not linked to comorbidities at baseline.
Reaching PD clinical milestones has also been associated with more severe forms of PD using different clinical subtyping systems and developing dementia specifically with a higher risk of mortality18,19,20. In this study, the presence of any of these clinical milestones over time was associated with an at least 2-fold higher risk for mortality among PD patients.
Furthermore, we were able to observe a cumulative effect in the appearance of clinical milestones, with a HR of more than 10 in those experiencing all four milestones. In general, falls and hallucinations were the clinical milestones with the longest time between onset and death, followed by PDD development and admission to a nursing facility. This same sequential order of appearance supports the argument of a possible correlation between clinical features of the advanced disease state and the scores for cortical Lewy bodies21. Evaluating these clinical milestones may represent an alternative way of assessing advanced PD, since other traditionally used methods, such as the Hoehn and Yahr scale, are heavily based on motor disability, depreciating the multifaceted nature of the disease22,23.
Although this study is population-based and representative of the Norwegian population, not all of our results might be generalized to populations with different backgrounds, including demographics, comorbidities, and access to healthcare. However, this limitation is not unique to our study and does not affect the accuracy of the risks reported here. Furthermore, our study has several major strengths, including the population-based controlled design, frequent and standardized assessments from time of diagnosis, ten years of prospective follow-up, and the aforementioned post-mortem agreement of the diagnosis in a noteworthy subset of patients with PD.
This study provides essential data on mortality in PD and the close relationship between the clinical milestones and mortality risk, highlighting their potentially significant implications for clinical disease staging and prognosis.
Methods
Study design and population
The current investigation is part of the ongoing Norwegian ParkWest project, a prospective, population-based study of the incidence, neurobiology, and prognosis of PD24. The recruitment period was between 1 November 2004 and 31 August 2006. The recruitment methods and study design have been described before in detail24. In total, 212 incident PD cases and 205 controls assented to engage in the ParkWest study. Twenty-four participants were later excluded due to re-diagnosis (22 patients and 2 normal controls (NC)), leaving 393 eligible participants for this study. All patients fulfilled UK Brain Bank criteria25 of PD at their last interview, with a post-mortem agreement in a subgroup of patients who underwent autopsy (n = 42). Controls were recruited in the same geographical area from multiple sources, including friends and spouses of patients and members of public organizations for the elderly ensuring a similar socioeconomic background26.
Standard protocol approvals, registrations, and patient consents
The study was approved by the Western Norway Regional Committee for Medical and Health Research Ethics (#2010/1700) and conducted according to the Declaration of Helsinki. All participants gave written informed consent.
Examination program
We obtained demographics and medical history information with semi-structured interviews and performed comprehensive medical and neurological examinations at baseline. Standardized clinical follow-up was conducted every 6 months in patients, with extended visits in both patients and NC after 1-year and at 2-year intervals after that.
We rated disease stage at baseline and follow-up using the Hoehn and Yahr scale and motor severity using the unified PD rating scale (UPDRS) motor score (part III)27,28. Patients were assessed drug-naive (97.3%, n = 185) or in off-state at baseline, while in “on-state” during follow-up. The motor phenotype was classified as postural instability and gait disorder (PIGD) or tremor-dominant or intermediate following the classification algorithm described by Jankovic et al.29. We assessed global cognitive function using the mini-mental state examination (MMSE)30, neuropsychiatric symptoms using the 10-item neuropsychiatric inventory (NPI),31 and depressive symptoms using the Montgomery–Åsberg depression rating scale (MADRS)32.
For the present study, we evaluated clinical milestones as follows: visual hallucinations were deemed present when scoring ≥2 on UPDRS I item 2 (“benign” hallucinations with insight retained or worse) or ≥1 on NPI item 2 (presence of hallucinations). Recurrent falls were designated as obtaining a score of ≥2 on UPDRS II item 13 (occasional falls, less than once daily or worse) or ≥3 on UPDRS II item 14 (occasionally falls because of freezing or worse). Dementia associated with PD was defined as fulfilling Movement Disorders Society diagnostic criteria at level II33,34, and nursing home placement as first time admitted to a nurse staffed long-term care facility. Timing of milestones was set to the date of the first visit with criteria fulfilled for visual hallucinations, recurrent falls, and dementia, whereas for nursing home placement, the date of admittance was used.
We evaluated comorbidity burden with the CCI, a commonly accepted scale in epidemiologic research that employs a specified list of the most significant chronic diseases with regard to death. Mortality status was obtained by continual follow-up, including a review of clinical notes.
Statistics
Baseline characteristics of the cohort are reported using counts and proportions for categorical variables and means and standard deviations for continuous variables. Comparison between groups was made with Student’s t-tests, Mann–Whitney U tests and Chi-square tests as appropriate. Each milestone’s time to occurrence for those who experienced the milestone within the 10 years follow-up was presented as medians and interquartile ranges (IQR).
Survival time following the inclusion date was analyzed using the Kaplan-Meier estimator (to allow for censoring) and summarized using the median survival time (either IQR or 95% confidence interval) and Kaplan–Meier plots. We compared the risk of death in PD and NC using Cox proportional hazards models. We adjusted models for sex, and baseline age and comorbidities using the CCI total score without considering age to avoid double adjustment and a clinical quantification of cigarette smoking using pack-year. We estimated hazard risk with their 95% confidence interval (CI) and tested with Wald tests. The proportional hazards assumption was tested using log minus log plots.
To explore early mortality risk factors in PD, we again used Cox models. The model included sex and baseline values for age, CCI total score (without considering age), UPDRS part III, motor phenotype classification, the Hoehn and Yahr scale, MMSE, smoking pack-year exposure, and MADRS.
Similarly, to examine late-stage PD mortality risk factors, median (IQR) survival time from the onset of each clinical milestone and from the onset of the kth milestone was estimated using the Kaplan–Meier estimator. Subsequently, the clinical milestones were entered individually into Cox models as time-dependent variables with values zero before the occurrence of milestones and values of one from the time of occurrence. For the cumulative count of milestones, the count was updated (to k) at the time of occurrence of the kth milestone and treated as a categorical variable. The HRs were adjusted with sex and baseline values for age, CCI total score (without considering age), UPDRS part III, motor phenotype classification, the Hoehn and Yahr scale, MMSE, smoking pack-year, and MADRS.
We considered p < 0.05 statistically significant. All statistical analyses were performed using SPSS 23.0 (IBM Corp., Armonk, NY) and R version 4.0.2. Software.
Reporting summary
Further information on research design is available in the Nature Research Reporting Summary linked to this article.
Data availability
Qualified external researchers can request access to anonymized patient-level data, respecting patient informed consent, from the corresponding author on reasonable request.
References
Macleod, A. D., Taylor, K. S. & Counsell, C. E. Mortality in Parkinson’s disease: a systematic review and meta-analysis. Mov. Disord. 29, 1615–1622 (2014).
Xu, J., Gong, D. D., Man, C. F. & Fan, Y. Parkinson’s disease and risk of mortality: meta-analysis and systematic review. Acta Neurol. Scand. 129, 71–79 (2014).
Bäckström, D. et al. Early predictors of mortality in parkinsonism and Parkinson disease. A population-based study. Neurology 91, e2045–e2056 (2018).
Okunoye, O., Horsfall, L., Marston, L., Walters, K. & Schrag, A. Mortality of people with parkinson’s disease in a large uk-based cohort study: time trends and relationship to disease duration. Mov. Disord. 36, 2811–2820 (2021).
Elbaz, A. et al. Survival study of Parkinson disease in Olmsted County, Minnesota. Arch. Neurol. 60, 91–96 (2003).
Hely, M. A., Reid, W. G., Adena, M. A., Halliday, G. M. & Morris, J. G. The Sydney multicenter study of Parkinson’s disease: the inevitability of dementia at 20 years. Mov. Disord. 23, 837–844 (2008).
Forsaa, E. B., Larsen, J. P., Wentzel-Larsen, T. & Alves, G. What predicts mortality in Parkinson disease?: a prospective population-based long-term study. Neurology 75, 1270–1276 (2010).
Hely, M. A. et al. The sydney multicentre study of Parkinson’s disease: progression and mortality at 10 years. J. Neurol. Neurosurg. Psychiatry 67, 300–307 (1999).
Hobson, P., Meara, J. & Ishihara-Paul, L. The estimated life expectancy in a community cohort of Parkinson’s disease patients with and without dementia, compared with the UK population. J. Neurol. Neurosurg. Psychiatry 81, 1093–1098 (2010).
Charlson, M. E., Pompei, P., Ales, K. L. & MacKenzie, C. R. A new method of classifying prognostic comorbidity in longitudinal studies: development and validation. J. Chronic Dis. 40, 373–383 (1987).
Driver, J. A., Kurth, T., Buring, J. E., Gaziano, J. M. & Logroscino, G. Parkinson disease and risk of mortality: a prospective comorbidity-matched cohort study. Neurology 70, 1423–1430 (2008).
Winter, A. C., Rist, P. M., Buring, J. E. & Kurth, T. Prospective comorbidity-matched study of Parkinson’s disease and risk of mortality among women. BMJ Open 6, e011888 (2016).
Yoon, S. Y., Shin, J., Kim, Y. W., Chang, J. S. & Won Kim, H. The mortality rate of Parkinson’s disease and related comorbidities: a nationwide population-based matched cohort study in Korea. Age Ageing 50, 1182–1188 (2020).
Choi, H. G., Lim, J.-S., Lee, Y. K., Sim, S. & Kim, M. Mortality and cause of death in South Korean patients with Parkinson’s disease: a longitudinal follow-up study using a national sample cohort. BMJ Open 9, e029776 (2019).
George, A., Stead, T. S. & Ganti, L. What’s the risk: differentiating risk ratios, odds ratios, and hazard ratios? Cureus 12, e10047–e10047 (2020).
Julious, S. A., Nicholl, J. & George, S. Why do we continue to use standardized mortality ratios for small area comparisons? J. Public Health Med 23, 40–46 (2001).
Nagae, L. M. et al. Microstructural changes within the basal ganglia differ between Parkinson disease subtypes. Front.Neuroanat 10, 17 (2016).
Levy, G. et al. The association of incident dementia with mortality in PD. Neurology 59, 1708–1713 (2002).
De Pablo-Fernández, E., Lees, A. J., Holton, J. L. & Warner, T. T. Prognosis and neuropathologic correlation of clinical subtypes of Parkinson disease. JAMA Neurol. 76, 470–479 (2019).
Ygland Rödström, E. & Puschmann, A. Clinical classification systems and long-term outcome in mid- and late-stage Parkinson’s disease. npj Parkinson’s Dis. 7, 66 (2021).
Kempster, P. A., O’Sullivan, S. S., Holton, J. L., Revesz, T. & Lees, A. J. Relationships between age and late progression of Parkinson’s disease: a clinico-pathological study. Brain 133, 1755–1762 (2010).
Bjornestad, A., Pedersen, K. F., Tysnes, O. B. & Alves, G. Clinical milestones in Parkinson’s disease: a 7-year population-based incident cohort study. Parkinsonism Relat. Disord. 42, 28–33 (2017).
van Rooden, S. M., Visser, M., Verbaan, D., Marinus, J. & van Hilten, J. J. Patterns of motor and non-motor features in Parkinson’s disease. J. Neurol. Neurosurg. Psychiatry 80, 846–850 (2009).
Alves, G. et al. Incidence of Parkinson’s disease in Norway: the Norwegian ParkWest study. J. Neurol. Neurosurg. Psychiatry 80, 851–857 (2009).
Hughes, A. J., Daniel, S. E., Kilford, L. & Lees, A. J. Accuracy of clinical diagnosis of idiopathic Parkinson’s disease: a clinico-pathological study of 100 cases. J. Neurol. Neurosurg. Psychiatry 55, 181–184 (1992).
Bjornestad, A., Tysnes, O. B., Larsen, J. P. & Alves, G. Loss of independence in early Parkinson disease: a 5-year population-based incident cohort study. Neurology 87, 1599–1606 (2016).
Hoehn, M. M. & Yahr, M. D. Parkinsonism: onset, progression and mortality. Neurology 17, 427–442 (1967).
Fahn, S., Elton, R. & UPDRS program members Parkinson’s Disease Rating Scale. In Recent developments in Parkinson’s disease Vol. 2, 153–163 (eds Fahn, S. et al.) (Macmillanm Healthcare Information, Florham Park, 1987).
Jankovic, J. et al. Variable expression of Parkinson’s disease: a base-line analysis of the DATATOP cohort. The Parkinson Study Group. Neurology 40, 1529–1534 (1990).
Folstein, M. F., Folstein, S. E. & McHugh, P. R. “Mini-mental state”. A practical method for grading the cognitive state of patients for the clinician. J. Psychiatr. Res. 12, 189–198 (1975).
Cummings, J. L. The neuropsychiatric inventory: assessing psychopathology in dementia patients. Neurology 48, S10–16 (1997).
Montgomery, S. A. & Åsberg, M. A new depression scale designed to be sensitive to change. Br. J. Psychiatry 134, 382–389 (1979).
Emre, M. et al. Clinical diagnostic criteria for dementia associated with Parkinson’s disease. Mov. Disord. 22, 1689–1707 (2007). quiz 1837.
Dubois, B. et al. Diagnostic procedures for Parkinson’s disease dementia: recommendations from the movement disorder society task force. Mov. Disord. 22, 2314–2324 (2007).
Acknowledgements
We are grateful to all patients for their participation in this study and thank the members of the Norwegian ParkWest study group and all other personnel involved in this study for their contributions. This study was supported by the Research Council of Norway (grant# 177966), the Western Norway Regional Health Authority (grant# 911218 and # 911949), and the Norwegian Parkinson’s Research Foundation. The sponsors were not involved in the study design, in the collection, analysis, and interpretation of data, in the writing of the report, or in the decision to submit the article for publication. The University of Stavanger supported M.C.G.
Author information
Authors and Affiliations
Contributions
M.C.G.: Study concept and design, statistical analysis and interpretation of data, writing of the first draft. I.D.: Statistical analysis of the data and critical revision of the manuscript. J.M.-G.: Study concept and design, acquisition of data, critical revision of the manuscript for important intellectual content. O.-B.T.: Study concept and design, acquisition of data, critical revision of the manuscript for important intellectual content. G.A.: Study concept and design, acquisition of data, critical revision of the manuscript for important intellectual content. M.C.G. takes responsibility for the integrity of the data and the accuracy of the data analysis. All authors have approved the final article.
Corresponding author
Ethics declarations
Competing interests
The authors declare no competing interests.
Additional information
Publisher’s note Springer Nature remains neutral with regard to jurisdictional claims in published maps and institutional affiliations.
Supplementary information
Rights and permissions
Open Access This article is licensed under a Creative Commons Attribution 4.0 International License, which permits use, sharing, adaptation, distribution and reproduction in any medium or format, as long as you give appropriate credit to the original author(s) and the source, provide a link to the Creative Commons license, and indicate if changes were made. The images or other third party material in this article are included in the article’s Creative Commons license, unless indicated otherwise in a credit line to the material. If material is not included in the article’s Creative Commons license and your intended use is not permitted by statutory regulation or exceeds the permitted use, you will need to obtain permission directly from the copyright holder. To view a copy of this license, visit http://creativecommons.org/licenses/by/4.0/.
About this article

Cite this article
Gonzalez, M.C., Dalen, I., Maple-Grødem, J. et al. Parkinson’s disease clinical milestones and mortality. npj Parkinsons Dis. 8, 58 (2022). https://doi.org/10.1038/s41531-022-00320-z
Received:
Accepted:
Published:
DOI: https://doi.org/10.1038/s41531-022-00320-z
This article is cited by
-
Classification of long-term clinical course of Parkinson’s disease using clustering algorithms on social support registry database
Journal of Big Data (2023)
-
Association between smoking and all-cause mortality in Parkinson’s disease
npj Parkinson's Disease (2023)
-
Circadian clock disruption promotes the degeneration of dopaminergic neurons in male Drosophila
Nature Communications (2023)
-
Theta oscillations and minor hallucinations in Parkinson’s disease reveal decrease in frontal lobe functions and later cognitive decline
Nature Mental Health (2023)
