
Abstract
Small organic molecules can alter the degradation rates of the magnesium alloy ZE41. However, identifying suitable candidate compounds from the vast chemical space requires sophisticated tools. The information contained in only a few molecular descriptors derived from recursive feature elimination was previously shown to hold the potential for determining such candidates using deep neural networks. We evaluate the capability of these networks to generalise by blind testing them on 15 randomly selected, completely unseen compounds. We find that their generalisation ability is still somewhat limited, most likely due to the relatively small amount of available training data. However, we demonstrate that our approach is scalable; meaning deficiencies caused by data limitations can presumably be overcome as the data availability increases. Finally, we illustrate the influence and importance of well-chosen descriptors towards the predictive power of deep neural networks.
Introduction
Magnesium (Mg) and its alloys have distinct properties that render them promising materials for various applications, ranging from aerospace and automotive to biomedical and energy storage. However, it is essential to control the surface reactivity characteristics of Mg to unlock its full potential in each particular application field. For example, preventing corrosion is crucial for transport applications (e.g., aerospace and automotive), while medical applications (e.g., temporary biodegradable implants) require tailored degradation rates. For batteries with a Mg anode, the dissolution rate has to be adapted to maintain a constant output voltage and to protect the utilisation efficiency, e.g., from the occurring chunk effect1,2,3. Small organic molecules exhibit great potential in controlling corrosion in these applications, for which they are—depending on the target application— typically incorporated into a complex coating system in transportation applications or become a dissolved component of the electrolyte in Mg-air batteries.
The chemical space of compounds with potentially useful properties is practically infinite 4, rendering purely experimental approaches insufficient despite impressive progress in the field of high-throughput testing. Data-driven computational methods have emerged as powerful tools for the prediction and identification of useful corrosion inhibitors and can thus enable a more efficient design of experiments. Exploring large areas of chemical space can become orders of magnitude faster, allowing the pre-selection of promising candidates for in-depth experimental testing. At the same time, further insights into the underlying chemical mechanisms of corrosion and its inhibition can be obtained, which in turn provide additional input features for predictive quantitative structure-property relationships (QSPRs).
To develop accurate and robust predictive models, a sufficiently large, reliable, and chemically diverse database is required, reflecting the complexity of the relevant chemical environment. Cheminformatics software packages, such as RDKit and alvaDesc, enable the structural encoding of the numerous different functional entities and molecular features included in such databases. Aside from that, advances in computing power and simulation algorithms have enabled simulations (e.g., relying on density functional theory or (semi empirical) force field calculations) that can provide a wide range of potentially useful molecular descriptors5. By selecting only the most suitable descriptors and using them as input for a QSPR model, a more thorough and nuanced analysis of the potential effectiveness of a given compound can be provided. As additional data becomes available, the model can be continually refined and improved, ensuring that the most effective dissolution modulators are identified.
The predictive performance of the trained QSPR model depends significantly on the selected molecular features, as high correlation between input features or low correlation with the target property can compromise the model. In recent years, machine learning models have become increasingly popular in corrosion modelling6,7,8,9. In Schiessler et al. 10, we compared the capabilities of statistical methods, such as the analysis of variance (ANOVA11,12,13,14), with recursive feature elimination (RFE15) based on random forests16,17,18 in selecting suitable input features of 60 compounds for a deep neural network to predict the corrosion inhibition efficiencies of chemical compounds for the magnesium alloy ZE41. Descriptors derived from density functional theory calculations could be identified as highly significant for predicting the experimental performance of corrosion inhibitors, when joined with input features derived from the molecular structure. Combining the sparse feature selection strategies with deep learning forms a predictive QSPR framework that can be used for the identification of promising corrosion inhibitors. However, when working with small datasets there exists a risk of overfitting on the training data, which will lead to results that do not generalise well and may not be able to give useful insights beyond the training domain19,20.
In this study, we predict and test the corrosion inhibition efficiencies of 15 previously unseen compounds that were selected using the ExChem21 routine to evaluate the limitations of the models presented in Schiessler et al.10. The fundamental concept of ExChem is based on molecular similarities calculated from the Smooth Overlap of Atomic Positions (SOAP)22,23 approach. The molecules in the dataset that was used to train the underlying supervised machine learning model are represented in form of a 2D map following a dimension reduction approach, thereby visualising the relationships between molecular structure and corrosion inhibition performance via the formation of similarity clusters. Moreover, ExChem facilitates the projection of a database of commercially available compounds onto the landscape of known chemical space and thus enables a rational selection of compounds for subsequent experimental evaluation based on structural similarities between the two databases and by providing estimates for the corrosion inhibition performance of the untested small organic molecules. After confirming the robustness of the feature selection process, the predictive performance of the neural networks is evaluated. Identified outliers are discussed with respect to their chemical features to explain deviations occurring between experimental and predicted corrosion inhibition properties. Furthermore we assess the effect of integrating more data into the training set and confirm the scalability of our approach.
Results and discussion
Similarity-based compound selection
Under the overarching goal to find promising magnesium dissolution modulators for the magnesium alloy ZE41 in the vast chemical space, we tested the limits of the machine learning models as presented in our previous study10 with respect to prediction performance and scalability. Therefore, we selected blind test candidates using the ExChem routine from a database of over 7000 commercially available chemicals, as provided by Thermo Fisher Scientific21. A database of 60 magnesium dissolution modulators for ZE41, originally used to train the machine learning models, served as foundation for the approach10,24. Molecular similarities of the original training data and the database of commercially available compounds were calculated using the SOAP kernel with a cutoff radius rc = 2.0 Å, a Gaussian width ξ = 0.3 Å and ζ = 2 (cf. Methods)22,23. We reduced the resulting high-dimensional similarity matrix to two dimensions using kernel principal component analysis. Correlating the two-dimensional data with experimentally measured corrosion inhibition efficiencies for the respective compounds resulted in a structure-property landscape, as shown in Fig. 1.

The axes represent the two principal components (PC) resulting from the kernel principal component analysis. Based on this map, untested compounds of interest were selected for further investigation using the ExChem routine. Twenty of the original 60 structures were randomly chosen as `parents' (crossed circles), for which highly similar compounds were determined out of a pool of commercially available chemicals. The numbers indicate which of the selected test candidates as defined in Table 1 correspond to which parents.
A clear relationship between molecular structure and corrosion inhibition efficiency becomes evident, where compounds yielding corrosion inhibiting effects are located predominantly on the right side of the landscape (green circles) and compounds accelerating corrosion are located mainly on the left side (purple circles). The ExChem routine was used to identify potential test candidates in the commercial database that exhibit high similarity to certain compounds that were already experimentally validated. Initially, 20 compounds of interest were randomly selected from the experimental database. Each compound served as reference (‘parent’) to identify five highly similar structures (‘children’) in the commercial database based on the underlying SOAP similarities. Out of the resulting 100 structures, 20 were randomly chosen for experimental blind testing. Since four of these 20 were not soluble in water, they were removed from the pool of blind test candidates. The remaining 16 selected compounds are listed in Table 1 along with their respective indices, names and experimentally measured inhibition efficiencies. The associated parent structures are marked with crossed circles in Fig. 1 along with the indices of the selected children, i.e., the chosen blind test candidates. Compound 2 was excluded during the evaluation phase as the required materials could not be delivered. In the following, we evaluate the robustness of the feature selection process given the availability of this additional dataset, as well as the performance of the predictive models against the presented blind test data, which have been withheld from the model training process.
Feature selection robustness
We investigated the quality of selected features that were presented in our previous study10 by exploring how susceptible the feature selection results are to changes in input data. The original 60 sample dataset10,24 was augmented by the 15 blind testing samples given in Table 1, forming a combined dataset of 75 compounds. This gave us a number of dataset compositions that we use throughout this manuscript:
-
original dataset (60 compounds): DS60
-
blind testing dataset (15 compounds): DS15
-
combined dataset (75 compounds): DS75
On each composition, we performed grouped feature selection using RFE based on random forests. Data were split into 10 cross-validation folds (which differ per dataset composition), and on each fold the process was repeated 100 times using varying random seeds. From the resulting 1,000 top five groups per dataset composition we report the ones that got selected most often, cf. Table 2.
As we can see in Table 2, the top five feature sets FS60 and FS75 found for the original (DS60) and combined (DS75) dataset compositions overlap in three out of five components. The remaining two from each set (CATS3D_02_AP and Mor04m for FS60, HOMO and E2s for FS75) do in fact come up in the other dataset composition’s respective best feature sets list, just not in first place. FS60 and FS75 were chosen in 38% and 30% of cases respectively. The winning feature set FS15 for the blind testing dataset composition DS15 on the other hand was chosen in only 12% of all runs, with a greater variation in included candidates. This comes as no surprise, as 15 data points is quite few in most machine learning contexts. The best features for the original dataset, FS60, have no overlap with the blind testing set winners FS15. From this we surmise a somewhat limited ability of FS60 to accurately capture the specific properties of the blind testing dataset, as well as a reduced capacity to generalise. The winning feature set FS75 determined from the combined dataset composition includes descriptors from both FS60 and FS15. It is noteworthy that HOMO, a DFT-derived descriptor denoting the highest occupied molecular orbital energy level, was present in the second best feature set for DS60, and came up in the shared first place for best feature set in our original study10. This descriptor is included in both FS75 and FS15 and seems to play a crucial role in capturing properties of the presented corrosion inhibition dataset.
Feature selection robustness was furthermore investigated under change of target metric (using inhibition power/dB instead of inhibition efficiency/%,25) and exhibited qualitatively comparable behaviour to the case we presented here. Since subsequent predictive models trained on the thereby identified feature sets did not lead to relevant performance increase, we elected to only present inhibition efficiency/% results which are directly comparable to our previous study10. Additional information regarding this metric as well as results from the related feature selection process can be found in the Supplementary Notes as well as Supplementary Table 1.
Generalisation ability of predictive models
One very important concern is the question of how well predictive models trained on the original data are able to generalise and capture the properties of completely unseen (i.e., blind testing) data. To this end, we repeatedly fitted a deep neural network on DS60, using only inputs based on the associated winning feature set FS60. The training data were split into the same 10 cross-validation folds that we used during the feature selection process, and on each fold the network was trained 100 times using varying random seeds. The blind testing dataset DS15 served as a completely unseen test set. Figure 2 shows the distribution of predicted inhibition efficiency values per compound in the blind testing set, aggregated over all cross-validation folds and random seeds. The detailed prediction means and standard deviations are provided in Supplementary Table 2.
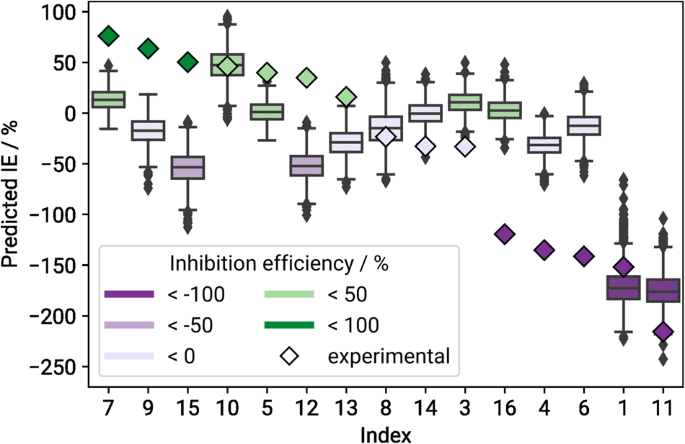
Boxes are coloured according to the compound’s mean predicted IE values in %. Compounds are sorted by descending mean experimental IE values, which are depicted as coloured diamonds.
Only about half of the compounds in DS15 get predicted correctly or within reasonable margins of error. The resulting root mean squared error (RMSE) for the blind testing set is fairly high at 73 percentage points (pp), cf. Table 3 for more statistics. We can see that the models have a tendency to underestimate inhibitors (i.e., compounds with IE > 0), but overestimate accelerators, as can be seen also in previous studies21,26. It is also notable that all but two prediction means lie within approximately ± 50 IE, which is where the majority of both the original as well as blind testing target values are situated. It is a common problem in machine learning that simply predicting the mean value of the target variable distribution might lead to a lower training loss than trying to find more complex dependencies. This behaviour can be indicative of overfitting or a suboptimal network architecture27. Figure 3 shows the average predicted over experimental IE, with the solid blue line representing the resulting linear regression curve, and the orange dashed line marking the perfect fit.

The solid blue line marks the resulting linear regression curve, the dashed orange line represents perfect fit.
Overall we can conclude that the model trained on the original dataset, with features selected only for those data (denoted FS60/DS60), is able to predict the behaviour of completely unseen components only moderately well. This does not come as a huge surprise for two main reasons: Firstly, there is no overlap between FS60 and FS15. This need not necessarily mean that FS60 is entirely unable to adequately capture the properties of compounds from DS15, but it is an early indicator for results of reduced quality. Secondly, with only 60 samples in the original dataset we have to expect overfitting both for the feature selection process and especially the training of deep neural networks. The network architectures in Schiessler et al.10 where chosen to vary as little as possible across a range of input feature counts, leading to overparameterised networks especially when working with very few features. With more fine-tuning of the network architecture and training hyperparameters, improved results might well be possible even on the blind dataset. However we can also make use of existing outliers to both gain important insights into the predictive domain of our models, as well as better understand the involved corrosion processes, or even identify yet unknown aspects of corrosion. In the following section we therefore include an extensive discussion of several components that obtained particularly conspicuous results.
Outliers
In Fig. 2 there are six compounds which are particularly salient, and which we consider to be strong outliers from the perspective of our deep learning models, cf. Fig. 4. These are compounds 9, 12, and 15, which are moderate to strong inhibitors but get qualitatively mispredicted as mild to strong accelerators, as well as compounds 4, 6 and 16, which are very strong accelerators but get predicted as only mild to moderate accelerators.
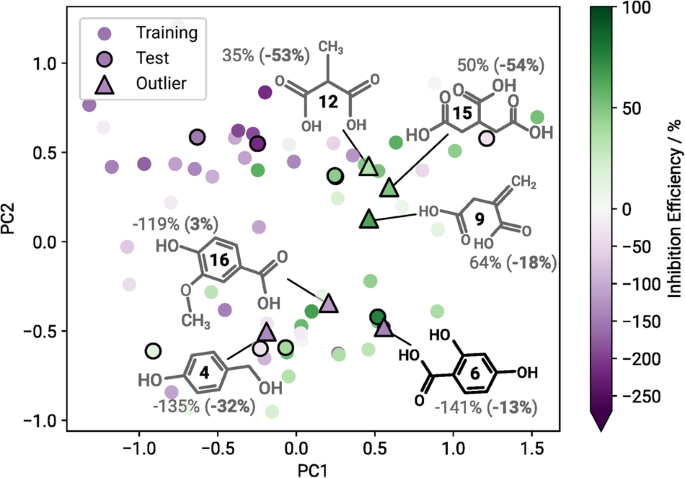
Compounds identified as extreme outliers are marked accordingly (△) and illustrated along with their measured (predicted) inhibition efficiency. Predictions from FS60 / DS60 experiments.
To better understand potential reasons why these compounds appear as outliers for the prediction models, deeper insights into their molecular structure shall be given. Analogously to Fig. 1, a structure-property landscape was generated for the total dataset of 75 compounds, where the compounds we consider to be outliers are marked accordingly (see Fig. 4). Analysing the resulting map, regions where compounds exhibit a similar corrosion inhibition efficiency indicate a structure-property relationship. Generally, it appears that corrosion accelerators are predominantly on the left side of the map and corrosion inhibitors on the right. Additionally, the structures are split into aliphatics (top side of the map) and aromatics (bottom side of the map).
2,4-Dihydroxybenzoic acid (compound 6) is located in a cluster predominantly populated by corrosion inhibitors, although experimentally it turns out to be a strong corrosion accelerator. It was still qualitatively correctly predicted as an accelerator. Compounds 6 is projected directly on top of 3,4-Dihydroxybenzoic acid, the strongest corrosion accelerator (-270% IE) of the original dataset. However the strongest corrosion inhibitor present in the blind testing set, 3,4-Pyridinedicarboxylic acid (compound 7), is located in the direct proximity as well. Apparently both corrosion inhibitors as well as accelerators contain mutual features in this region, rendering them similar in structure, even though they show different behaviours in the experiment. The trained models recognised a corrosion accelerator based on the selected features, but did not capture the subtle features that distinguish a strong from a weak accelerator, which is why the IE was overestimated. The overestimated IEs of 4-Hydroxybenzylalcohol (compound 4) and vanillic acid (compound 16) are situated in the same area of the map and can be explained accordingly. The structure-property relationship is not obvious in this region, as the compounds projected onto this area of the map exhibit structural features that are connected to varying corrosion inhibition efficiencies. Additionally, the experimental values of the three compounds 4, 6 and 16 lie at the lower edge of the target data distribution, further complicating accurate predictions. Adding more data points to this region, i.e., experimentally testing more compounds that exhibit similar structural features, is likely to improve the prediction performance for this domain.
Analysis of compounds 9, 12 and 15 shows that they were projected close to a region populated by weak corrosion inhibitors and accelerators. All of these compounds yield a moderate IE in the experiment and are mapped close to each other onto the structure-property landscape. The significant underestimations of the IEs probably stem from the absence of comparable corrosion inhibitors in this region. Furthermore, the selected features do not seem to capture the occurring structure-property relationship here accurately. However, future predictions for this region of the structure-property landscape are expected to improve with additional data.
Generalisation ability of the winning feature sets
In order to guarantee comparability to Schiessler et al.10, we abstained from adjusting network architecture and training details in this work. Instead we examined the influence of using “better” feature sets towards improving the predictive quality and ability to generalise of our neural networks. In particular, we investigated whether predictive models that were trained on the original dataset DS60 could be improved if selected features were more suitable for the blind testing data, i.e., when training occurred in combination with FS15 or FS75.
Clearly this approach is not applicable in practice without already having experimental values available for any data we wish to investigate, as those values are already needed during the feature selection process. Therefore the following results should not be seen as claims to the predictive capabilities of our already existing models. We can rather consider them as a lower bar on how well we are able to do given feature sets that really generalise well (recall that we still did not use the blind testing data during training of these neural networks).
We repeated the training process for the neural networks, using DS60 along with the same cross-validation folds as before as our training data, and again aggregating predictions on the blind testing set across all runs afterwards. The only difference was that FS15 and FS75 features were used as input instead. With this approach we hoped to improved predictive quality on the blind testing compounds, as their most relevant properties now played a direct role in adjusting the deep learning weights. Distributions of predictions for the blind testing data generated by FS15 / DS60 and FS75 / DS60 models can be found in Fig. 5. Detailed prediction means are provided in Supplementary Table 2.
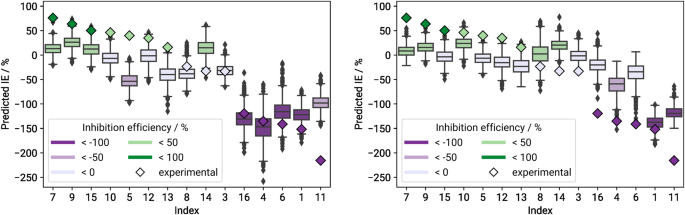
Boxes are coloured according to the compound’s mean predicted IE values in %. Compounds are sorted by descending mean experimental IE values, which are depicted as coloured diamonds.
In fact, in both cases we saw a drastic increase in accuracy with much fewer outliers and reduced RMSE of 52 percentage points (pp) and 62pp for the models using FS15 and FS75 respectively compared to 73pp for the FS60 models, cf. Table 3. Especially in the case of using features devised from only the blind testing data, this RMSE is on par with what was presented in Schiessler et al.10, but without ever seeing these data during the training process.
The hidden downside, however, is that FS15 / DS60 models capture the qualities of the original dataset much more inaccurately. The overall RMSE for predictions on both the blind testing set and validation splits for this case is the highest of all three at 80pp, opposed to 67pp for both the FS60 / DS60 and FS75 / DS60 models.
Scalability
In order to further validate our approach we repeated the training process with cross-validation splits drawn from the combined dataset DS75 (the same that were used to determine FS75). In this setup, there are no more blind testing data as they were incorporated into the combined dataset, thus we only report results aggregated from the respective validation sets per fold. At 64pp, the RMSE of the FS75 / DS75 models is on par with the mean RMSE of 63pp reported in Schiessler et al.10, demonstrating that previous results can be replicated with different training sets and were not a consequence of for example overfitting.
From a machine learning perspective, a 25% increase of the dataset is not huge, and most likely the properties of the original data will still dominate overall results. From an experimental point of view, however, a great amount of time and effort went into performing the required analyses and already slight improvements in predicting the inhibition efficiency of organic compounds go a long way. At any rate we were able to increase the domain of applicability of our predictive models by virtue of the combined dataset, confirming the scalability of our method.
Discussion
In this work we investigated how well the predictive model that performed best in our previous study10 holds up under blind testing. To this end, 15 previously unused compounds were randomly selected using the ExChem Routine21 and their inhibition efficiencies w.r.t. the magnesium alloy ZE41 were experimentally determined using the setup presented by Lamaka et al.24, forming the blind testing dataset DS15.
Feature selection based on RFE suggested that the five features determined via the original dataset DS60 might not be able to generalise very well as there was no overlap between the winning feature sets for DS60 and DS15. However, when regarding both the original and blind testing data in the form of a combined dataset DS75, winning features were a 3:2 mixture from the winners of both individual sets, indicating that the feature selection process is indeed robust and scalable when further information is added. It is notable that the DFT-derived descriptor HOMO came up in the runner-up second best feature set for the original data, and was included in winning sets for both the blind testing and combined dataset compositions, and in general seems to contain important information w.r.t. the inhibition efficiency properties of magnesium dissolution modulators.
Predictive modelling using deep neural networks trained on the original dataset and feature set confirmed that the originally selected descriptors showed only moderate success in correctly identifying the IE of the blind testing compounds. Training the networks on the newly identified feature sets managed to drastically improve the predictive quality even though the blind testing data themselves were only used during the feature selection step but never included in the training process. In summary we conclude that the identified feature sets are not yet able to thoroughly cover large parts of chemical space of potential additive components and need to be updated on a regular basis as more and more experimental data become available. Yet, even when given knowledge only about a very limited amount of data, our method already has a demonstrated predictive power in estimating the inhibition efficiency of magnesium dissolution modulators. Scalability of the method was confirmed via training the neural networks on the combined dataset composition.
In general, the architecture of the neural networks appears to be overparameterised given that we only used a total of five input features for training. This occurred in order to ensure comparability to the original setup presented in our previous study10. We aim to address this in future works using automated neural architecture search such as developed by Schiessler et al.28 which can be helpful in choosing a better suited network topology while limiting the risk of overfitting on the training data. One issue with regression type machine learning is that there is less punishment during the learning process when the model qualitatively mispredicts target values (e.g., a positive target value is predicted to be negative and vice versa). This can be mitigated using classification type models, however, once higher levels of granularity are desired (e.g., for discerning between moderate and strong accelerators or inhibitors), custom loss functions are required that take into account ordered classes.
Another goal for future extensions is to further explore outlier detection using other related approaches such as autoencoders which are restricted to the features used in the machine learning models, as was briefly touched upon in Schiessler et al.10.
Methods
Corrosion experiments
Since the dataset used to train the initial deep neural network in this study was extracted from the work of Lamaka et al.24, the model validation by blind testing was carried out with the same experimental setup and under the same conditions. The inhibition efficiency (IE) of the compounds selected by the ExChem routine was calculated based on hydrogen evolution tests, in which the amount of evolved hydrogen due to the corrosion of magnesium is measured during immersion in a NaCl solution. 0.5 g of ZE41 Mg chips with the surface area of 490 ± 15 cm2 g−1 from the same batch used in Lamaka et al.24 were immersed in 0.5 wt.% NaCl solution without (reference solution) and with the untested compounds, respectively. The chemical composition of the ZE41 chips used for our experiments was identical to the work of Lamaka et al.24 and is provided in Supplementary Table 3. The concentration of compounds was 0.05 M and the pH of solutions was adjusted to 7.0 ± 0.1 by adding NaOH. Compound 3 (3-Hydroxyacetophenone) was used at its saturation, which was measured as 0.03 M. Since compound 1 (2-Amino-2-methyl-1,3-propanediol) has alkaline properties, 0.05 M of this chemical was first dissolved in an HCl solution with a Cl− concentration equivalent to that of a 0.5 % NaCl reference solution. This solution’s pH was then adjusted to 7.0 ± 0.1 with NaOH, similar to the other solutions.
The hydrogen evolution measurements were repeated three times for each solution and the mean of the calculated IEs was used for the corresponding blind test data point. IE is defined as follows
where \({V}_{{{{{\rm{H}}}}}_{2}}^{0}\) and \({V}_{{{{{\rm{H}}}}}_{2}}^{{{{\rm{Inh}}}}}\) are the volumes of H2 evolved after 20 h of immersion in the reference NaCl solution and the NaCl solution containing the investigated chemical compound, respectively. More details on the hydrogen evolution tests are available in the original publication by Lamaka et al.24.
Molecular similarity
We selected suitable blind test candidates by using the ExChem routine21. ExChem exploits molecular similarities to find structurally similar chemical structures in a given database with respect to a selected chemical compound of interest. We calculated the underlying molecular similarities using the Smooth Overlap of Atomic Positions (SOAP) kernel that represents a high-dimensional similarity representation for the considered molecular compounds22,23. For each given compound, a local environment is first defined in a spherical region of radius rc around each atom and then built by a superposition of Gaussian functions with width ξ. The structural information around an atom that flows into the similarity measure is directly dependent on the size of rc. Calculating the translationally and rotationally invariant overlap between two local environments results in the SOAP kernel. The kernel can be further raised to a power ζ for improved discrimination between small or large similarities. Averaging over all local atomic environments enables the calculation of a global similarity measure that contains the molecular similarities between all chemical structures in a given dataset.
Interpretation of the molecular similarities in high-dimensional space was facilitated by projection to a two-dimensional latent space and correlation with experimental data. Distant (dissimilar) or close (similar) structures in the high-dimensional space maintain their relationships in the low-dimensional space. By evaluating the relative positions of compounds with respect to the formation of clusters in the two-dimensional similarity landscape, we can reveal existing structure-property relationships.
Feature generation
First, the geometries of the 15 blind test molecules were optimized using the quantum chemical software package Turbomole 7.4.29 at the TPSSh/def2SVP30,31 level of density functional theory. The optimized structures were subsequently used as input for the cheminformatics software package alvaDesc 1.032 and combined with six properties (HOMO, LUMO, HOMO-LUMO gap (ΔEHL) as well as Cp, Cv, μ calculated at 293 K) that are directly derived from the output of the performed DFT calculations to generate the same pool of 1260 molecular descriptors that have been used in our previous work10.
Feature selection
In Schiessler et al.10, features (i.e. molecular descriptors) were selected using both ANOVA11,12,13,14 and recursive feature elimination (RFE15) with a random forest regressor16,17,18 as the underlying selector, and the corrosion inhibition efficiency as the target variable. RFE is a feature selection method that fits a specified regression (or classification) model given the available training data, and then determines a number of features that least influence the predictive result. These features are excluded from the available pool, and the whole process is repeated until only the desired number or features remain.
Both methods were used to identify the group of top three, five, as well as 63 (i.e. top 5%) features. In all cases, the experiments were performed 100 times with a fixed train-test split of the available dataset, and then the group was determined that got selected most often (i.e., the selection mode). Subsequent predictive models trained on the various feature groups identified the set of five features as determined by RFE to be the most relevant w.r.t. predictions of inhibition efficiency of the available dataset. A full 10-fold cross-validation analysis confirmed both the composition of the top performing group as well as its status as most relevant set of features for predictive modelling.
In this work, we investigated the robustness of previous feature selection results under expansion of the training data. The 15 compounds listed in Table 1 were added to the original dataset used in Schiessler et al.10, resulting in a combined dataset of 75 compounds. The resulting dataset compositions were denoted by DS60, DS15 and DS75, respectively.
Since in Schiessler et al.10 features selected by ANOVA and groups of three features found by RFE produced significantly worse results when used in predictive modelling, and the set of 63 features showed signs of having a high noise-to-signal ratio, we focused our robustness analysis on grouped selection using RFE for groups of five features only.
For each dataset composition, we repeated the steps described in Schiessler et al.10, running RFE 100 times using various random seeds per cross-validation fold, in order to select the grouped top five features per setting. Cross-validating experiments, such as we are doing, means splitting available datasets into n equal parts, called the folds33. The same experiment is then run n times, where a different portion of the data is withheld each time and serves as validation set for this fold. In the end, predictive results on the validation sets are averaged across all folds. This method is especially relevant when working with small datasets, to reduce overfitting and to reduce the influence of potential outliers that may be contained withing the data19,20.
On DS60, the cross-validation folds reported in our previous study10 we re-used. On the other dataset variations, separate folds were drawn. Note that DS15 on its own, consisting only of 15 samples, is too small to expect consistent results under cross-validation. The winning feature sets where the ones that got selected most often per cross-validation fold and random seed. We named these FS60, FS75 and FS15, respectively.
Predictive modelling
As before in Schiessler et al.10, we used deep learning to evaluate the relevance of identified feature sets for predicting inhibition efficiency of magnesium modulators. Since we restricted the feature selection process to sets of five features, only the architecture for what were called ‘small’ networks in Schiessler et al.10 was reused. Our deep learning networks thus consist of the following layers:
-
An input layer accepting inputs from the selected five descriptors
-
A Gaussian noise layer with hyperparameters μ = 0 and σ = 0.1
-
Three fully connected layers with 50, 20, and 10 units, respectively, all using relu activation
-
An output layer with one unit and no activation
The Gaussian noise layer adds some randomness to each input during training, drawn from a normal distribution with mean μ and standard deviation σ, which helps to counter the risk of overfitting on the training data. This layer is only active during the training phase. The networks were trained for 25 epochs using an Adam optimiser with learning rate 0.01, and mean squared error (MSE) as the loss function.
As a preprocessing step, all data that get passed through the networks were scaled using min-max-scaling, with the target variable being scaled into the range [0, 1], and the input variables into the range [ − 1, 1].
We applied the same cross-validation folds that were used during the feature selection process. On each fold and setting, the same architecture was trained 100 times using different random seeds. Detailed software specifications are included in the Supplementary Notes.
For statistical analyses such as calculating the root mean squared error (RMSE) of the models, predictions for each compound were first averaged across all cross-validation folds and random seeds. Note that for the scalability analysis presented in Section Scalability, the blind testing data were included in the cross-validation folds. Analyses in this section were therefore not performed specifically on the blind testing data, but on the validation set results from each cross-validation fold.
Data availability
The data used for this study is available at Zenodo via https://doi.org/10.5281/zenodo.7780743.
Code availability
The code used for this study is available at Zenodo via https://doi.org/10.5281/zenodo.7780743.
References
Feng, Y., Xiong, W., Zhang, J., Wang, R. & Wang, N. Electrochemical discharge performance of the Mg-Al-Pb-Ce-Y alloy as the anode for Mg-air batteries. J. Mater. Chem. A 4, 8658–8668 (2016).
Vaghefinazari, B., Höche, D., Lamaka, S. V., Snihirova, D. & Zheludkevich, M. L. Tailoring the Mg-air primary battery performance using strong complexing agents as electrolyte additives. J. Power Sources 453, 227880 (2020).
Deng, M. et al. High-energy and durable aqueous magnesium batteries: recent advances and perspectives. Energy Stor. Mater. 43, 238–247 (2021).
Erlanson, D. A., Fesik, S. W., Hubbard, R. E., Jahnke, W. & Jhoti, H. Twenty years on: the impact of fragments on drug discovery. Nat. Rev. Drug. Discov. 15, 605–619 (2016).
Fockaert, L. I. et al. ATR-FTIR in Kretschmann configuration integrated with electrochemical cell as in situ interfacial sensitive tool to study corrosion inhibitors for magnesium substrates. Electrochim. Acta 345, 136166 (2020).
Wang, Y. et al. High-throughput calculations combining machine learning to investigate the corrosion properties of binary Mg alloys. J. Magnesium Alloys https://doi.org/10.1016/j.jma.2021.12.007 (2022).
Lu, Z. et al. Prediction of Mg alloy corrosion based on machine learning models. Adv. Mater. Sci. Eng. 2022, 9597155 (2022).
Hughes, A. E. et al. Corrosion inhibition, inhibitor environments, and the role of machine learning. Corros. Mater. Degrad. 3, 672–693 (2022).
Sutojo, T. et al. A machine learning approach for corrosion small datasets. npj Mater. Degrad. 7, 18 (2023).
Schiessler, E. J. et al. Predicting the inhibition efficiencies of magnesium dissolution modulators using sparse machine learning models. npj Comput. Mater. 7, 193 (2021).
Johnson, K. J. & Synovec, R. E. Pattern recognition of jet fuels: comprehensive GC × GC with ANOVA-based feature selection and principal component analysis. Chemometr. Intell. Lab. Syst. 60, 225–237 (2002).
Kim, T. K. Understanding one-way ANOVA using conceptual figures. Korean J. Anesthesiol. 70, 22–26 (2017).
Burgard, D. R. Chemometrics: Chemical and Sensory Data (CRC Press, 2018).
van der Vaart, A., Jonker, M. & Bijma, F. An Introduction to Mathematical Statistics (Amsterdam University Press, 2017).
Guyon, I., Weston, J., Barnhill, S. & Vapnik, V. Gene selection for cancer classification using support vector machines. Mach. Learn. 46, 389–422 (2002).
Ho, T. K. Random decision forests. In Proceedings of 3rd International Conference on Document Analysis and Recognition Vol. 1, 278–282 (IEEE, 1995).
Genuer, R., Poggi, J.-M. & Tuleau-Malot, C. Variable selection using random forests. Pattern Recognit. Lett. 31, 2225–2236 (2010).
Chavent, M., Genuer, R. & Saracco, J. Combining clustering of variables and feature selection using random forests. Commun. Stat. B: Simul. Comput. 50, 426–445 (2021).
Arlot, S. & Celisse, A. A survey of cross-validation procedures for model selection. Stat. Surv. 4, 40–79 (2010).
Cawley, G. C. & Talbot, N. L. C. On over-fitting in model selection and subsequent selection bias in performance evaluation. J. Mach. Learn. Res. 11, 2079–2107 (2010).
Würger, T. et al. Exploring structure-property relationships in magnesium dissolution modulators. npj Mater. Degrad. 5, 2 (2021).
Bartók, A. P., Kondor, R. & Csányi, G. On representing chemical environments. Phys. Rev. B 87, 184115 (2013).
De, S., Bartók, A. P., Csányi, G. & Ceriotti, M. Comparing molecules and solids across structural and alchemical space. Phys. Chem. Chem. Phys. 18, 13754–13769 (2016).
Lamaka, S. V. et al. Comprehensive screening of Mg corrosion inhibitors. Corros. Sci. 128, 224–240 (2017).
Kokalj, A. et al. Simplistic correlations between molecular electronic properties and inhibition efficiencies: do they really exist? Corros. Sci. 179, 108856 (2021).
Feiler, C. et al. In silico screening of modulators of magnesium dissolution. Corros. Sci. 163, 108245 (2020).
Géron, A. Hands-On Machine Learning with Scikit-Learn, Keras and TensorFlow (O’Reilly Media, Inc., 2019).
Schiessler, E. J., Aydin, R. C., Linka, K. & Cyron, C. J. Neural network surgery: combining training with topology optimization. Neural Netw. 144, 384–393 (2021).
Turbomole. V7.4. A Development of University of Karlsruhe and Forschungszentrum Karlsruhe GmbH, 1989–2019 Since 2007. https://www.scirp.org/(S(i43dyn45teexjx455qlt3d2q))/reference/ReferencesPapers.aspx?ReferenceID=768588 (2019).
Staroverov, V. N., Scuseria, G. E., Tao, J. & Perdew, J. P. Comparative assessment of a new nonempirical density functional: molecules and hydrogen-bonded complexes. J. Chem. Phys. 119, 12129–12137 (2003).
Eichkorn, K., Weigend, F., Treutler, O. & Ahlrichs, R. Auxiliary basis sets for main row atoms and transition metals and their use to approximate Coulomb potentials. Theor. Chem. Acc. 97, 119–124 (1997).
Mauri, A. alvaDesc: A tool to calculate and analyze molecular descriptors and fingerprints. Methods Pharmacol. Toxicol. 64, 801–820 (2020).
Stone, M. Cross-validatory choice and assessment of statistical predictions. J. R. Stat. Soc., B: Stat. 36, 111–147 (1974).
Acknowledgements
Funding by the Helmholtz Association is gratefully acknowledged. TW, BV, SL and CF gratefully acknowledge financial support from the Helmholtz Artificial Intelligence Cooperation Unit via the AI2 project (Projektnummer ZT-I-PF-5-102). The authors thank Thermo Fisher Scientific for providing a chemical database that was used to select additional compounds for model validation using the previously developed ExChem approach.
Funding
Open Access funding enabled and organized by Projekt DEAL.
Author information
Authors and Affiliations
Contributions
E.J.S., T.W., B.V., S.V.L., R.H.M., C.J.C., M.L.Z., C.F. and R.C.A. contributed to the conception and design of the study. C.F. and T.W. generated the molecular descriptor database and selected the compounds for experimental validation of the model. B.V. and S.V.L. conducted the validation experiments. E.J.S. did the theoretical analyses and wrote the supporting code. E.J.S., T.W., R.C.A and C.F. evaluated the quality of the presented models. E.J.S. and T.W. created the figures. E.J.S., T.W., C.F. and R.C.A. wrote the first draft of the manuscript. All authors contributed to the manuscript revision, read, and approved the submitted version.
Corresponding authors
Ethics declarations
Competing interests
The authors declare no competing interest.
Additional information
Publisher’s note Springer Nature remains neutral with regard to jurisdictional claims in published maps and institutional affiliations.
Supplementary information
Rights and permissions
Open Access This article is licensed under a Creative Commons Attribution 4.0 International License, which permits use, sharing, adaptation, distribution and reproduction in any medium or format, as long as you give appropriate credit to the original author(s) and the source, provide a link to the Creative Commons license, and indicate if changes were made. The images or other third party material in this article are included in the article’s Creative Commons license, unless indicated otherwise in a credit line to the material. If material is not included in the article’s Creative Commons license and your intended use is not permitted by statutory regulation or exceeds the permitted use, you will need to obtain permission directly from the copyright holder. To view a copy of this license, visit http://creativecommons.org/licenses/by/4.0/.
About this article

Cite this article
Schiessler, E.J., Würger, T., Vaghefinazari, B. et al. Searching the chemical space for effective magnesium dissolution modulators: a deep learning approach using sparse features. npj Mater Degrad 7, 74 (2023). https://doi.org/10.1038/s41529-023-00391-0
Received:
Accepted:
Published:
DOI: https://doi.org/10.1038/s41529-023-00391-0
