
Abstract
Photosynthesis-related pathways are regarded as a promising avenue for crop improvement. Whilst empirical studies have shown that photosynthetic efficiency is higher in microalgae than in C3 or C4 crops, the underlying reasons remain unclear. Using a tailor-made microfluidics labelling system to supply 13CO2 at steady state, we investigated in vivo labelling kinetics in intermediates of the Calvin Benson cycle and sugar, starch, organic acid and amino acid synthesis pathways, and in protein and lipids, in Chlamydomonas reinhardtii, Chlorella sorokiniana and Chlorella ohadii, which is the fastest growing green alga on record. We estimated flux patterns in these algae and compared them with published and new data from C3 and C4 plants. Our analyses identify distinct flux patterns supporting faster growth in photosynthetic cells, with some of the algae exhibiting faster ribulose 1,5-bisphosphate regeneration and increased fluxes through the lower glycolysis and anaplerotic pathways towards the tricarboxylic acid cycle, amino acid synthesis and lipid synthesis than in higher plants.
Main
An increase in agricultural yield of 70% or more is required by 2050 to meet the growing demand of the world population1,2. Modern agriculture has witnessed an ~160% increase in global production since the 1950s. This gain was achieved without expanding cropland, by extensive use of fertilizer and plant protection agents as well as improved crop varieties. Future gains face the challenges of shrinking farmland area, an increasingly unpredictable climate and the environmental imperative to use less fertilizer and agrochemicals, and will require new breeding strategies. Most breeding efforts during the Green Revolution addressed pathogen resistance and brought plant architecture and the harvest index close to their theoretical upper limit3,4. Indeed, yield is stagnating in most major crops5,6,7,8.
Photosynthesis is a promising target to increase yield. Photosynthesis is relatively conserved among crops and its efficiency is well below the theoretical maxima9,10,11. The theoretical limit, defined as the fraction of light energy that is captured in conversion of CO2 and water to glucose, is ~12% (ref. 3). Measured efficiencies reach ~3.5% and ~4.3% for C3 and C4 plants, respectively, and 5–7% for microalgae, emphasizing the potential of microalgae as a resource for yield improvement12. Many factors reduce photosynthetic efficiency, including photochemical limitations and the bifunctionality of ribulose-1,5-bisphosphate carboxylase-oxygenase (RuBisCO). In addition to carboxylation13, RuBisCO catalyses a side-reaction with O2 that leads to formation of 2-phosphoglycolic acid (2PG), which is recycled via glycine, serine and glycerate to regenerate 3-phosphoglyceric acid (3PGA), with concomitant loss of CO2 and ammonium14. Several mechanisms have evolved to increase CO2 concentration around RuBisCO and decrease the rates of the side-reaction with O2. Microalgae pump bicarbonate allowing them to accumulate CO2 in microstructures called pyrenoids in which RuBisCO is located15,16. C4 plants possess a biochemical pump in which bicarbonate is combined with phosphoenolpyruvate (PEP) in externally located mesophyll cells to form four-carbon metabolites that move into the bundle sheath cells and are decarboxylated to generate a high concentration of CO2 around RuBisCO17,18.
A key question is whether optimizing photosynthetic efficiency will result in higher productivity. Earlier studies with panels of crop genotypes did not find a clear relationship between leaf photosynthetic rate and yield19. However, the importance of photosynthesis for yield is underlined by consistent increases in yield in free air elevated [CO2] experiments9, by the increased yield of transgenic plants that overexpress various carbon (C) assimilation enzymes11 and by the finding that enclosed outdoor photobioreactor designs that allow faster photosynthesis often increase algal productivity20. Existing efforts to redesign photosynthesis focus on improving light harvesting, light energy conversion and C uptake and conversion, including suppression of photorespiration4. Despite its potential impact, little work has addressed photosynthesis-associated metabolism and downstream reactions (often-termed photosynthate investment) as a route to improve yield.
Exploring biodiversity in algae, especially algae from extreme environments, offers means to improve photosynthesis21,22. Unique capabilities are more likely to be found in organisms that cope with severe conditions. The green alga Chlorella ohadii was recently isolated from a desert biological soil crust, one of the harshest environments on Earth23. It exhibits unparalleled resistance to extreme illumination levels (EIL, 3,000 µmol photons m–2 s–1), high photosynthetic rates24,25 and the fastest growth rate ever reported for a photosynthetic organism26. C. ohadii may provide us with essential information on the photosynthetic machinery and what limits plant performance26,27. Physiological and ‘omics studies have uncovered several factors that contribute to its extraordinary resilience under EIL, including a remarkably robust photosystem II, rapid poising of redox status, rapid post-translational redox regulation of protein kinases and reactive oxygen stress (ROS) and heat-shock (HS) responses and thylakoid remodelling27.
The key phenotype emerging from changes in gene expression and protein regulation is pathway flux28. Due to the complex relationship between protein activity and substrate level, protein and metabolite levels do not provide reliable information about flux. Flux in photosynthesis can be investigated by performing 13CO2 pulse labelling and analysing the temporal labelling kinetics of metabolic intermediates using chromatography linked to mass spectrometry28,29,30,31,32,33,34,35,36,37,38. Here, we monitor the 13C-labelling kinetics of >40 intermediates in the Calvin Benson cycle (CBC), photorespiration and central C and nitrogen (N) metabolism, as well as starch, protein and lipids in C. ohadii and, for comparison, C. sorokiniana and Chlamydomonas reinhardtii (two green eukaryotic algae with lower growth rates). The experiments were designed to address two questions: first, are there changes in flux patterns between algal species that could explain the fast growth of C. ohadii? Second, do flux patterns in algae differ from those in higher plants? For the latter, we compared labelling kinetics in algae with published and new data from Arabidopsis thaliana and Zea mays (maize) as model plants for C3 and C4 photosynthesis, respectively.
Results
Seconds-level photosynthetic 13C-labelling kinetics in algal cells
Since many intermediates in photosynthetic metabolism have turnover times of a few seconds or less, we developed a pipeline built around a microfluidic system that allows precise short pulses and rapid quenching in ambient conditions (Fig. 1, Extended Data Fig. 1 and Supplementary text). To visualize inter- and intra-algal differences we performed k-means clustering (k = 4, GAP statistics; Supplementary Fig. 1a) on the enrichment kinetics of the 20 analysed intermediates (Extended Data Fig. 2 and Supplementary Tables 1 and 2a). Cluster 1 (mainly CBC intermediates) labelled most rapidly, cluster 2 (intermediates in pathways directly connected to the CBC, like photorespiration and starch and sucrose biosynthesis) and cluster 3 labelled more slowly and there was little labelling of cluster 4 (Extended Data Fig. 2). CBC intermediates showed a near-linear increase in enrichment in all algae and treatments, demonstrating that the microfluidic mixer allows essentially lag-free introduction of 13C-labelled inorganic carbon (Ci: CO2, HCO3–, CO32–, H2CO3). Enrichment in cluster 1 rose faster in C. ohadii than in C. sorokiniana (paired t-test for enrichment slopes, P = 0.000091) or C. reinhardtii (P = 0.0032) and faster in C. ohadii under EIL than under low light (LL, 100 µmol photons m–2 s–1) (P = 0.0299). Differing enrichment kinetics might reflect different fluxes and/or pool sizes. Most CBC intermediates and PEP had larger pool sizes in the Chlorella species than in C. reinhardtii, (Supplementary Table 3) showing that the rapid labelling kinetics in Chlorella result from higher flux. This is also in qualitative agreement with the rates of oxygen evolution in these cultures (Supplementary Fig. 1).

a, An experimental setup to provide precise short pulses to algal cultures differing in their growth rate on the basis of microfluidic mixer and instantaneous quenching (see Extended Data Fig. 1 for details). b, An analytical setup to measure levels and labelling kinetics of intermediates in the CBC and the early steps of the end-product synthesis pathways. c, Inspection of labelling temporal kinetics to identify differential flux patterns between algal species.
The clusters were visualized by multidimensional scaling (MDS; the spread of the different clusters across the corresponding two-dimensional space reflects different parameters of the enrichment–time curves; for example, slope and levels) (Fig. 2). Metabolites in clusters 1 and 2 showed wider spread in C. ohadii than in C. sorokiniana and C. reinhardtii; for example, sedoheptulose-1,7-bisphosphate (SBP), sedoheptulose-7-phosphate (S7P) and (in EIL) dihydroxyacetone phosphate (DHAP) separated further from other CBC intermediates in C. ohadii than in the other two algae. Glucose-1-phosphate (G1P) showed similar labelling to CBC intermediates in C. ohadii but clustered with further intermediates of starch and sucrose synthesis in the other two algae. PEP grouped with CBC intermediates (cluster 1) in both Chlorella species but not in C. reinhardtii.
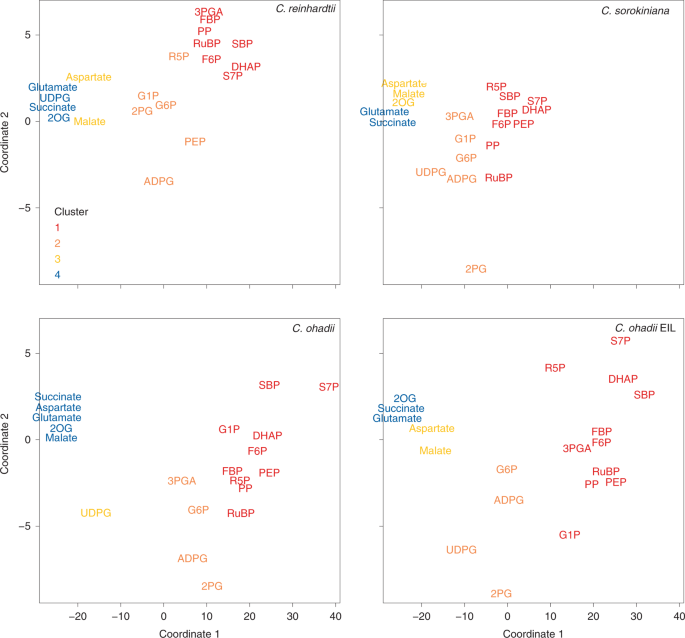
Metabolites analysed by LC–MS/MS of all algae and treatments were analysed together and then projected on the same coordinates and separated into different panels for clarity of visualization. Colour-coded k-means clustering of the data was performed separately for each alga and treatment (Supplementary Table 2a and Extended Data Fig. 2): red, orange, yellow and blue, denote intermediates in clusters 1, 2, 3 and 4, respectively, which showed an increasingly slow rise in enrichment.
Comparison of labelling kinetics between algae and plants was made possible thanks to the experimental design that guaranteed immediate and equivalent enrichment of all Ci species (Methods). Enrichment of several CBC intermediates rose faster in algae than in Arabidopsis (3PGA, DHAP, fructose-1,6-bisphosphate (FBP), SBP, ribulose 1,5-bisphosphate (RuBP); Supplementary Tables 1 and 4; data from ref. 31 or measured here) and faster in C. ohadii than in maize (DHAP, FBP, SBP, ribose-5-phosphate (R5P); Supplementary Tables 1 and 4; extracted from ref. 32).
To facilitate interspecies comparison, we regressed the enrichment of each intermediate against enrichment of DHAP and computed the correlation coefficient and slope (Supplementary Fig. 3, summarized in Supplementary Table 4). This reveals the extent to which each intermediate is in isotopic equilibrium with DHAP. We chose DHAP rather than 3PGA, which is the first CO2 fixation product and immediately upstream from DHAP, because in algal samples 3PGA consistently exhibited lower apparent enrichment than did DHAP (Supplementary Table 1); this may be due to subcompartmentation and/or errors in 3PGA isotopomer quantification due to slight peak spreading. The correlation coefficients of DHAP to other CBC intermediates in algae were very high (>0.95) for all CBC intermediates tested (Supplementary Fig. 2; see Supplementary Table 4 for slopes of the regressions). Under LL, slopes for fructose-6-phosphate (F6P), SBP, S7P, R5P and RuBP were higher in C. ohadii (0.97, 0.97, 1.19, 0.93 and 0.97, respectively) than in C. sorokiniana (0.77, 0.82, 1.03, 0.70 and 0.84) or in C. reinhardtii (0.72, 0.94, 0.94, 0.81 and 0.70). In C. ohadii under EIL, all slopes were essentially identical to DHAP (0.96, 1.11, 1.29, 0.97, 1.03 for F6P, SBP, S7P, R5P and RuBP, respectively) pointing to especially rapid CBC flux in these conditions.
In Arabidopsis and maize, the slopes on DHAP for CBC metabolites were similar (FBP in maize but not Arabidopsis, SBP, S7P, pentose-phosphates (PP: xylulose-5-phosphate (Xu5P) and ribulose-5-phosphate (Ru5P)), RuBP) or slightly lower (R5P and F6P) than in algae (Supplementary Table 4; calculated from refs. 31,32 and Extended Data Fig. 2). This points to similar labelling patterns of CBC metabolites in algae and plant leaves. The higher enrichment of S7P compared to other CBC intermediates found in C. ohadii (Fig. 2 and Extended Data Fig. 2) has also been seen in leaves of Arabidopsis, maize (Supplementary Tables 1 and 4) and, recently, Camelina sativa39. The slower rise of F6P and PP might be due to compartmentation, either between the chloroplast and cytosol of photosynthetic cells and/or between photosynthetic and non-photosynthetic cells (below and Supplementary text).
Enrichment in intermediates of starch and sucrose synthesis (mainly cluster 2) rose slightly more slowly than for CBC intermediates (Extended Data Fig. 2). Labelling of starch and sucrose precursor intermediates was fastest in C. ohadii in EIL, followed by C. ohadii in LL, and C. sorokiniana and was slowest in C. reinhardtii. Enrichment in glucose-6-phosphate (G6P) rose more slowly than F6P, probably reflecting slow labelling of cytoplasmic pools as described in higher plants (Supplementary text).
Microalgae possess a CO2-concentrating mechanism (CCM) which decreases the side-reaction of RuBisCO with O2 that leads to formation of 2PG (Main text); 2PG was nevertheless rapidly labelled in algae (Extended Data Fig. 2; cluster 2). The slope of the regression on DHAP was higher in the Chlorella species (0.78–0.90) than in C. reinhardtii (0.48), resembled Arabidopsis (0.76) and was higher than maize (0.40) (Supplementary Table 4). Levels of 2PG were significantly lower in C. ohadii and C reinhardtii than in C. sorokiniana in LL and significantly higher in C. ohadii in EIL than in LL (Supplementary Fig. 3). Levels of 2PG per unit dry weight (DW) in algae under LL were 10–25 times lower than in Arabidopsis and 2.5–5 times lower than in maize (Supplementary Fig. 4; estimated from this study for Arabidopsis and from ref. 32 for maize, assuming 90–92% water content40). The 2PG levels in C. ohadii under EIL resembled those in maize.
Enrichment in PEP was identical to that of early CBC intermediates in C. ohadii (slope of the regression on DHAP = 1.042 and 1.06 under LL and EIL, respectively; Fig. 2 and Supplementary Fig. 3). This underlies the close location of PEP and RuBP in the MDS analysis of the C. ohadii dataset (Fig. 2). The slope of the regression of PEP on DHAP was slightly lower in C. sorokiniana (0.91) and much lower in C. reinhardtii (0.79), Arabidopsis (0.76) and, especially, the C4 species maize (0.25) (Supplementary Fig. 3 and Supplementary Table 4). Slower labelling of PEP in Arabidopsis might, in principle, be due to a large pool of unlabelled or slowly labelling PEP in non-photosynthetic cells. It is, however, unlikely that such cells contain a large pool of PEP but not of other glycolytic intermediates (Supplementary text). Furthermore, many other features of our study point to rapid flux from the CBC to PEP in algae (below). In maize, flux to PEP is dominated by pyruvate returning from the bundle sheath cells, where decarboxylation of malate and aspartate occurs. Crucially, the C1–3 positions of malate, aspartate and metabolites deriving from them, like pyruvate, are initially unlabelled. Flow of 13C from the CBC into PEP is therefore diluted by a massive influx of unlabelled C from the carbon concentrating shuttle32 (Supplementary text).
Enrichment in malate rose much more slowly than in CBC intermediates (Fig. 2 and Extended Data Fig. 2). Enrichment rose faster in C. reinhardtii under LL and C. ohadii under EIL than in C. ohadii and C. sorokiniana under LL (slope of regression on DHAP = 0.186, 0.123, 0.030 and 0.048, respectively). Aspartate followed a similar pattern (0.143, 0.078, 0.036 and 0.044, respectively). The faster rise in enrichment in C. reinhardtii might be attributed to 5–25 smaller pool sizes than in the Chlorella species (Supplementary Table 3). Comparison with the slopes in Arabidopsis (malate 0.002–0.02, aspartate 0.02) and maize (malate 0.23, aspartate 0.76) revealed that labelling of malate in algae was faster than in C3 photosynthesis but slower than in C4 photosynthesis21 (Supplementary Table 4). Similar conclusions were reached by comparing 13C enrichment at 40 s (Supplementary Table 1).
The label in malate and aspartate at 0–40 s in algae probably reflects flux from rapidly labelled PEP. The dominant labelled isotopomer for malate and aspartate in all algae and conditions was m + 1 (mass), as expected because PEP carboxylase (PEPC) adds H13CO3− to PEP. However, the m + 2 isotopomer of aspartate and malate appeared by 40 s, in parallel with m + 1 becoming the dominant isotopomer of PEP (Supplementary Fig. 5). PEP may be rapidly converted to downstream metabolites that were not detected by reverse phase liquid chromatography linked to tandem mass spectrometry (LC–MS/MS) or that accumulated such small amounts of 13C that they could not be reliably investigated. These observations prompted us to investigate labelling kinetics over longer time scales.
Long-term labelling of metabolites in different algae
For longer labelling (minutes to hours), we used direct bubbling of running cultures. The main aim was to investigate flux into major products. We first analysed sugars, organic and amino acids using gas chromatography linked to mass spectrometry (GC–MS)41.
We again performed k-means clustering based on Euclidian distance (k = 4, GAP statistics; Supplementary Fig. 1b). Whereas near-linear labelling kinetics between 0 and 40 s facilitated direct comparison of 13C flow (above; Fig. 2, Extended Data Fig. 2 and Supplementary Table 1), labelling kinetics were more complex at 15–300 min (Extended Data Fig. 3 and Supplementary Table 2b). They are summarized in the MDS representation (Fig. 3). Cluster 1 was characterized by a quite rapid rise in enrichment, which in most cases plateaued by 60 min or earlier. Clusters 2, 3 and 4 showed progressively slower and less complete labelling (Extended Data Fig. 3). Enrichment in cluster 1 plateaued at 40–60% in C. reinhardtii, 50–60% in C. sorokiniana, 50–70% in C. ohadii under LL and 65–75% in C. ohadii under EIL (Extended Data Fig. 3). Higher enrichment in C. ohadii compared with the other algae indicates that a larger fraction of its total metabolite pool is involved in photosynthetic metabolism, especially in EIL. This is probably linked to the higher photosynthesis rate but may also be affected by compartmentation (Supplementary Fig. 2). In the MDS representation, cluster 4 intermediates in C. ohadii at EIL shifted towards the position taken by cluster 3 intermediates in all algae in LL (Fig. 3), indicative of higher fluxes. In C. reinhardtii, some metabolites, including glucose, mannose, succinate and glutamate, shifted to the position occupied by cluster 1 metabolites in the Chlorella species in LL (Fig. 3). This may partly reflect smaller pool sizes in C. reinhardtii (Supplementary Table 3).

Metabolites analysed by GC–MS of all algae and treatments were analysed together and then projected on the same coordinates and separated into different panels for clarity of visualization. Colour-coded k-means clustering of the data was performed separately for each alga and treatment (Supplementary Table 2b and Extended Data Fig. 3): red, orange, yellow and blue, denote intermediates in clusters 1, 2, 3 and 4, respectively, which showed an increasingly slow rise in enrichment.
Cluster 1 included malate, aspartate, the photorespiratory intermediates glycine (with the exception of C. reinhardtii and C. ohadii under EIL) and serine and several tricarboxylic acid (TCA) cycle intermediates (Fig. 3 and Extended Data Fig. 3). In line with seconds-level 13C enrichment patterns, the rise in enrichment of malate during the first 60 min resembled that in maize and was considerably faster than in Arabidopsis (Supplementary Table 5). Enrichment in aspartate rose more slowly than maize but faster than Arabidopsis (except for C. sorokiniana). Enrichment of citrate, fumarate and succinate rose early (clusters 1 and 2) in all algae (Fig. 3 and Extended Data Fig. 3). Succinate and fumarate rose faster than in Arabidopsis or maize (Supplementary Table 5; citrate data are not available for Arabidopsis or maize). These TCA intermediates were mostly in clusters 1 and 2 and were localized quite close to malate and aspartate in the MDS analysis. Intermediate 2-oxoglutarate (2OG) was not reliably detected in our analyses but probably had a similar pattern because enrichment rose rapidly in glutamate in all algae (clusters 1 or 2; Fig. 3, Extended Data Fig. 3 and Supplementary Table 5). These results point to rapid flux via PEPC towards an anabolism-directed TCA cycle, rather than towards malate decarboxylation to deliver CO2 to RuBisCO, as is the case in C4 photosynthesis.
Enrichment of glycerol 3-phosphate (Gly3P) rose faster in C. reinhardtii (cluster 2) than in the Chlorella species under LL (cluster 4) possibly due to the smaller pool in C. reinhardtii. Gly3P was among the most abundant metabolites in these algae (Supplementary Table 3; similar was previously reported for C. reinhardtii42) with one to two orders higher levels than previously reported in Arabidopsis (Table 1, extracted from ref. 43).
Enrichment in sucrose rose much faster in the Chlorella species (cluster 3) than in C. reinhardtii (cluster 4) under LL and rose even faster in C. ohadii under EIL (cluster 2; Extended Data Fig. 3 and Supplementary Table 5). The sucrose pool was two orders of magnitude smaller in C. reinhardtii than in the Chlorella species (Supplementary Table 3). Accordingly, movement of 13C into sucrose was negligible in C. reinhardtii (Extended Data Fig. 3, Table 2 and Supplementary Table 5). With the exception of C. ohadii under EIL, enrichment in sucrose rose more slowly in algae than in Arabidopsis or maize (Supplementary Table 5).
Galactose was the predominant reducing sugar in terms of pool size in all three algae (Supplementary Table 3). Labelling of galactose (Fig. 3, Extended Data Fig. 3 and Supplementary Table 5) was slow (cluster 4) in all algae, except for C. ohadii under EIL which exhibited both faster labelling (cluster 3) and a larger pool (Supplementary Table 3) than under LL. As no data for galactose levels are available from refs. 31,32, it was measured in new samples; galactose was 1.4–6-fold lower in Arabidopsis than in algae (Table 1 and Supplementary Table 3).
Enrichment in glucose and fructose rose faster in algae than in higher plants, also relative to sucrose (Supplementary Table 5). In all algae, the labelling kinetics and isotopomer pattern of glucose resembled that of maltose (Extended Data Fig. 3, Supplementary Fig. 6 and Supplementary Table 2b). Maltose is a product of starch degradation. The rise in enrichment in glucose and maltose slowed down or plateaued from about 60–120 min on (Extended Data Fig. 3), with 30–60% of the maltose pool still being the unlabelled isotopomer (Supplementary Fig. 6). These results pointed to a large flux from starch through maltose to glucose. We therefore explored labelling of starch.
Rates of starch synthesis and degradation
Starch is often a major C reserve in chlorophyte algae44,45. In plants, foliar starch is often a major C reserve, which is accumulated in the light and degraded in the dark to provide sugars for growth and metabolism at night40,46,47. 13C enrichment in starch rose more slowly in C. ohadii than in C. reinhardtii and C. sorokiniana under LL or C. ohadii under EIL (Extended Data Fig. 4a). Starch content per unit DW was highest in C. ohadii under LL and about twofold, eightfold and twofold lower in C. sorokiniana and C. reinhardtii under LL and C. ohadii under EIL (P = 7.37 × 10⁻⁷, 1.14 × 10⁻⁸ and 1.41 × 10⁻⁷, respectively; Extended Data Fig. 4c). 13C accumulated in starch at similar rates in C. sorokiniana under LL, C. ohadii under LL and C. ohadii under EIL and three times more slowly in C. reinhardtii under LL (Extended Data Fig. 4b and Table 2; P = 4.07 × 10⁻⁵).
In all algae, 13C accumulation was accompanied by a significant decrease in the amount of 12C in starch (Extended Data Fig. 4c,d). The labelling kinetics of maltose and glucose (above) are consistent with maltose and glucose deriving in part from degradation of newly synthesized starch and partly from degradation of preformed and hence unlabelled starch. The latter may provide a 12C source that prevents full enrichment of other metabolites (Supplementary text).
Rates of protein synthesis
We next examined 13C accumulation in protein, which in a growing single-celled alga can be considered an end-product of photosynthesis. Protein content per unit DW was 46% and 36% lower in C. sorokiniana and C. ohadii than in C. reinhardtii (P = 2.18 × 10⁻⁵ and 6.15 × 10⁻⁷, respectively; Extended Data Fig. 5a). Protein synthesis rates (PSR, percentage of protein synthesized per h; see Methods for how this was measured and calculated) in C. sorokiniana and C. ohadii were 2.0- to 5.1-fold higher than in C. reinhardtii (4.7–5.6% h−1 and 3.8–4.7% h−1, compared to 1.1–1.9% h−1). PSR correlated positively with growth rate across the three algae in LL (R2 > 0.86, Extended Data Fig. 5b). PSR in C. ohadii under EIL was 1.5–1.7-fold higher than under LL (Supplementary Table 6), slightly above the 1.4-fold higher growth rate. PSRs in the Chlorella species were 2.3- to 3.9-fold higher than in Arabidopsis (data not available for maize).
Qualitative estimation of lipid synthesis
Lipids represent a major C sink in algae48, which have a much higher lipid content than plant leaves (Table 1). We took two approaches to estimate flux to lipids. The first was a bulk index for lipid synthesis per DW on the basis of biomass fraction of lipid (Table 1) and growth rate (Supplementary Fig. 7). This indicated higher rates of lipid synthesis in the Chlorella species than in C. reinhardtii under LL and threefold to ninefold higher rates in C. ohadii under EIL than under LL (Extended Data Fig. 6). In Arabidopsis leaves, a similar approach (supported by lipid 14C-labelling experiments; refs. 49,50,51) gave estimates eightfold to 100-fold lower than algae (Extended Data Fig. 6). To provide qualitative support, the lipid fraction of 13CO2-labelled samples was analysed by LC–MS. This revealed substantial labelling of membrane lipids and triacylglycerol (TAG) in C. reinhardtii, C. sorokiniana and C. ohadii under LL and even faster labelling in C. ohadii under EIL (Extended Data Fig. 6).
Comparison of estimated fluxes to end-products
Tables 1 and 2 summarize the estimated contents and fluxes to sucrose, glucose, galactose, Gly3P, starch and protein for the three algae in LL and C. ohadii in EIL, as well as values for Arabidopsis estimated from published and new data. Compared to Arabidopsis, algae contain less sucrose, similar contents of starch and protein and higher galactose and Gly3P.
Flux to sucrose was undetectable in C. reinhardtii, substantial in C. sorokiniana and highest in C. ohadii where it was in the same range as Arabidopsis (Table 2). The estimated flux in Arabidopsis may be an underestimate due to 13C sucrose export and utilization for growth. Except in C. reinhardtii, flux to glucose was lower than flux to sucrose. Flux to galactose exceeded flux to glucose in all three algae but was lower than flux to sucrose in the Chlorella species (Table 2). In these continuous illumination conditions, the rate of starch degradation approaches that of starch synthesis in algae (Table 2), resulting in slower net starch accumulation than in Arabidopsis (except for C. ohadii in LL). Importantly, both flux to starch and combined flux to sugars were lower than flux to protein in algae, whereas both were higher than flux to protein in Arabidopsis.
The initial rate of accumulation of 13C in malate and aspartate was used to estimate a minimum flux at PEPC (this is an underestimate due to rapid movement of 13C through into other organic acids and amino acids, as well as lipids; below). In algae, minimum estimated flux at PEPC was of the same order as estimated flux to sucrose or starch (Table 2), whereas in Arabidopsis it was much lower than flux to sucrose or starch. C. ohadii in EIL appears to be an exception but our estimate may be a large underestimate because a considerable amount of 13C has probably moved beyond malate and aspartate. For example, minimum estimates of flux to organic and amino acids quantified by gas chromatography linked to mass spectrometry (GC–MS) (including pyruvate, citrate, glutamate, proline and glycine) were 9.8 ± 0.8 and 32.5 ± 3 nmol C eq. g−1 DW s−1 in C. ohadii under LL and EIL, respectively (see Methods for calculation). These rates alone (to which fluxes to lipids and protein should be added) point to flux at PEPC being higher than flux to sucrose or starch in C. ohadii in EIL.
We also used isotopically non-stationary metabolic flux analysis (INST-MFA) to estimate intracellular fluxes (Fig. 4 and Supplementary text). CO2 uptake rates were much higher for C. ohadii, followed by C. sorokiniana and C. reinhardtii, resulting in higher CBC flux and higher fluxes to starch and sucrose in the Chlorella species and even higher flux through the CBC and faster export of 3PGA to the cytosol in C. ohadii compared with C. sorokiniana (Fig. 4a and Supplementary Table 9, net fluxes). C. reinhardtii had negligible flux through hexose-P in the cytosol (Fig. 4b). C fixation (Vc/Vo) was most efficient in C. ohadii, followed closely by C. reinhardtii, with the lowest efficiency in C. sorokiniana (Fig. 4b).

a, Map of net fluxes estimated by 13C INST-MFA. Bar plots next to each reaction show the absolute fluxes in mmol g−1 DW h−1 estimated under LL for C. reinhardtii (r), C. sorokiniana (s) and C. ohadii (o). Note that fluxes are shown on a log scale. Enzyme abbreviations follow reaction names detailed in Supplementary Table 9. Dashed arrows indicate pathways included in the model, where the full path is not shown. b, Comparison of estimated flux ratios. Rubisco oxygenation (Vo) to carboxylation (Vc) and sucrose to starch ratio. Pyr, pyruvate; OAA, oxaloacetic acid; GA, glyceric acid; E4P, erythrose 4-phosphate; X5P, xylulose 5-phosphate; TP, triose phosphate; PRK, phosphoribulokinase; PPI, pentose phosphate isomerase; TK2, transketolase 2; SBPase, sedoheptulose-bisphosphatase; ALD, aldolase; TK3, transketolase 3; SS, starch synthase; PGI, phosphoglucoisomerase; PFP, fructose-6-phosphate 1-phosphotransferase; FBA, fructose-1,6-bisphosphate aldolase; PPE, phosphopentose epimerase; GAPDH, glyceraldehyde 3-phosphate dehydrogenase; SPS, sucrose phosphate synthase; GK, glycerate kinase; PGAM, phosphoglycerate mutase; PK, pyruvate kinase; PPC, PEP carboxylase.
Comparison of rates of O2 evolution and 13C incorporation
Using initial rates of 13C incorporation in detected metabolites we estimated minimum C assimilation rates in the algae (Table 2). These were lower than the measured rates of oxygen evolution (Table 2). This may be, in part, because some 13C may have moved on to metabolites that our LC–MS/MS analysis did not capture. However, previous studies in algae also reported higher rates of O2 evolution than of CO2 fixation in algae52,53, with a similar range to that observed by us in LL (Table 2). This can occur if a substantial part of the fixed C is converted to reduced end-products like lipids (Table 1) or Gly3P (Tables 1 and 2 and Supplementary Table 5) and glycerol or, if there is substantial consumption of nicotinamide adenine dinucleotide phosphate (NAD(P)H), in NH4 assimilation (Supplementary Table 5).
Using simplifying assumptions (legend to Extended Data Fig. 6) we estimated demand for Gly3P, acetyl coenzyme A (AcCoA) and NADPH in lipid biosynthesis. Fluxes to Gly3P in LL estimated in this way resembled or were only twofold above those estimated from the initial 13C-labelling kinetics of Gly3P (Table 2). They were tenfold higher for C. ohadii in EIL; this may reflect rapid movement of label through Gly3P into downstream products. Adding the estimated flux to AcCoA (Extended Data Fig. 6) to the minimum rate of C assimilation estimated from 13C-labelling of soluble metabolites, starch and protein (Table 2) led to 31–48% increase in the estimated rate of C assimilation in LL (now ~80%, 50% and 60% of the rate of O2 evolution in C. reinhardtii, C. sorokiniana and C. ohadii, respectively. Much of the remaining discrepancy in LL is explained by consumption of NADPH in lipid synthesis (Extended Data Fig. 6c). The corrected rate of C assimilation in C. ohadii under EIL was still only ~25% of the rate of O2 evolution. Estimated demand for NAD(P)H for lipid synthesis was 3.5-fold to sevenfold higher under EIL than LL (Extended Data Fig. 6c) but this only accounts for ~15% of the discrepancy. We may have underestimated the rate of lipid synthesis or there may be further unidentified redox group-consuming processes in C. ohadii under EIL.
Discussion
Metabolic fluxes are emergent metabolic phenotypes that are generated by the levels of transcripts and the levels and properties of the encoded proteins and associated changes in metabolite levels54,55,56. We have compared the levels and labelling kinetics of >40 intermediates in central metabolism and used them, together with published data31,32, to compare flux patterns in three algae and model C3 and C4 plants. This comprehensive comparison of fluxomes across the plant kingdom, allows us to identify differences in flux patterns between (1) three algal species with differing growth rates, (2) C. ohadii in low versus very high light and (3) algae and model C3 or C4 plants.
Figure 5 summarizes labelling patterns in algae and higher plants. Clustering of single labelling curves for metabolites across the entire algal time series was not possible due to the use of separate labelling setups for 0–40 s and 15–300 min. We instead associated each metabolite with the published clusters from Arabidopsis31 and maize32 (see legend of Fig. 5 for details). Figure 6 provides a schematic summary of estimated fluxes and contents in the various algae (extracted from Tables 1 and 2 and Supplementary Tables 3 and 6) and corresponding values for Arabidopsis (extracted from refs. 31,57,58,59). Compared to Arabidopsis, algae are characterized by high fluxes to PEP and metabolic pathways downstream of PEP, rapid protein synthesis rates (Extended Data Fig. 5) and rapid lipid synthesis (Extended Data Fig. 6). They exhibit rather diverse fluxes in sugar and starch metabolism.

For plants, metabolites are presented according to their clustering as performed by refs. 31,32. SBP in maize has been corrected on the basis of its active pool32. For algae, due to the separate labelling setups for the different time scales (seconds versus minutes–hours), unified clustering for the entire time series was not possible. Instead, metabolites in cluster 1 from the 0–40 s were assigned to cluster 1 and clusters 3 and 4 from the 15–300 min pulses were assigned to cluster 4. The rest of the intermediates were assigned on a case-by-case basis according to the similarity of their enrichment pattern to the published clusters for Arabidopsis31 and maize32, using Supplementary Tables 1, 4 and 5, to generate a qualitative comparative representation of labelling kinetics across central metabolism. For each metabolite, triangles denote clustering in each species (see legend): CO, C. ohadii; CS, C. sorokiniana; Cr, C. reinhardtii; At, A. thaliana; Zm, Zea mays, following the color-scheme from Figs. 1 and 2. Cluster 1 — red, cluster 2 — orange, cluster 3 — yellow and cluster 4 — blue, for empty triangles no data is available on clustering.

Data represented are from Tables 1 and 2 and Supplementary Table 6. Photosynthesis rates are based on minimum C assimilation rates in Table 1. Due to the different light regimes (diel, continuous) between algae and Arabidopsis, starch synthesis rates are based on the ‘starch synthesis rate’ column in Table 2. Circle sizes correspond to interspecies relative levels/rates per parameter (row). Scale differs for each trait.
The following sections discuss the differences in metabolite levels and flux patterns between algae and higher plants. These may in part reflect differing allocation and growth strategies in single-celled algae and multi-organ higher plants. In algae, C is assimilated and used for growth or stored as starch or lipid in the same cell. In higher plants, C is assimilated in source leaves and the vast majority exported to support growth in sink organs. Export occurs mainly as sucrose, although a small proportion of the fixed C is used to synthesize organic acids and amino acids. These and other potential restrictions of the datasets are discussed in the Supplementary text).
RuBP regeneration in the CBC
The near-linear labelling kinetics in CBC intermediates in algae (Extended Data Fig. 2) demonstrated their potential as a useful model for analysis of photosynthetic metabolism. We were able to detect small differences in labelling kinetics within the CBC including faster labelling of SBP, PP and RuBP in C. ohadii than in C. reinhardtii, C. sorokiniana, Arabidopsis or maize (Supplementary Table 4 and Supplementary Fig. 3). Both labelling kinetics and INST-MFA (Fig. 4) point to C. ohadii having faster regeneration of RuBP, a subprocess that is often limiting for C fixation13.
Coupling of lower glycolysis to the CBC
Algae differ markedly from higher plants in having higher flux from the CBC through lower glycolysis to PEP (Fig. 5 and Supplementary Table 4). Labelling of PEP is very rapid in algae, following closely the labelling of early CBC intermediates. This is especially apparent in C. ohadii where there is no delay in labelling of PEP compared to CBC intermediates and in C. sorokiniana where there is only a small delay (Fig. 2, Supplementary Fig. 3, Extended Data Fig. 2 and Supplementary Table 4). There is a more marked delay in Arabidopsis and especially maize (Supplementary Table 4; see Supplementary text for discussion of why this reflects the topology of C4 photosynthesis). Rapid flux through PEP was also apparent in longer pulses that investigated labelling patterns of end-products in algae (next section). This agreement makes it unlikely that the slow initial labelling of PEP in leaves is due to a large unlabelled pool of PEP in non-photosynthetic cells (Supplementary text).
The potential impact of this rapid flux to PEP in algae is considerable. PEP is the starting point for many important biosynthetic pathways60, either directly (for example, via the shikimate pathway) or via PEPC and the TCA cycle for the synthesis of many amino acids and specialized metabolites or through pyruvate and isoprenoid synthesis. Rapid lipid synthesis in algae (Table 1 and Extended Data Fig. 6) also generates high demand for PEP. Conversely, in higher plants low flux to PEP may reflect a trade-off with rapid synthesis of sucrose for export to growing sink organs61, in line with the high flux to sucrose in Arabidopsis, both in absolute terms and specially relative to the rate of C assimilation (Table 2). Indeed, on the basis of previous 14C-labelling studies62,63 flux to sucrose in Arabidopsis may still be underestimated by ~20%.
Anaplerotic C investment predicts growth rate
Labelling kinetics in algae reveal substantial flow of fixed C from PEP into the TCA cycle intermediates and amino acids like pyruvate, malate, succinate, aspartate and glutamate (Figs. 3 and 5 and Supplementary Table 5). This was also captured by INST-MFA, although the predicted flux is probably largely underestimated (Fig. 4 and Supplementary text). Anaplerotic C metabolism is necessary to replace TCA cycle intermediates that are consumed by biosynthetic pathways in all life forms64. Whilst rate of labelling of malate in algae was comparable to that in the C4 species maize, other TCA intermediates like succinate and fumarate, as well as glutamate that derives from 2OG, were labelled much faster in algae than in maize (Fig. 5). Further, and importantly, the isotopomer pattern of malate and aspartate at early time points differed between algae and maize, revealing that the rapid labelling of malate in algae reflects high anaplerotic flux rather than algal C4-like metabolism (Supplementary text and also refs. 65,66,67). Anaplerotic flux is needed to supply C skeletons for amino acid synthesis to support the twofold to tenfold higher rate of protein synthesis in the Chlorella species compared with Arabidopsis (Supplementary Table 6). This, in turn, supports the high growth rates of these algae (Extended Data Fig. 5b). It is possible that the overall labelling kinetics of organic acids and amino acids may be affected by compartmentation, either between the cytoplasm and vacuole or between photosynthetic and non-photosynthetic cells in leaves. However, the number of metabolites affected and the supporting evidence provided by the higher rate of protein synthesis makes it very likely that the faster labelling of organic acid and amino acids in algae is at least partly due to increased anaplerotic flux.
In photosynthetic leaf cells, the enzymes that catalyse the reactions of lower glycolysis (phosphoglycerate mutase, PGM, and enolase, ENO) are largely confined to the cytosol68. Increased flux to PEP might be achieved by modified activity of the triose phosphate translocator (TPT) that exchanges triose phosphate, 3PGA and inorganic phosphate (Pi) between the chloroplast stroma and the cytosol69, increased conversion of triose phosphate to 3PGA in the cytosol, for example, by non-phosphorylating NADP-GAPDH (as recently suggested for C. ohadii in EIL27) or increased activity of cytosolic PGM and ENO. In addition, INST-MFA flux modelling and published gene expression and localization data indicate that a small part of the flux to PEP and pyruvate in algae might occur in the plastid (Fig. 4 and Supplementary Table 9, net fluxes; and see Supplementary text). Increased flux from PEP to organic acids will require operation of PEPC and (for all except oxaloacetate, malate and fumarate) mitochondrial pyruvate dehydrogenase (mPDH). Comparative sequence analysis of TPT, PGM, ENO, PEPC and mPDH revealed unique substitutions in conserved residues in algal variants compared with plant homologues (Supplementary text), with some being unique to C. ohadii and others shared by several Chlorella spp. or other algae. They included changes in key residues in regulatory or even active site domains and, in several cases, altered cysteine distribution patterns.
Increased synthesis of galactose and Gly3P in algae
Galactose and Gly3P metabolism represent another basic difference between algae and plants (Supplementary text). Even though enrichment of galactose (Fig. 3; cluster 4 in all three algae under LL and cluster 3 in C. ohadii under EIL) and Gly3P (Fig. 3; cluster 4 in C ohadii and C. sorokiniana under LL, cluster 3 in C. ohadii under EIL and cluster 2 in C. reinhardtii under LL) rose slowly, their large pool sizes mean that flux of fixed C into these metabolites was substantial especially in C. ohadii (Table 2 and Extended Data Figs. 3 and 6), competing with fluxes to sucrose and other reducing sugars and supply of PEP and pyruvate for biosynthetic pathways (Table 1 and Extended Data Fig. 6).
Interalgal distinctive kinetic patterns
Apart from differences between algae and higher plants, our studies uncover differences between the algal species (Fig. 6). These include lower levels of metabolic intermediates and a higher protein content in C. reinhardtii compared with the Chlorella species and the virtual absence of sucrose from C. reinhardtii.
C. reinhardtii contained much lower levels of CBC and other metabolic intermediates than the two Chlorella species per unit DW (Supplementary Table 3). The difference was even more marked per unit protein because C. reinhardtii has a higher protein content than the Chlorella species (Fig. 6). Generally higher levels of intermediates in the Chlorella species might contribute to the higher flux in the CBC, sucrose and starch synthesis, lower glycolysis and the TCA cycle compared with C. reinhardtii (Table 2 and Fig. 5). It might also be associated with differing osmoprotection strategies. Whereas C. reinhardtii accumulates large amounts of the specialized metabolite glycerol, Chlorella species accumulate a wider range of central metabolites like sucrose (even in non-stress conditions; Fig. 6 and Tables 1 and 2) and proline (ref. 70 and references therein). Whilst such differences are especially relevant under stress, they may impact on metabolic patterns in non-stress conditions. More generally, higher metabolite levels might support increased metabolic flexibility, including the ability of C. ohadii to cope with extreme stress26. Flexibility may result from more efficient enzymes but might also require higher substrate saturation, allowing higher fluxes, and partly compensating for the lower protein content in the Chlorella species (Table 1).
The lower protein content of the Chlorella species (Fig. 6 and Extended Data Fig. 5a) might contribute to their faster growth rates because protein synthesis is energetically costly. It is, however, intriguing, that despite their lower protein content, the Chlorella species achieve higher rates of photosynthesis than C. reinhardtii. It is possible that they invest a larger proportion of total protein in photosynthetic machinery than does C. reinhardtii, where substantial amounts of protein may be present in other cellular components like the cell wall and flagellum. The cell wall of C. reinhardtii contains abundant proteins and accounts for 32% of the total proteome71, whereas a wide but lower range of cell wall protein content has been reported in Chlorella species (6–27%)72,73,74. This comparison is limited by the availability of robust proteomic datasets for algae. Quantitative analysis of more algal proteomes combined with studies of the activities and kinetic properties of enzymes could improve our understanding of what limits growth rates in different algae.
Another difference between algae was the very low content and flux to sucrose in C. reinhardtii (Figs. 3, 4 and 5, Extended Data Fig. 3, Table 1 and Supplementary Table 5). There was also a trend to slower starch synthesis in C. reinhardtii than in the Chlorella species.
Comparing C. ohadii in EIL and LL revealed much faster anaplerotic flux over PEPC under EIL (Table 2) that probably contributes to rapid growth by supporting faster protein synthesis (Supplementary text). There was also increased lipid synthesis (Extended Data Fig. 6), possibly linked with faster starch turnover (Table 2 and Supplementary text).
Prospective for plant synthetic biology
Research aiming at redesigning photosynthesis to improve plant productivity and performance is experiencing a golden-era, boosted by support from modelling and advances in computational technologies4. Potential avenues for improvement range from in silico manipulations to exploiting natural variation9. Our results highlight examples of distinct flux patterns between algae and higher plants, raising the question of what mechanisms support the faster protein and lipid synthesis in algae and whether these might provide useful resources to improve crop photosynthesis and yield (Supplementary text—potential routes for plant metabolic engineering).
Methods
Chemicals
Biochemicals, enzymes and other special reagents were obtained from Sigma-Aldrich, Roche and Merck. All solutions were prepared with purified deionized water (0.055 µS cm−1; PureLab plus and PureLab ultra, ELGA).
Algal cultures
Cultures of C. ohadii, C. sorokiniana and C. reinhardtii were grown in flat glass bioreactor vessels (FMT-150, PSI), as previously described26. The medium in the bioreactors was HP without acetate75 to grow the cells photoautotrophically. Unless specified otherwise, the experiments were initiated at low cell density corresponding to optical density OD735nm = 0.02 and the culture temperature was stabilized at 35.0 ± 0.3 °C for C. ohadii and C. sorokiniana or 25.0 ± 0.3 °C for C. reinhardtii. Irradiance levels included two regimes: 100 μmol photons m−2 s−1 (LL) and 3,000 μmol photons m−2 s−1 (EIL), as described in ref. 27. Air for bubbling was supplied using an air-pump at ∼1 l min−1. The pH and dissolved oxygen concentration were monitored in situ every 1 min. Optical densities OD680nm and OD735nm (which correlates with algal biomass27) were monitored every 1 min. All cultures were grown starting from the same inoculum density. Bioreactors were autoclaved with medium and electrodes, and axenic inoculum was added on a sterile bench, together with 0.22 µm filters on all air inlets/outlets of the system. The cultures were axenic, as validated with light microscopy (Eclipse E200, Nikon) and Luria–Bertani plating/incubation. Independent biological replicates were collected from three separate bioreactor runs for each alga or condition. Ash-free dry weight per volume for each culture was determined as in ref. 76.
Gas exchange measurements
The O2 evolution of algal suspension withdrawn from the bioreactor was measured for 2 min at temperature corresponding to the growth conditions, in a closed temperature-controlled 0.65 cm diameter cuvette under continuous stirring (Clark type O2 electrode, PS2108, Passport dissolved O2 sensor). Light was supplied from a custom-made ring-formed LED light system; the applied intensity was made equivalent to the current growth intensity by measuring the penetrating light inside a cuvette filled with culture using an integrating sphere (Walz). Measurements were made at ambient CO2.
13CO2-labelling and sampling procedures
Two setups were used to provide inorganic 13C to algal liquid cultures (see Supplementary text for additional information on the requirements and design of the labelling system). For very short pulses (up to 40 s) a closed microfluidic system mixed cultures with 13C pre-equilibrated medium bubbled with a synthetic gas mixture. For longer incubation times (15–300 min), inorganic 13C was introduced via direct bubbling of the cultures with the same gas mixture. In both, 78% N2, 21% O2 and 400 ppm 13CO2 were mixed using mass flow controllers (Brooks Instruments) as described in ref. 31.
For rapid labelling (time points 5, 10, 20 and 40 s), a fresh HP medium (pH 6.2) was bubbled for 30 min to ensure <1% residual 12CO2 levels (Supplementary Fig. 8). In this freshwater medium, at this acidic pH, CO2 constitutes >70% of the total Ci species, with no large storage pool of HCO3 (ref. 77), as confirmed by the rapid drop in 12CO2 signal within <1 min of bubbling with the labelled gas mixture (Supplementary Fig. 8b). Bubbling was performed in a humidifier submerged in a temperature-controlled water bath at temperature corresponding to the growth conditions of each alga and in a separate room to avoid 13CO2 contamination of the cultures. A 20 ml syringe was washed three times and filled with the bubbled solution keeping contact with air to a minimum. Thereafter this syringe was loaded to a syringe pump (NE-1600 Multi-Channel Syringe Pump, New Era) and connected to transparent tubing (Supplementary Fig. 1a). Handling algal samples from their withdrawal from the bioreactors to quenching was planned to minimize shading of the cells due to the sensitivity of C fixation reactions to changes in light. A syringe was used to withdraw fresh algal samples from the bioreactor, loaded to the pump and connected to transparent tubing and luers. This was mixed 1:1 with 13C pre-equlibrated media, supplied from a second syringe (above). Cultures and fresh media were pushed through a tailor-made transparent mixer designed on the basis of ref. 78 (see scheme in Supplementary Fig. 1b) to transparent tubing into 70% methanol solution cooled to –70 °C as in ref. 75. Light was provided by an upper positioned cool-white LED array (PSI) through the entire route from sampling at the bioreactor to the quenching tube, with intensities made equivalent to the penetrating light for each culture and avoiding manual shading. Pulse duration was implemented by fitting the length of the transparent tubing downstream to the mixer to spray the culture/13CO2 solution mixture into the quenching tube at desired timings. Cooled tubes were kept at –70 °C until centrifugation (3,200g, 3 min, –9 °C). Thereafter, supernatant was discarded and pelleted tubes were frozen immediately in liquid nitrogen. LC–MS/MS analysis of supernatants from concentrated (15×) samples of all algae demonstrated metabolite levels of up to ~1% that of equivalent pellets. Non-labelled samples for each pulse time-series replica were generated by mixing of the same algal culture with fresh HP medium bubbled with ambient air through a humidifier at the same temperature as the 13C-labelling. Frozen pellets were resuspended in ice-cold methanol/chloroform (5:1, v/v). Following four cycles of freeze–thaw of resuspended cells, metabolites were extracted according to ref. 75.
For slow labelling, running algal cultures were bubbled with 13CO2. This was done because, in the closed microfluidic system, longer incubation times would lead to Ci depletion. The gas mixture (bubbled ∼1 l min−1 through a humidifier) was switched from natural air to the same synthetic 13C-labelled air mixture as above. Measured residual 12CO2 in the cultures was below 2% within a few minutes of pulse (Supplementary Fig. 8a) and H12CO3− was rapidly equilibrated by the cells as previously reported for low CO2-acclimated algae79 and demonstrated here by the absence of a slow 12CO2 decay phase in the cultures (compare Supplementary Fig. 8a and b). Samples were withdrawn before switching (T0) and following 15, 30, 60, 120, 180 and 300 min of bubbling with 13C synthetic gas mixture. All samples were collected into 50 ml falcons, immediately centrifuged (3,200g, 3 min, –9 °C) and pellets immediately frozen in liquid nitrogen. Centrifugation was necessary because, with time, some metabolites can accumulate in the medium, so labelling patterns in the complete suspension may not reflect that in the cells (ref. 75). Frozen pellets were resuspended in precooled (–20 °C) MTBE solution (methanol/methyl tert‐butyl‐ether, 1:3, v/v) to follow a two-phase extraction approach developed by ref. 42. Following four cycles of freeze–thaw of resuspended pellets, metabolites, protein and starch were extracted and analysed. The lower phase, containing the polar and semipolar metabolites, was dried in a SpeedVac concentrator and stored at –80 °C for metabolite profiling. The upper MTBE phase, containing lipids, was dried and analysed for lipid content and labelling (below). The solid pellets containing the precipitated protein and starch were stored at –20 °C before further analysis (below).
Growth and labelling of Arabidopsis
For Arabidopsis, to confirm and deepen our previous study31, 13C-labelling was repeated with a total of 15 time points (0, 5, 10, 20, 30, 45, 60, 90 s and 2, 3, 5, 10, 20, 40 and 60 min) and with three to 13 replicates per time point. 13CO2-labelling and data analysis were performed as described in ref. 80.
Arabidopsis Col-0 material was taken from ref. 43 for analyses of galactose and Gly3P. Briefly, plants were grown in a 1:1 mixture of soil (Stender) and vermiculite, in controlled-environment chambers with 16-h photoperiod and day/night temperatures of 22/18 °C and 150–160 µmol m−2 s−1 irradiance provided by fluorescent lights. Rosettes were harvested in the ambient growth conditions by rapid quenching in liquid nitrogen, ground and metabolites were extracted with methanol-chloroform81.
Metabolite profiling
For LC–MS/MS quantification, metabolites were measured as described previously82. Data for 3PGA are solely based on signal peak areas obtained in extracts, as chromatograms obtained with the standards could not support absolute quantification. The obtained peaks were integrated using the Thermo Finnigan processing software package LCQuan-2.5. Since mass spectrometry detects ionized compounds separated by their mass-to-charge ratio, the mass-to-charge ratio of 13C-labelled compounds increases by an amount that equals the number of incorporated 13C atoms. Therefore, by determining the ratio of intensity of the monoisotopic ion and its isotopic ions, the level in stable isotope labelling (enrichment) was quantified. In maize, SBP has an ‘active’ pool that is involved in the CBC and is rapidly labelled, which our analysis (Supplementary Table 4) focused on, and a separate pool that labels very slowly32.
For GC–MS, metabolites were methoxyaminated and trimethylsilylated manually as previously described26. Profiling was performed using gas chromatography mass spectrometry (GC–MS) with an Agilent 6890N24 gas chromatograph (Agilent Technologies, http://www.agilent.com) with splitless injection onto a Factor Four VF-5ms capillary column, 30-m length, 0.25-mm inner diameter, 0.25-μm film thickness (Varian-Agilent Technologies), which was connected to a Pegasus III time-of-flight mass spectrometer (LECO Instrumente GmbH, https://eu.leco.com/). Retention indices were calibrated by addition of an n-alkane mixture (C10, C12, C15, C18, C19, C22, C28, C32, C36) to each sample. GC–MS chromatograms were acquired, visually controlled, baseline corrected and exported in NetCDF file format using ChromaTOF software (v.4.22; LECO). TagFinder software v.1.0 (ref. 83) was used for GC–MS data processing into a standardized numerical data matrix and compound identification. Mass features were identified by mass spectral and retention time index matching to the reference collection of the Golm metabolome database (GMD, http://gmd.mpimpgolm.mpg.de/)84. Requirements for the manually supervised analyte identification were the presence of at least three specific mass fragments per mass feature and a retention index deviation <1.0%. Metabolite isotopologues were evaluated for uniqueness by correlation analysis, using the sum of all detected isotopologues per mass fragment and comparing among fragments or molecular ions from the same analyte. The sum of isotopologues were used in both labelled and non-labelled conditions for quantification, while isotopologue distributions were used for stable isotope enrichment analysis. Absolute quantification was performed, using authenticated commercially available reference substances and co-analysed calibration graphs. Enrichment analysis was restricted to mass fragments with known atomar composition. Expected atomar composition and natural enrichment were checked by non-labelled samples, for example those used to obtain calibration curves. After correction for natural occurring isotopes, experimental enrichment of approximately zero was obtained. Laboratory and reagent contaminations were evaluated and removed by non-sample control experiments.
Both LC–MS/MS and GC–MS matrices were subsequently processed using the Corrector software tool (https://www.mpimp-golm.mpg.de/19405/Corrector_package_V1_91.zip). Metabolite quantification from both platforms was performed on the basis of calibration curves obtained with authentic standards whose matrices were also corrected. Relative isotopomer abundance (m + n) for each metabolite is calculated as in ref. 31. Total amounts of PEP were determined by using freshly prepared extracts in trichloroacetic acid. Levels were determined enzymatically with Shimadzu UV-2600i spectrophotometer (Shimadzu) based on ref. 85.
GC–MS chromatograms from the algae and Arabidopsis overlaid on a Gly3P standard are provided in Supplementary Fig. 8 for illustration. As aldose sugars show similar mass features and retention times in GC–MS, we verified our analyses by overlaying plant and algal chromatograms on those of eight hexoaldose standards (Supplementary Fig. 9).
Starch quantification and enrichment
Starch in pellets was analysed as in ref. 57. Briefly, following neutralization, starch was digested to glucose with α-amylase and α-amyloglucosidase. Thereafter, glucose was assayed enzymatically for total starch content or converted to G6P by incubation with hexokinase and excess ATP, and 13C in G6P was measured by LC–MS/MS86.
Protein quantification and enrichment
Total protein was extracted from the insoluble pellets for the pulse times 15–300 min after solubilization with 0.1 M NaOH at 95 °C for 60 min and measured using the dye-binding assay87. To account for full extraction and quantification of total protein, we followed the levels of protein after varying freeze–thaw iterations and incubation time with 0.1 M NaOH. In all algae and conditions, protein levels did not increase beyond three freeze–thaw cycles or 30 min of incubation.
To estimate synthesis rates, total soluble protein was isolated, hydrolysed and analysed by GC–MS to determine enrichment in protein-bound amino acids. Briefly, ~100 µg per sample was precipitated and washed and then chemically hydrolysed with 6 M hydrochloric acid at 100 °C for 24 h. Hydrolysate was dried and derivatized for GC–MS analysis. The resulting chromatograms were processed as described above for fragmental isotope enrichment of identified amino acids. Enrichment in amino acids in protein was analysed and quantification of protein synthesis rates from these enrichment data was corrected for incomplete labelling of the free amino acid as previously described58.
Lipid quantification and analysis
Measurement of lipids was performed as described by ref. 88. In brief, dried MTBE phases were resuspended in a volume of 200 μl of a mixture of acetonitrile:isopropanol (7:3) (Biosolve) and measured using Waters Acquity ultra-performance liquid chromatography system (Waters, http://www.waters.com) coupled with Fourier transform mass spectrometry (UPLC–FT-MS) in positive and negative ionization modes. Analysis and processing of mass spectrometry data was done with REFINER MS 10.0 (GeneData, http://www.genedata.com) and comprised peak detection, RT alignment and a chemical noise removal. Derived mass features characterized by specific peak ID, m/z values, retention time and intensity were further processed using custom R scripts. Before annotation of metabolic features using in-house lipid database, isotopic peaks were removed from the MS data. Annotated lipids were confirmed by manual investigation of the chromatograms using Xcalibur (v.3.0, Thermo-Fisher). Peak intensities were day-normalized and sample median-normalized and subsequently log2-transformed. For lipid labelling, we restricted our analysis to m0 decay of major labelled lipids between 0 and 300 min due to their high molar mass and the very complicated spectra with partly overlapping envelopes of 13C-labelled lipids.
Data analysis and statistics
Data processing and statistical analysis were performed in R (ref. 89). MDS was performed for the four algae and conditions with stats R package v.3.6.0 using Euclidean distance90. The input Euclidean distance matrix was calculated on a row-wise concatenated enrichment–time-series matrix of all algae and conditions. Clustering has been performed separately for each alga using k-means91 and the number of clusters has been estimated using GAP statistics for k between 2 and 20 in 100 bootstrap samples92 in Cluster R package v.2.0.8 (ref. 93). ANOVA were performed using the car R package v.3.0.9. Minimum estimates of fluxes to all organic and amino acid quantified by GC–MS analysis were performed by summing the slopes over time of level × enrichment products for pyruvate, citrate, glutamate, proline and glycine, provided in Supplementary Tables 3 and 5, respectively.
INST-MFA
Flux estimation by INST-MFA, statistical analysis, as well as confidence interval calculation were performed using implementations provided along the INCA software package94. INCA relies on the elementary metabolite unit decomposition95 to estimate flux values that provide an optimal fit of simulated and measured metabolite labelling patterns of measured metabolites as well as statistical and sensitivity analysis of the optimal solution. The isotopomer model of ref. 37, which includes reactions of the CBC, photorespiration, starch and sucrose synthesis, TCA cycle as well as amino acid synthesis, was adapted by removing the biomass reactions simulating transport into phloem and adding reactions from 3PGA to PEP. All model reactions and atom transitions are listed in Supplementary Table 9 (reactions). To estimate fluxes in the modelled metabolic network we used mass isotopomer distributions (MIDs) of 17 metabolites (for a list of considered reactions see Supplementary Table 9, used MIDs) over four time points (5, 10, 20 and 40 s). We used the same model across all species, since there are no differences in the stoichiometry of the key pathways in central carbon metabolism between these species; in addition, for fair comparison, we also used the same number of metabolites treated in the same way across the species (Methods). We performed flux estimation in 50 repetitions from different random initial values to obtain best-fit estimates. This gave statistically acceptable fits to measured labelling patterns for C. reinhardtii and C. sorokiniana (χ2 = 180.3 and χ2 = 262.5, respectively, 239 d.f.) and following exclusion of the MIDs of 2OG and glutamate and PEP at 40 s (Supplementary Table 9, used MIDs), for C. ohadii in LL (χ2 = 219.3, 187 d.f.). The agreement between estimated and measured starch and sucrose synthesis rates (Table 1) contributes to the χ2 for all algae. In line with ref. 37, metabolite pools were treated as parameters to be fitted and dilution was allowed to model effects of unlabelled subpools. The 95% confidence intervals were computed for all estimated parameters by evaluating the sensitivity of the sum-of-squared residuals to parameter variations96. To obtain statistically acceptable fits, the minimum standard deviation of MIDs was set to 0.001 and the maximum standard deviation over all mass fractions for a given metabolite and time point were considered as error.
Reporting Summary
Further information on research design is available in the Nature Research Reporting Summary linked to this article.
Data availability
All raw metabolite profiling data are provided in the Supplementary Information tables. Reference collection of metabolites from the GMD are available on http://gmd.mpimp-golm.mpg.de/. Sequence data for C. ohadii are available on NCBI (accession PRJNA573576) and in Supplementary Data 1–7.
Code availability
The entire INCA implementation, including data, metabolic model and final simulations, can be found on GitHub (https://github.com/ankueken/INST-MFA_algae) in an INCA readable format.
References
Sayer, J. et al. Ten principles for a landscape approach to reconciling agriculture, conservation, and other competing land uses. Proc. Natl Acad. Sci. USA 110, 8349–8356 (2013).
Tilman, D. et al. Global food demand and the sustainable intensification of agriculture. Proc. Natl Acad. Sci. USA 108, 20260–20264 (2011).
Zhu, X.-G., Long, S. P. & Ort, D. R. Improving photosynthetic efficiency for greater yield. Ann. Rev. Plant Biol. 61, 235–261 (2010).
Ort, D. R. et al. Redesigning photosynthesis to sustainably meet global food and bioenergy demand. Proc. Natl Acad. Sci. USA 112, 8529–8536 (2015).
Ray, D. K. et al. Recent patterns of crop yield growth and stagnation. Nat. Commun. 3, 1293 (2012).
Wiesmeier, M., Hübner, R. & Kögel-Knabner, I. Stagnating crop yields: an overlooked risk for the carbon balance of agricultural soils? Sci. Total Environ. 536, 1045–1051 (2015).
Brisson, N. et al. Why are wheat yields stagnating in Europe? A comprehensive data analysis for France. Field Crops Res. 119, 201–212 (2010).
Grassini, P., Eskridge, K. M. & Cassman, K. G. Distinguishing between yield advances and yield plateaus in historical crop production trends. Nat. Commun. 4, 2918 (2013).
Long, S. P. et al. Can improvement in photosynthesis increase crop yields? Plant Cell Environ. 29, 315–330 (2006).
Parry, M. A. et al. Raising yield potential of wheat. II. Increasing photosynthetic capacity and efficiency. J. Exp. Bot. 62, 453–467 (2011).
Simkin, A. J., Lopez-Calcagno, P. E. & Raines, C. A. Feeding the world: improving photosynthetic efficiency for sustainable crop production. J. Exp. Bot. 70, 1119–1140 (2019).
Blankenship, R. E. et al. Comparing photosynthetic and photovoltaic efficiencies and recognizing the potential for improvement. Science 332, 805–809 (2011).
Raines, C. A. The Calvin cycle revisited. Photosynth. Res. 75, 1–10 (2003).
Bauwe, H., Hagemann, M. & Fernie, A. R. Photorespiration: players, partners and origin. Trends Plant Sci. 15, 330–336 (2010).
Kaplan, A. & Reinhold, L. The CO2 concentrating mechanisms in photosynthetic microorganisms. Annu. Rev. Plant Physiol. Plant Mol. Biol. 50, 539–570 (1999).
Giordano, M., Beardall, J. & Raven, J. A. CO2 concentrating mechanisms in algae: mechanisms, environmental modulation, and evolution. Ann. Rev. Plant Biol. 56, 99–131 (2005).
Hatch, M.-D. & Kagawa, T. Enzymes and functional capacities of mesophyll chloroplasts from plants with C4-pathway photosynthesis. Arch. Biochem. Biophys. 159, 842–853 (1973).
Hatch, M. D. C4 photosynthesis: a unique blend of modified biochemistry, anatomy and ultrastructure. Biochim. Biophys. Acta 895, 81–106 (1987).
Evans, L. T. & Dunstone, R. L. Some physiological aspects of evolution in wheat. Aust. J. Biol. Sci. 23, 725–742 (1970).
Janssen, M. et al. Enclosed outdoor photobioreactors: light regime, photosynthetic efficiency, scale-up, and future prospects. Biotechnol. Bioeng. 81, 193–210 (2003).
Georgianna, D. R. & Mayfield, S. P. Exploiting diversity and synthetic biology for the production of algal biofuels. Nature 488, 329–335 (2012).
Vecchi, V. et al. Potential and challenges of improving photosynthesis in algae. Plants 9, 67 (2020).
Treves, H. et al. A newly isolated Chlorella sp. from desert sand crusts exhibits a unique resistance to excess light intensity. FEMS Microbiol. Ecol. 86, 373–380 (2013).
Treves, H. et al. The mechanisms whereby the green alga Chlorella ohadii, isolated from desert soil crust, exhibits unparalleled photodamage resistance. New Phytol. 210, 1229–1243 (2016).
Ananyev, G. et al. Photosystem II-cyclic electron flow powers exceptional photoprotection and record growth in the microalga Chlorella ohadii. Biochim. Biophys. Acta Bioenerg. 1858, 873–883 (2017).
Treves, H. et al. Metabolic flexibility underpins growth capabilities of the fastest growing alga. Curr. Biol. 27, 2559–2567 (2017).
Treves, H. et al. Multi-omics reveals mechanisms of total resistance to extreme illumination of a desert alga. Nat. Plants 6, 1031–1043 (2020).
Blank, L. M. & Sauer, U. TCA cycle activity in Saccharomyces cerevisiae is a function of the environmentally determined specific growth and glucose uptake rates. Microbiology 150, 1085–1093 (2004).
Fischer, E. & Sauer, U. Large-scale in vivo flux analysis shows rigidity and suboptimal performance of Bacillus subtilis metabolism. Nat. Genet. 37, 636–640 (2005).
Hackett, S. R. et al. Systems-level analysis of mechanisms regulating yeast metabolic flux. Science 354, 2786 (2016).
Szecowka, M. et al. Metabolic fluxes in an illuminated Arabidopsis rosette. Plant Cell 25, 694–714 (2013).
Arrivault, S. et al. Metabolite pools and carbon flow during C4 photosynthesis in maize: 13CO2 labeling kinetics and cell type fractionation. J. Exp. Bot. 68, 283–298 (2017).
Huege, J. et al. Modulation of the major paths of carbon in photorespiratory mutants of Synechocystis. PLoS ONE 6, e16278 (2011).
Young, J. D. et al. Mapping photoautotrophic metabolism with isotopically nonstationary 13C flux analysis. Metab. Eng. 13, 656–665 (2011).
Hendry, J. I. et al. Rerouting of carbon flux in a glycogen mutant of cyanobacteria assessed via isotopically non-stationary 13C metabolic flux analysis. Biotechnol. Bioeng. 114, 2298–2308 (2017).
Wienkoop, S. et al. Targeted proteomics for Chlamydomonas reinhardtii combined with rapid subcellular protein fractionation, metabolomics and metabolic flux analyses. Mol. Biosyst. 6, 1018–1031 (2010).
Ma, F. et al. Isotopically nonstationary 13C flux analysis of changes in Arabidopsis thaliana leaf metabolism due to high light acclimation. Proc. Natl Acad. Sci. USA 111, 16967–16972 (2014).
Abernathy, M. H. et al. Deciphering cyanobacterial phenotypes for fast photoautotrophic growth via isotopically nonstationary metabolic flux analysis. Biotechnol. Biofuels 10, 273 (2017).
Xu, Y. et al. The metabolic origins of non-photorespiratory CO2 release during photosynthesis: a metabolic flux analysis. Plant Physiol. 186, 297–314 (2021).
Sulpice, R. et al. Arabidopsis coordinates the diurnal regulation of carbon allocation and growth across a wide range of photoperiods. Mol. Plant 7, 137–155 (2014).
Erban, A. et al. Nonsupervised construction and application of mass spectral and retention time index libraries from time-of-flight gas chromatography–mass spectrometry metabolite profiles. Methods Mol. Biol. 358, 19–38 (2007).
Jüppner, J. et al. Dynamics of lipids and metabolites during the cell cycle of Chlamydomonas reinhardtii. Plant J. 92, 331–343 (2017).
Fichtner, F. et al. Functional features of TREHALOSE-6-PHOSPHATE SYNTHASE1—an essential enzyme in Arabidopsis thaliana. Plant Cell 32, 1949–1972 (2020).
Vitova, M. et al. Accumulation of energy reserves in algae: from cell cycles to biotechnological applications. Biotechnol. Adv. 33, 1204–1218 (2015).
Busi, M. V., Barchiesi, J., Martin, M. & Gomez-Casati, D. F. Starch metabolism in green algae. Starch 66, 28–40 (2014).
Mugford, S. T. et al. Regulatory properties of ADP glucose pyrophosphorylase are required for adjustment of leaf starch synthesis in different photoperiods. Plant Physiol. 166, 1733–1747 (2014).
Gibon, Y. et al. Adjustment of growth, starch turnover, protein content and central metabolism to a decrease of the carbon supply when Arabidopsis is grown in very short photoperiods. Plant Cell Environ. 32, 859–874 (2009).
Li-Beisson, Y. et al. The lipid biochemistry of eukaryotic algae. Prog. Lipid Res. 74, 31–68 (2019).
Ishihara, H. et al. Growth rate correlates negatively with protein turnover in Arabidopsis accessions. Plant J. 91, 416–429 (2017).
Winichayakul, S. et al. In vivo packaging of triacylglycerols enhances Arabidopsis leaf biomass and energy density. Plant Physiol. 162, 626–639 (2013).
Lin, W. & Oliver, D. J. Role of triacylglycerols in leaves. Plant Sci. 175, 233–237 (2008).
Kong, F. et al. Interorganelle communication: peroxisomal malate dehydrogenase 2 connects lipid catabolism to photosynthesis through redox coupling in chlamydomonas. Plant Cell 30, 1824–1847 (2018).
Milrad, Y. et al. Green algal hydrogenase activity is outcompeted by carbon fixation before inactivation by oxygen takes place. Plant Physiol. 177, 918–926 (2018).
Kueger, S. et al. High-resolution plant metabolomics: from mass spectral features to metabolites and from whole-cell analysis to subcellular metabolite distributions. Plant J. 70, 39–50 (2012).
Hall, R. D. Plant metabolomics: from holistic hope, to hype, to hot topic. New Phytol. 169, 453–468 (2006).
Schryer, D. W. et al. Bidirectionality and compartmentation of metabolic fluxes are revealed in the dynamics of isotopomer networks. Int. J. Mol. Sci. 10, 1697–1718 (2009).
Fernandez, O. et al. Leaf starch turnover occurs in long days and in falling light at the end of the day. Plant Physiol. 174, 2199–2212 (2017).
Ishihara, H. et al. Quantifying protein synthesis and degradation in Arabidopsis by dynamic 13CO2 labeling and analysis of enrichment in individual amino acids in their free pools and in protein. Plant Physiol. 168, 74–93 (2015).
Mengin, V. et al. Photosynthate partitioning to starch in Arabidopsis thaliana is insensitive to light intensity but sensitive to photoperiod due to a restriction on growth in the light in short photoperiods. Plant Cell Environ. 40, 2608–2627 (2017).
Prabhakar, V. et al. Phosphoenolpyruvate provision to plastids is essential for gametophyte and sporophyte development in Arabidopsis thaliana. Plant Cell 22, 2594–2617 (2010).
Smith, A. M. & Stitt, M. Coordination of carbon supply and plant growth. Plant Cell Environ. 30, 1126–1149 (2007).
Kölling, K. et al. A device for single leaf labelling with CO2 isotopes to study carbon allocation and partitioning in Arabidopsis thaliana. Plant Methods 9, 45 (2013).
Kölling, K. et al. Carbon partitioning in Arabidopsis thaliana is a dynamic process controlled by the plants metabolic status and its circadian clock. Plant Cell Environ. 38, 1965–1979 (2015).
Huppe, H. C. & Turpin, D. H. Integration of carbon and nitrogen metabolism in plant and algal cells. Annu. Rev. Plant Physiol. Plant Mol. Biol. 45, 577–607 (1994).
Riebesell, U. Photosynthesis. Carbon fix for a diatom. Nature 407, 959–960 (2000).
Johnston, A. M. et al. Carbon fixation. Photosynthesis in a marine diatom. Nature 412, 40–41 (2001).
Haimovich-Dayan, M. et al. The role of C4 metabolism in the marine diatom Phaeodactylum tricornutum. New Phytol. 197, 177–185 (2013).
Voll, L. M. et al. Antisense inhibition of enolase strongly limits the metabolism of aromatic amino acids, but has only minor effects on respiration in leaves of transgenic tobacco plants. New Phytol. 184, 607–618 (2009).
Flügge, U. I. & Heldt, H. W. The phosphate-triose phosphate-phosphoglycerate translocator of the chloroplast. Trends Biochem. Sci. 9, 530–533 (1984).
Ben-Amotz, A. & Avron, M. Accumulation of metabolites by halotolerant algae and its industrial potential. Annu. Rev. Microbiol. 37, 95–119 (1983).
Miller, D. H. et al. The chemical composition of the cell wall of Chlamydomonas gymnogama and the concept of a plant cell wall protein. J. Cell Biol. 63, 420–429 (1974).
Kapaun, E., Loos, E. & Reisser, W. Cell wall composition of virus-sensitive symbiotic Chlorella species. Phytochemistry 31, 3103–3104 (1992).
Loos, E. & Meindl, D. Composition of the cell wall of Chlorella fusca. Planta 156, 270–273 (1982).
Northcote, D. H., Goulding, K. J. & Horne, R. W. The chemical composition and structure of the cell wall of Chlorella pyrenoidosa. Biochem. J. 70, 391–397 (1958).
Mettler, T. et al. Systems analysis of the response of photosynthesis, metabolism, and growth to an increase in irradiance in the photosynthetic model organism Chlamydomonas reinhardtii. Plant Cell 26, 2310–2350 (2014).
Klassen, V. et al. A novel one-stage cultivation/fermentation strategy for improved biogas production with microalgal biomass. J. Biotechnol. 215, 44–51 (2015).
Wetzel, R.G. in Limnology 3rd edn (ed. Wetzel, R. G.) 187–204 (Academic Press, 2001).
Sivashankar, S. et al. A ‘twisted’ microfluidic mixer suitable for a wide range of flow rate applications. Biomicrofluidics 10, 034120 (2016).
Tchernov, D. et al. Massive light-dependent cycling of inorganic carbon between oxygenic photosynthetic microorganisms and their surroundings. Photosynth. Res. 77, 95–103 (2003).
Heise, R. et al. Flux profiling of photosynthetic carbon metabolism in intact plants. Nat. Protoc. 9, 1803–1824 (2014).
Lunn, JohnE. et al. Sugar-induced increases in trehalose 6-phosphate are correlated with redox activation of ADP glucose pyrophosphorylase and higher rates of starch synthesis in Arabidopsis thaliana. Biochem. J. 397, 139–148 (2006).
Arrivault, S. et al. Metabolite pools and carbon flow during C4 photosynthesis in maize: 13CO2 labeling kinetics and cell type fractionation. J. Exp. Bot. 68, 283–298 (2017).
Luedemann, A. et al. TagFinder for the quantitative analysis of gas chromatography-mass spectrometry (GC–MS)-based metabolite profiling experiments. Bioinformatics 24, 732–737 (2008).
Kopka, J. et al. GMD@CSB.DB: the Golm metabolome database. Bioinformatics 21, 1635–1638 (2005).
Merlo, L. et al. Changes of carbohydrates, metabolites and enzyme activities in potato tubers during development, and within a single tuber along a stolon–apex gradient. J. Plant Physiol. 142, 392–402 (1993).
Arrivault, S. et al. Use of reverse-phase liquid chromatography, linked to tandem mass spectrometry, to profile the Calvin cycle and other metabolic intermediates in Arabidopsis rosettes at different carbon dioxide concentrations. Plant J. 59, 826–839 (2009).
Bradford, M. M. A rapid and sensitive method for the quantitation of microgram quantities of protein utilizing the principle of protein–dye binding. Anal. Biochem. 72, 248–254 (1976).
Hummel, J. et al. Ultra performance liquid chromatography and high resolution mass spectrometry for the analysis of plant lipids. Front. Plant Sci. 2, 54 (2011).
Gentleman, R. C. et al. Bioconductor: open software development for computational biology and bioinformatics. Genome Biol. 5, R80 (2004).
R Core Team. R: A Language and Environment for Statistical Computing (R Foundation for Statistical Computing, 2018).
Lloyd, S. Least squares quantization in PCM. IEEE Trans. Inf. Theory 28, 129–137 (1982).
Tibshirani, R., Walther, G. & Hastie, T. Estimating the number of clusters in a data set via the gap statistic. J. R. Stat. Soc. B 63, 411–423 (2001).
Maechler, M. et al. Cluster: Cluster analysis basics and extensions. R package version 2.1.0 (2019).
Young, J. D. INCA: a computational platform for isotopically non-stationary metabolic flux analysis. Bioinformatics 30, 1333–1335 (2014).
Antoniewicz, M. R., Kelleher, J. K. & Stephanopoulos, G. Elementary metabolite units (EMU): a novel framework for modeling isotopic distributions. Metab. Eng. 9, 68–86 (2007).
Antoniewicz, M. R., Kelleher, J. K. & Stephanopoulos, G. Determination of confidence intervals of metabolic fluxes estimated from stable isotope measurements. Metab. Eng. 8, 324–337 (2006).
Wang, H.-W. et al. The soybean Dof-type transcription factor genes, GmDof4 and GmDof11, enhance lipid content in the seeds of transgenic Arabidopsis plants. Plant J. 52, 716–729 (2007).
Acknowledgements
We thank the Nano-Center at the Hebrew University of Jerusalem for designing and printing the labelling mixer and the MPI-MP technical workshop for constructing infrastructure for the tubing system. H.T. thanks the Human Frontiers Science programme for the financial support. Z.N. and A.K. acknowledge support from the Human Frontiers Science Program, grant no. RGP0046/2018. Graphics for Extended Data Fig. 1 was performed by DC-Sci-Art.
Funding
Open access funding provided by Max Planck Society.
Author information
Authors and Affiliations
Contributions
H.T. and M.S. designed the research. H.T., A.K., S.A, H.I, A.E. and M.H. performed research. H.T., A.K., J.S., A.E., S.A., T.A.M, I.H., J.K. and Z.N. analysed data. H.T., Z.N. and M.S. wrote the article.
Corresponding author
Ethics declarations
Competing interests
The authors declare no competing interests.
Additional information
Peer review information Nature Plants thanks Martin Hagemann, John Morgan and the other, anonymous, reviewer(s) for their contribution to the peer review of this work.
Publisher’s note Springer Nature remains neutral with regard to jurisdictional claims in published maps and institutional affiliations.
Extended data
Extended Data Fig. 1 Rapid algal labeling system scheme.
(a) Fresh medium bubbled with 13CO2-based synthetic air mixture (see methods) was mixed with fresh algal sample withdrawn from the bioreactor under controlled LED illumination. Solutions were rapidly (<1 s) mixed in a tailor-made transparent chip (b), and injected through transparent tubing into 70% methanol solution kept at -70oC. Pulse length (5–40 s) was controlled via length of the sizable tubing.
Extended Data Fig. 2 Overview of 13C labeling kinetics by k- means clustering for 0- 40 s.
Grey lines show mean 13C enrichment for individual metabolites quantified by LC- MS/MS (n=3 biologically independent experiments) and black lines show average 13C enrichment of all metabolites in the cluster. Note that enrichment of inorganic C in the algal suspension was 50% in this experiment (see Methods).
Extended Data Fig. 3 Overview of 13C labeling kinetics by k- means clustering for 0- 300 min.
Grey lines show mean 13C enrichment for individual metabolites quantified by GC- MS (n=3 biologically independent experiments) and black lines show average 13C enrichment of all metabolites in the cluster. Maltose is highlighted in blue.
Extended Data Fig. 4 Kinetics of 13C labeling in starch.
13C enrichment (a) and total starch content (b) in digested starch analysed by LC–MS/MS from all three algae in LL and C. ohadii in EIL; Data are mean ± SD (n=3 biologically independent experiments). For inter-algal comparisons, slopes for each alga were compared to C. ohadii at LL (paired two-tailed t-test; *, P = 6xE-3; **, P =4xE-4).
Extended Data Fig. 5 Labeling of protein during pulses of 13CO2.
(a) Total protein levels per unit DW. Protein pools were extracted from remaining pellets of the MTBE metabolite extractions for time points 15–300 min, determined by the Bradford assay, and divided by DW per sample. Data are mean ± SD of all time points per alga (n=3 biologically independent experiments). For inter-algal comparisons, all algae in LL were pairwise compared (paired two-tailed t- test;*, P= 2.2xE-5; **, P =6.1xE-7). (b) Protein synthesis rates (PSR, % h-1) calculated for glycine and aspartate (see Table S6) and plotted against growth rates (OD735 h-1) of the four algae and conditions. PSR were calculated from the labeling rates of protein-bound glycine or aspartate analysed by GC–MS, divided by time interval (120-300 min) and the mean enrichment (%) of their free form (see [58]). Cr = C. reinhardtii, Cs = C. sorokiniana, Co = C. ohadii.
Extended Data Fig. 6 Lipid synthesis.
(a) m0 decay curves for membrane lipids in all algae and conditions. The m0 peak areas for all labelled PE, MGDG and DGDG species were summed for each of the algae and conditions for each 13CO2 pulse time point. Data are mean ± 95% confidence intervals (n=3 biologically independent replicates). (b) m0 decay curves for TAG in C. ohadii and C. ohadii EIL. The m0 peak areas for all labelled TAG were summed for each of the algae and conditions for each 13CO2 pulse time point and are presented here for C. ohadii under LL and EIL to illustrate the large difference between the light treatments. Data are mean ± 95% confidence intervals (n=3 biologically independent replicates). Data for panels (a) and (c) were generated from the experiments used for GC–MS, starch and protein analyses in Figures 3, 5, Extended Data Fig. 3, and Tables 1,2 and Supplementary Table 3–6. Estimated rates of lipid synthesis and associated fluxes. For algae, the total lipid synthesis rate was estimated from the DW increase over time (Supplementary Figure 7) and the lipid fraction of DW (Table 1). The calculation assumes that lipid content is approximately constant during growth of cultures up to the time of sampling, and that there is negligible turnover of lipids. Qualitative support for the estimated rates of total lipid synthesis rates is provided by the rate of decay of the m0 isotopomers of membrane lipids (derived slopes from panel a) and TAG (derived slopes from panel b and not shown). For Arabidopsis, total lipid synthesis was estimated based on relative growth rate of the rosette [49] and leaf lipid fraction per DW [50]. FA synthesis rates in algae and Arabidopsis are estimated from total lipid synthesis rates using the simplifying assumption that all FA are C18:0 species. FA synthesis rate in Arabidopsis was also estimated to provide qualitative support using the following assumptions: lipid accumulation rate corresponds to 6% of total C fixation (Table 2) in 14C-labeling experiments in Arabidopsis leaves [51], and (based on C18:0 FA species) 0.6 nmol FA g-1 DW s-1, which is about 2-fold higher than estimated by the first method, but still much lower than the estimated flux to FA in algae. Demand for Gly3P and Acetyl- CoA are calculated based on 3:1 and 1:9 ratio of Gly3P and Acetyl-CoA to FA, respectively. NADPH demand in lipid synthesis is calculated assuming net consumption of 1 NADPH per Gly3P synthesized by reduction of DHAP plus net consumption of 2 NADPH per Acetyl-CoA added. The minimum (Min) 13C assimilation rate is taken from Table 2 (includes 13C assimilation between 0 and 40 sec into water- soluble intermediates detected by LC–MS/MS) was corrected (Corrected min) by adding on the estimated flux of C to FA. These corrected estimates are about 20, 50, and 40% lower than the rate of O2 evolution (taken from Table 2). in C. reinhardtii, C. sorokiniana, C. ohadii in LL but about 75% lower in C. ohadii in EIL. Much of the remaining discrepancy can be explained by NADPH consumption in lipid synthesis, except for C. ohadii in EIL.
Supplementary information
Supplementary Information
Supplementary text, Tables 3, 6 and 7 and Figs. 1–11.
Supplementary Tables
Supplementary Tables 1, 2, 4, 5 and 8.
Supplementary Table 9
INST- MFA parameters.
Supplementary Data 1
Enolase sequence alignment from algae and plants.
Supplementary Data 2
TPT sequence alignment from algae and plants.
Supplementary Data 3
PEPC1 sequence alignment from algae and plants.
Supplementary Data 4
PEPC4 sequence alignment from algae and plants.
Supplementary Data 5
PDH_E1 sequence alignment from algae and plants.
Supplementary Data 6
PDH kinase mitochondrial sequence alignment from algae and plants.
Supplementary Data 7
PDH kinase sequence alignment from algae and plants.
Rights and permissions
Open Access This article is licensed under a Creative Commons Attribution 4.0 International License, which permits use, sharing, adaptation, distribution and reproduction in any medium or format, as long as you give appropriate credit to the original author(s) and the source, provide a link to the Creative Commons license, and indicate if changes were made. The images or other third party material in this article are included in the article’s Creative Commons license, unless indicated otherwise in a credit line to the material. If material is not included in the article’s Creative Commons license and your intended use is not permitted by statutory regulation or exceeds the permitted use, you will need to obtain permission directly from the copyright holder. To view a copy of this license, visit http://creativecommons.org/licenses/by/4.0/.
About this article

Cite this article
Treves, H., Küken, A., Arrivault, S. et al. Carbon flux through photosynthesis and central carbon metabolism show distinct patterns between algae, C3 and C4 plants. Nat. Plants 8, 78–91 (2022). https://doi.org/10.1038/s41477-021-01042-5
Received:
Accepted:
Published:
Issue Date:
DOI: https://doi.org/10.1038/s41477-021-01042-5
This article is cited by
-
SIMPEL: using stable isotopes to elucidate dynamics of context specific metabolism
Communications Biology (2024)
-
Proteomics and constraint-based modelling reveal enzyme kinetic properties of Chlamydomonas reinhardtii on a genome scale
Nature Communications (2023)
-
Integrated flux and pool size analysis in plant central metabolism reveals unique roles of glycine and serine during photorespiration
Nature Plants (2022)
