
Abstract
Background/objectives
Optical coherence tomography angiography (OCT-A) allows non-invasive imaging of chorio-retinal vasculature, and is a potential alternative to fluorescein angiography (FA). Sensitivity and specificity of OCT-A for detecting choroidal neovascularisation (CNV) in treatment-naïve neovascular age-related macular degeneration (nAMD) patients is examined, using the Heidelberg Spectralis in a ‘real world’ setting.
Subject/methods
Overall, 43 eyes from 26 patients were included in the study. Spectral domain OCT (SD-OCT), OCT-A and FA images were obtained at baseline. Each of the three retinal image modalities was systematically assessed by three masked clinicians. Decisions about the presence/absence of CNV were recorded using an automated segmentation for OCT-A, a manual method, and using both OCT-A and SD-OCT in conjunction. Additional information about the presence of sub-retinal hyper-reflective material (SHRM) and the ‘double layer sign’ (DLS) were recorded.
Results
The average sensitivity and specificity of the OCT-A for the detection of CNV in treatment naïve AMD was 89% and 87% for the combined SD-OCT and OCT-A, 76% and 91% for the automated segmentation and 84% and 85% for the manual segmentation, respectively. Inter-clinician agreement was 0.59–65 kappa. In patients without CNV, SHRM was present in only 6% while DLS was present in 28%. Sensitivity and specificity was >78% for both SHRM and DLS.
Conclusions
OCT-A provides a reliable tool for detecting CNV in treatment naïve nAMD patients, with high sensitivity and specificity. Combined use of SD-OCT images and SHRM as an additional bio-marker, OCT-A could become an alternative to FA in routine clinical practice.
Introduction
Age-related macular degeneration (AMD) is one of the leading causes of blindness worldwide [1], and is a major burden on clinical resources [2]. The neovascular form of AMD (nAMD) is characterised by the presence of abnormal blood vessels, usually (but not always) originating in the choroid. Fundus fluorescein angiography (FA) is considered the “gold standard” diagnostic test for identifying choroidal neovascularisation (CNV) in nAMD, but this is an invasive procedure requiring an intravenous injection of fluorescein (and/or indocyanine green “ICG”) dye. The results are two-dimensional snapshots of retinal/choroidal circulation. Both FA and ICG are labour intensive and carry a potential risk of side effects including transient nausea, vomiting and anaphylaxis [3, 4]. Often the results are suboptimal due to patient and/or technological factors and limited to “en face” view. Full thickness resolution can also be limited further by the leakage of dye obscuring details [5].
Surrogate markers for nAMD (and the management thereof) have been described using optical coherence tomography (OCT) [6]. Two such markers are the ‘double layer sign’ (DLS) [7] and ‘sub-retinal hyper-reflective retinal material’ (SHRM) [8, 9]. When examining OCT scans, the DLS has proven useful in signposting the presence of branching vascular networks across a spectrum of pachychoroid disease [7, 10, 11], but its clinical usefulness in other subtypes of nAMD is not fully reported.
OCT uses near-infrared light interference patterns between the light which is reflected back from the chorio-retinal tissue and that of a reference beam. This allows high resolution, three-dimensional imaging of chorio-retinal tissue [12], although it cannot supply information pertaining to chorio-retinal circulation, such as flow. OCT-Angiography (OCT-A) provides a non-invasive, faster alternative to FA that can be performed alongside traditional OCT imaging. It allows three-dimensional maps of the chorio-retinal blood flow, which are generated by deducing a motion signal from fast, sequential OCT B-scans of the retina and choroid. Its clinical application in the diagnosis of nAMD and identification of CNV has been described [13,14,15,16]. Whilst several studies have looked at the sensitivity and specificity of OCT-A for CNV detection for a range of macular pathologies [17,18,19,20] and previously treated patients [19, 21,22,23], only one has focused on CNV detection in treatment naïve nAMD patients, reporting sensitivity values ranging from 81 to 100%, and specificity values ranging from 93 to 100% [24].
This paper reports the sensitivity and specificity of the Heidelberg Spectralis® OCT-A (Heidelberg Engineering, Germany) for the identification of CNV, in a randomly selected cohort of treatment naive patients with nAMD. All imaging was performed as part of routine clinical practice, and analysis completed using the standard Heidelberg OCT-A software (Heidelberg Eye Explorer, HEYEX version 1.9.14.0) by three clinicians experienced in the management of nAMD and assessment of OCT and OCT-A images. We additionally comment on the sensitivity and specificity of both DLS and SHRM in identifying the presence of CNV in treatment naïve nAMD patients.
Methods
Patient cohort
Electronic medical records and retinal images for all treatment naive, new patients referred to the Bradford Macula Centre with suspected nAMD, over a randomly selected period of 6 months (April 2018 and October 2018), were identified for retrospective analysis. Patient records were viewed using Medisoft Ltd (Leeds, UK) by an independent clinician who confirmed that they did not have other (non-AMD) retinal pathology. overall, 15 patients were excluded due to no FA being performed at baseline. A further two patients were excluded for having poor quality OCT-A images due to excessive motion artefact. Overall, 43 eyes from 26 patients were included in the study.
Image acquisition
All OCT and OCT-A images for the study were obtained on the Heidelberg Spectralis HRA + OCT tomography machines with the OCT-A Module version 6.7 and Viewing Module version 6.7 or higher. For all patients, Spectral Domain OCT scans (SD-OCT) were obtained for both eyes, and OCT-A scans obtained for one or both eyes (at the discretion of the treating clinician) at the baseline visit. In all cases, OCT-A images of the eye with suspected nAMD were available for the study. The SD-OCT images comprised of 25 B-scans forming a 6.1 × 6.1 mm volume scan (20° × 20°). For the OCT-A scans, 512 B-scans were used to obtain a 3.1 × 3.1 mm OCT-A volume scan (10° × 10°). ART mode was also switched on, which meant that a minimum of five B-scans were averaged at each scan location to enhance the image quality (i.e. by reducing artefacts due to noise/movement). For both SD-OCT and OCT-A the Heidelberg Spectralis system also had TruTrack Active Eye Tracking technology enabled, which tracks the position of the eye during scanning to reduce motion artefact or blinks.
Patients also underwent FA with the Heidelberg Spectralis at their baseline visit (n = 33) or within 4 weeks prior to their attendance (n = 9). FA images were obtained for a central 30° field. In one patient the FA was completed 1 week after the OCT images but prior to treatment.
Image grading and analysis
Three clinicians, including a specialist optometrist, retinal fellow, and consultant ophthalmologist with 2, 6, and >20 years’ medical retina experience, respectively, volunteered as assessors for the study. Before analysis commenced, the clinicians were provided with a refresher in assessing OCT-A images. Each clinician was then independently presented with each patient’s images (OCT-A and SD-OCT) in a masked fashion (i.e. clinicians were masked to the diagnosis, laterality, FA results and clinical details of patients, and were only advised that the patients were all treatment naïve, new patients referred for suspected nAMD).
The protocol for grading each image was aligned as closely as possible to ‘real-world’ practice, using the standard Heidelberg Eye Explorer (HEYEX) software (v. 1.9.14.0) with the OCT-A module installed. The grading protocol followed a three-step process, and is outlined below. At each successive step clinicians were asked to decide if CNV was present (yes/no), and record their response. Clinicians were asked to:
-
(1)
Use the built in ‘avascular complex’ automated slab tool, which provides segmentation between the outer photoreceptor layer and Bruch’s membrane (see Fig. 1, black star). Any ‘abnormal’ vasculature between these retinal layers could be visualised using the ‘transverse OCT-A’ window of the software (see Fig. 1, upper right display screen).
Fig. 1: Showing the Heidelberg software open on the OCT-Angiography tab. 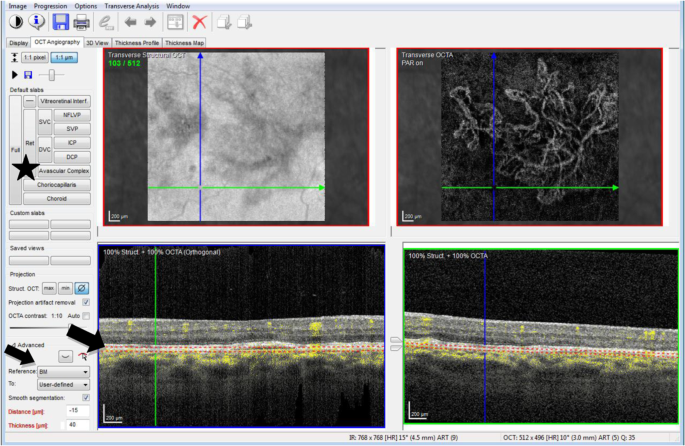
The ‘Avascular Complex’ automated slab is highlighted by the black asterisk (left), the manual slab of 40 μm thickness is highlighted by the black arrows (left), and the ‘transverse OCT-A’ view is seen in the upper right display window.
-
(2)
Manually scroll through the OCT-A image by selecting a ‘user defined’ slab of initially 40 μm thickness, and then 100 μm thickness from Bruch’s membrane, dragging the slab above (into the avascular zone) and below (into the inner choroid) Bruch’s membrane (see Fig. 1, black arrow). Any abnormal vasculature could be visualised in the transverse OCT-A window.
-
(3)
Review the SD-OCT images in combination with the OCT-A (automated and manual), and decide on the presence / absence of CNV in the area identified as a potential lesion site on the SD-OCT scans (Fig. 2). In addition, record further information on two specific SD-OCT features: (i) the presence/absence of a DLS (white arrow Fig. 2) and (ii) presence/absence of SHRM (black arrow Fig. 2). For the purposes of this study, and in accordance to previous literature, DLS is identified as the presence of a distinct thin hyper-reflective line under the raised RPE [7] and SHRM was hyper-reflective material located external to the retina, and internal to the retinal pigment epithelium [8].
Fig. 2 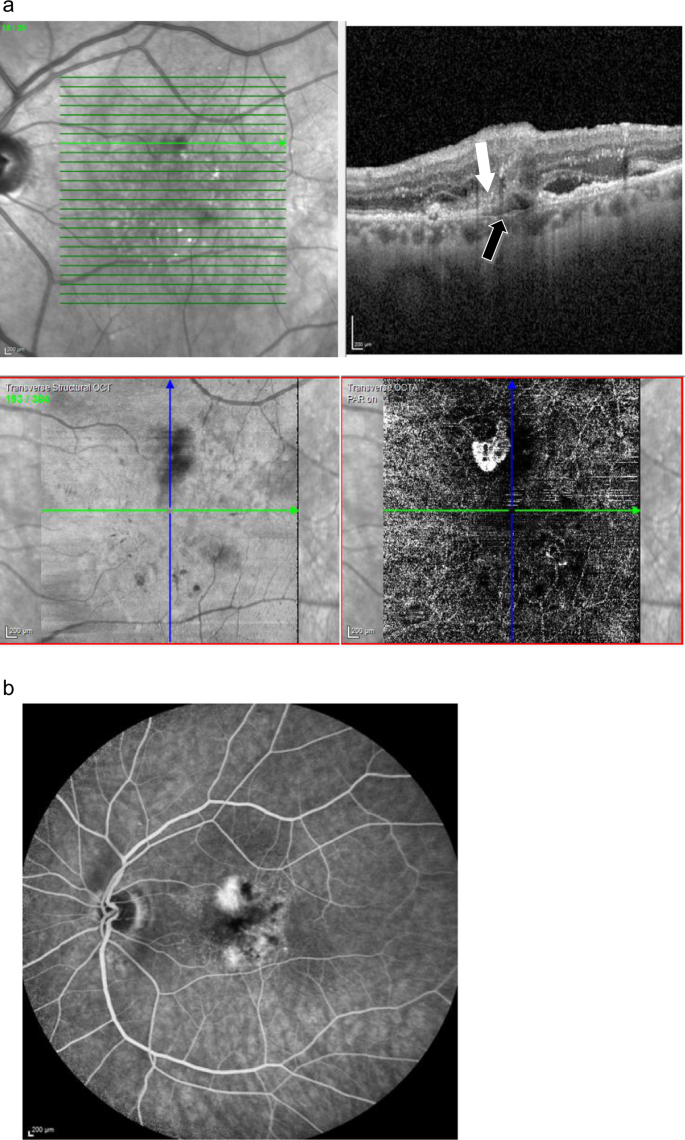
A case with active CNV: (a) SD-OCT slice (upper left and centre) with double layer sign (black arrow) and SHRM (white arrow) an en face OCT-A segmentation (lower left and centre) with active flow signal; and corresponding fluorescein angiography (b) -all recorded at baseline.


After all of the SD-OCT and OCT-A images had been graded, the ‘gold standard’ FA results were assessed for the presence or absence of CNV by one clinician (FG), and these findings cross checked with the electronic clinical records for each patient. The sensitivity and specificity for diagnosing CNV using OCT-A were then calculated based on the ‘gold standard’ FA results.
Statistical analysis
To obtain group data for analysis, any disagreements between the three clinicians were resolved through a majority decision. This was applied at each step of the grading. The level of agreement between the clinicians was determined using a free-marginal multi-rater kappa statistic [25], which is appropriate for more than two observers and does not assume that a certain number of responses had to be assigned to each decision category. Kappa values may range from −1 to 1, with value of 0 indicating responses equal to chance, values of −1 being perfect disagreement below chance, and values of 1 indicating perfect agreement between observers.
Sensitivity and specificity results were then obtained using the following formulae:
Sensitivity: TP/(TP + FN)
Specificity: TN/(TN + FP),
where TP = number of true positives, FN = number of false negatives, TN = number of true negatives and FP = number of false positives.
Results
From the total patient cohort (43 eyes), 65% of patients were female and the mean age of the patients was 80.2 years. Overall, 18 eyes had no evidence of CNV while 25 (58%) eyes had active CNV confirmed on FA. There were eight (32%) occult, five (20%) classic, six (24%) minimally classic, one (4%) predominantly classic CNVs and five (20%) retinal angiomatous proliferation (RAP) lesions, only three of the five (60%) RAP could be identified on OCT-A.
Overall, combined for all the 3 clinicians, the pooled sensitivity and specificity values of OCT-A were 84% and 100%, respectively, for the automated segmentation, 92% and 94% for the manual segmentation and 88% and 94% for the combined SD-OCT and OCT-A (see Table 1). Thus, the average sensitivity for OCT-A was 88% with specificity of 96% for detecting a CNV in treatment naïve AMD patients.
For individual clinicians the sensitivity and specificity were best for the combined SD-OCT and OCT-A grading (88–92% and 78–94%, respectively), compared to automated segmentation (sensitivity 64–88% and specificity 83–100%) and manual segmentation (sensitivity 76–92% and specificity 78–94%). The average sensitivity and specificity were 89% and 87% for the combined SD-OCT and OCT-A, 76% and 91% for the automated segmentation and 84% and 85% for the manual segmentation, respectively.
A DLS was identified in 28 (65%) of the 43 eyes. From the group data, the sensitivity and specificity of DLS alone for detecting the presence of CNV were 96% and 78%, respectively, when compared with the FA findings. SHRM was identified in 24 (55%) of the 43 eyes, with a sensitivity and specificity of 92% and 94%, respectively, for detecting the presence of CNV.
The disagreement level between clinicians, in which a majority ruling was required, was ~30% across all stages of OCT image grading. Kappa statistics were calculated to give the level of inter-clinician agreement for the OCT-A and SD-OCT image grading, and these k values ranged from 0.50 to 0.65 (see Table 2). Agreement for OCT-A image analysis alone gave k values that ranged from 0.59 to 0.65.
Discussion
The present study examined the sensitivity and specificity of OCT-A in the detection of CNV in nAMD patients. The image acquisition and analysis were performed using the Heidelberg Spectralis hardware with OCT-A module (version 6.7) and software (v. 1.9.14.0), using the standard tools and settings included in the HEYEX software in real-world practice. The results are therefore applicable to current clinical practice for macular degeneration without the need for specialist custom settings or additional post-processing (e.g. manual adjustment of retinal segmentation) which have been used in some previous studies reporting sensitivity and specificity [17, 22, 24].
The sensitivity and specificity of OCT-A for the detection of CNV were consistently above 80%, with the auto-segmentation giving the lowest sensitivity at 84% and manual segmentation the highest at 92%. The higher sensitivity with manual segmentation is likely due to dynamic analysis of the OCT-A images in a truly three-dimensional manner, and the fact that auto-segmentation is marred by errors in depicting the retinal layers. The values reported here are slightly higher than those recently reported by a study examining the Heidelberg Spectralis OCT-A prototype device, who found sensitivity and specificity values of 71% and 81%, respectively [20]. These differences likely result from the mixture of CNV-causing macular pathologies included in the Soomro and Talks study, and the use of a prototype device which may have been less accurate (e.g. the volume scan contained 131–261 B-scans compared with 512 B-scans in the present study).
The present results are in keeping with those reported by Faridi et al. [24], who specifically studied AMD patients and found sensitivity values ranging from 81 to 100%, and specificity values ranging from 93 to 100% with the Optovue RTVue-XR Avanti system. However, it needs to be noted that the values reported by Faridi et al. may not be reliable as the non-nAMD controls (including a cohort of dry AMD patients, n = 40) did not undergo FA to rule out the presence of CNV.
The manual segmentation was slightly more sensitive (92%) at detecting CNV using the Heidelberg Spectralis, but the automated segmentation tool gave the highest specificity (100%). This implies that in clinical practice, it would be advantageous to use both the automatic segmentation followed by manual segmentation methods when viewing OCT-A images. It also suggests that if no lesion can be found using automated segmentation, it is highly likely that a CNV is not present.
In contrast to previous reports [19], in the present study, the addition of SD-OCT images had marginal impact on the sensitivity and specificity of OCT-A. This may be due to the use of a different OCT-A platform and/or patient population. However, SD-OCT images remain extremely useful when building up a clinical picture for a given patient, and therefore viewing these images is still recommended when looking for pathological changes to the retina. For example, a false positive finding from OCT-A interpretation alone was correctly identified as a true negative when the SD-OCT images were viewed, as a region of macular atrophy could be visualised over the suspected CNV (a ‘window defect’) highlighting normal choroidal vasculature visible on the OCT-A image. Furthermore, the addition of SD-OCT images helped improve the sensitivity of individual clinician, and therefore can provide a useful adjunctive strategy when clinicians work independently. It is also important to note that whilst OCT-A alone can identify the presence of CNV, it cannot give information about exudation (e.g. intraretinal and/or sub-retinal fluid) and hence disease activity. Certainly, its use in the detection of treatment naïve quiescent CNV has been documented [26], suggesting that SD-OCT images should still be viewed alongside OCT-A images to identify surrogate markers of active CNV.
Two of the five cases of RAP lesions (40%) as determined by FA were consistently graded as false negatives on OCT-A by all clinicians. Thus, the OCT-A technology (with or without SD-OCT) in its current status may not be ideal for identifying Type 3 CNV, in which the neovascular complex is typically small, and flow signals follow a vertical, columnar direction.
A potential limitation of the present study is that clinicians were not specifically instructed in the protocol to examine the cross-sectional flow signals to aid their decision making, which may have improved the detection of Type 3 CNV. A previous report in which a RAP lesion also accounted for a false negative result reported correct identification of the lesion when cross-sectional OCT-A flow signals could be used in conjunction with en face OCT-A [24]. This indicates that there may be a steep learning curve for the identification of RAP lesions (Type 3 CNV) on OCT-A.
A further two cases were graded as false negatives using the automated segmentation, both of which were identified as occult lesions using FA. This accounted for 14% of the Type 1 lesions included in the study. This highlights a potential disadvantage of the automated ‘avascular complex’ tool, which only allows visualisation of vasculature between the outer photoreceptor layer and Bruch’s membrane. As such, Type 1 lesions, which are found beneath Bruch’s membrane, can be missed using automated segmentation that looks just at the retinal avascular zone. Both cases were correctly graded as true positives with both the manual segmentation and the combined SD-OCT and OCT-A grading. Thus, manually scrolling through the OCT-A images both above and below Bruch’s membrane, as well as viewing the SD-OCT images, is a useful adjunct strategy. Clinicians can scroll through all of the retinal layers and into the choroid, and look for surrogate markers of active nAMD. By comparison, 100% of the Type 2 lesions included in the present study were correctly identified using the automated (and manual) OCT-A grading.
Of the OCT features, both the DLS and SHRM independently give good sensitivity and specificity for detecting the presence of nAMD. For the true negative cases, SHRM was noted in 6% of eyes who did not have CNV (as identified by FA), while DLS was present in around 28% of eyes with no CNV. This would suggest that SHRM is a more helpful clinical sign in determining the likelihood of CNV. Thus, the absence of CNV using the automated OCT-A segmentation tool in conjunction with an absence of SHRM provides clinicians with a good indication that CNV is not present. DLS has predominantly been studied in conjunction with pachychoroid spectrum of diseases [7, 10, 11]. However, a DLS was observed in 96% of the true positive nAMD cases in the present study, suggesting that it is a feature of several subtypes of the disease. This is in agreement with a recent study which found that DLS has good predictive value in identifying CNV in Type 1 nAMD [27]. Further investigation into the prevalence of DLS in different subtypes of nAMD, and the sensitivity and specificity for this individual feature in different subtypes is a suggested area for future study.
Levels of agreement between the three clinicians were calculated using a variant of Cohen’s Kappa statistic [28]. Agreement for grading the OCT-A images ranged from 0.59 to 0.65 (see Table 2). The results are similar to a previous report of inter-observer agreement by Inoue and colleagues [19], in which k was 0.69 for OCT-A alone and 0.66 for OCT-A combined with SD-OCT. However, it is slightly lower than a recent study of agreement between 17 clinicians, in which average k values ranged from 0.66 (ophthalmology trainees) to 0.81 (ophthalmology professors) [29]. This variation may be due to varying skill mixes in the aforementioned studies, not only in the interpretation of OCT-A images but also in general ophthalmology knowledge. Also, clinicians were not specifically instructed on how to grade images about which they were uncertain. This means that more conservative individuals who only answered ‘yes’ when they were certain about the presence of CNV may have missed some of the subtle cases, resulting in lower individual sensitivity but higher individual specificity values. In addition, each of the aforementioned studies used a slightly different calculation of kappa, making exact comparisons difficult. The present results are, however, similar to a previous report of the inter-observer agreement between 16 clinicians grading fluorescein angiograms for the presence of CNV, where the k value was 0.64 [30]. This firstly highlights that there is variability in the interpretation of FA for the presence of CNV, and secondly that the values reported in the current study are comparable to the ‘gold standard’ FA.
Our sample of clinicians was too small to statistically test whether the level of experience influenced individual sensitivity and specificity scores, but anecdotally it would appear that this was not the case. This suggests that the OCT-A technology is user friendly and with relevant training, it can be used diagnostically in routine practice irrespective of clinical background or expertise.
Limitations of this study include the use of a single technology platform (Heidelberg), a small number of investigators and small cohort of patients. A further limitation of the study is not including other biomarkers of nAMD, such as sub-retinal fibrosis or macular haemorrhage in analysis. As ~50% of treatment naïve nAMD patients may present with a haemorrhage at baseline [31], it is likely that retinal haemorrhage would have been present in some of the cohort. Since the presence of blood can block the passage of light from penetrating the deeper tissues, larger substantial haemorrhage can potentially obscure underlying CNV creating a higher number of false negatives. This has previously been reported to account for a large proportion (43–100%) of false negative cases in other studies [17, 22, 24, 32]. However, it should also be noted that large haemorrhages as well as fibrosis can obscure patterns of leakage on FA too, and therefore the presence of haemorrhage would be a limiting factor in both diagnostic investigations.
In conclusion, OCT-A provides a reliable tool for identifying CNV at baseline in treatment naïve nAMD cases, with high sensitivity and specificity. Combining SD-OCT with OCT-A is useful in guiding a decision outcome, especially with use of SHRM as an additional surrogate marker. Further refinement of the technology may help improve reliability of OCT-A, particularly via the automated segmentation. A recent unpublished survey of 233 patients with retinal disease who underwent OCT-A imaging found that 96.6% would be willing to have the test again and 92.3% found the test comfortable, suggesting that patient acceptability of OCT-A is very high [33]. Our masked study supports the use of OCT-A as a baseline investigation for suspected nAMD cases, and offers a potential replacement to FA in routine practice.
Summary
What was known before
-
Fluorescein angiography is the gold standard diagnostic test for conclusive detection of choroidal neovascular membranes (CNV) but this is invasive and time consuming, and runs the risk of side effects including anaphylaxis. Optical coherence tomography angiography (OCT-A) allows non-invasive imaging of chorio-retinal vasculature that can identify CNV in nAMD in experienced hands. OCT features, such as the double layer sign (DLS) and sub-retinal hyper-reflective material (SHRM) are observed in wet AMD.
What this study adds
-
OCT-A has high sensitivity and specificity for the detection of CNV in treatment naive nAMD patients in real-world practice. Practitioners with varying experience can reliably use OCT-A in diagnosis of nAMD using commercially available technology. The DLS and SHRM are useful biomarkers in a variety of nAMD subtypes beyond the pachychoroid spectrum of diseases.
References
Flaxman SR, Bourne RR, Resnikoff S, Ackland P, Braithwaite T, Cicinelli MV, et al. Global causes of blindness and distance vision impairment 1990–2020: a systematic review and meta-analysis. Lancet Glob Health. 2017;5:e1221–34.
Prenner JL, Halperin LS, Rycroft C, Hogue S, Liu ZW, Seibert R. Disease burden in the treatment of age-related macular degeneration: findings from a time-and-motion study. Am J Ophthalmol. 2015;160:725–31.
Bearelly S, Rao S, Fekrat S. Anaphylaxis following intravenous fluorescein angiography in a vitreoretinal clinic: report of 4 cases. Can J Ophthalmol. 2009;44:444–5.
Kwiterovich KA, Maguire MG, Murphy RP, Schachat AP, Bressler NM, Bressler SB, et al. Frequency of adverse systemic reactions after fluorescein angiography: results of a prospective study. Ophthalmology. 1991;98:1139–42.
Keane P, Sadda S. Imaging chorioretinal vascular disease. Eye. 2010;24:422–7.
Hee MR, Baumal CR, Puliafito CA, Duker JS, Reichel E, Wilkins JR, et al. Optical coherence tomography of age-related macular degeneration and choroidal neovascularization. Ophthalmology. 1996;103:1260–70.
Sato T, Kishi S, Watanabe G, Matsumoto H, Mukai R. Tomographic features of branching vascular networks in polypoidal choroidal vasculopathy. Retina. 2007;27:589–94.
Willoughby AS, Ying G-s, Toth CA, Maguire MG, Burns RE, Grunwald JE, et al. Subretinal hyperreflective material in the comparison of age-related macular degeneration treatments trials. Ophthalmology. 2015;122:1846–53.
Shah VP, Shah SA, Mrejen S, Freund KB. Subretinal hyperreflective exudation associated with neovascular age-related macular degeneration. Retina. 2014;34:1281–8.
Sheth J, Anantharaman G, Chandra S, Sivaprasad S. “Double-layer sign” on spectral domain optical coherence tomography in pachychoroid spectrum disease. Indian J Ophthalmol. 2018;66:1796–801.
Martin JMS, Rodman J, Pizzimenti JJ, Duchnowski E. The “double-layer sign”: in vivo imaging of polypoidal choroidal vasculopathy. Optom Vis Sci. 2013;90:e293–300.
Drexler W, Morgner U, Ghanta RK, Kärtner FX, Schuman JS, Fujimoto JG. Ultrahigh-resolution ophthalmic optical coherence tomography. Nat Med. 2001;7:502–7.
Farecki M-L, Gutfleisch M, Faatz H, Rothaus K, Heimes B, Spital G, et al. Characteristics of type 1 and 2 CNV in exudative AMD in OCT-Angiography. Graefe’s Arch Clin Exp Ophthalmol. 2017;255:913–21.
Shaimov T, Panova I, Shaimov R, Shaimova V, Shaimova T, Fomin A. Optical coherence tomography angiography in the diagnosis of neovascular age-related macular degeneration. Vestn oftalmol. 2015;131:4–13.
Coscas GJ, Lupidi M, Coscas F, Cagini C, Souied EH. Optical coherence tomography angiography versus traditional multimodal imaging in assessing the activity of exudative age-related macular degeneration: a new diagnostic challenge. Retina. 2015;35:2219–28.
Jia Y, Bailey ST, Wilson DJ, Tan O, Klein ML, Flaxel CJ, et al. Quantitative optical coherence tomography angiography of choroidal neovascularization in age-related macular degeneration. Ophthalmology. 2014;121:1435–44.
de Carlo TE, Bonini Filho MA, Chin AT, Adhi M, Ferrara D, Baumal CR, et al. Spectral-domain optical coherence tomography angiography of choroidal neovascularization. Ophthalmology. 2015;122:1228–38.
Moussa M, Leila M, Khalid H. Imaging choroidal neovascular membrane using en face swept-source optical coherence tomography angiography. Clin Ophthalmol. 2017;11:1859.
Inoue M, Balaratnasingam C, Freund KB. Optical coherence tomography angiography of polypoidal choroidal vasculopathy and polypoidal choroidal neovascularization. Retina. 2015;35:2265–74.
Soomro T, Talks J. The use of optical coherence tomography angiography for detecting choroidal neovascularization, compared to standard multimodal imaging. Eye. 2018;32:661–72.
Nikolopoulou E, Lorusso M, Micelli Ferrari L, Cicinelli MV, Bandello F, Querques G, et al. Optical coherence tomography angiography versus dye angiography in age-related macular degeneration: sensitivity and specificity analysis. BioMed Res. Int. 2018;2018:6724818.
Gong J, Yu S, Gong Y, Wang F, Sun X. The diagnostic accuracy of optical coherence tomography angiography for neovascular age-related macular degeneration: a comparison with fundus fluorescein angiography. J Ophthalmol. 2016;2016.
Liang MC, Talisa E, Baumal CR, Reichel E, Waheed NK, Duker JS, et al. Correlation of spectral domain optical coherence tomography angiography and clinical activity in neovascular age-related macular degeneration. Retina. 2016;36:2265–73.
Faridi A, Jia Y, Gao SS, Huang D, Bhavsar KV, Wilson DJ, et al. Sensitivity and specificity of OCT angiography to detect choroidal neovascularization. Ophthalmol Retin. 2017;1:294–303.
Randolph J. Free-marginal multirater kappa: an alternative to Fleiss’ fixed-marginal multirater kappa. In: Joensuu Learning and Instruction Symposium. Finland; 2005. https://eric.ed.gov/?id=ED490661.
Carnevali A, Cicinelli MV, Capuano V, Corvi F, Mazzaferro A, Querques L, et al. Optical coherence tomography angiography: a useful tool for diagnosis of treatment-naïve quiescent choroidal neovascularization. Am J Ophthalmol. 2016;169:189–98.
Shi Y, Motulsky EH, Goldhardt R, Zohar Y, Thulliez M, Feuer W, et al. Predictive value of the OCT double-layer sign for identifying subclinical neovascularization in age-related macular degeneration. Ophthalmol Retina 2019;3:211–9.
Cohen J. A coefficient of agreement for nominal scales. Educ Psychological Meas. 1960;20:37–46.
Souedan V, Souied EH, Caillaux V, Miere A, El Ameen A, Blanco-Garavito R. Sensitivity and specificity of optical coherence tomography angiography (OCT-A) for detection of choroidal neovascularization in real-life practice and varying retinal expertise level. Int Ophthalmol. 2018;38:1051–60.
Holz FG, Amoaku W, Donate J, Guymer RH, Kellner U, Schlingemann RO, et al. Safety and efficacy of a flexible dosing regimen of ranibizumab in neovascular age-related macular degeneration: The SUSTAIN Study. Ophthalmology. 2011;118:663–71.
Fulcher C, Hazel CA, Pacey I, Ali H, Ghanchi FD. Predicting visual outcomes in patients treated with aflibercept for neovascular age-related macular degeneration: data from a real-world clinical setting. Eur J Ophthalmol. 2019. https://doi.org/10.1177/1120672119839299.
Sayed SA, Ziada HEA, Mohammad MS. Assessment of wet age-related macular degeneration by optical coherence tomography angiography. The Egyptian. J Hospital Med. 2018;73:7551–6.
Ghanchi F, Fulcher C, Sivaprasad S, Balaskas K, Gale RP, De Salvo G, et al.. Acceptability of OCT angiography: a multicentre OCT Angiography NEtwork (OCTANE) study. Investig Ophthalmol Vis Sci. 2019;60:3477.
Acknowledgements
S Moss for helping to identify patients to be included in the present study.
Author information
Authors and Affiliations
Corresponding author
Ethics declarations
Conflict of interest
FDG received a lecture fee from Heidelberg Ltd. CF, ZM and FM—none.
Additional information
Publisher’s note Springer Nature remains neutral with regard to jurisdictional claims in published maps and institutional affiliations.
Rights and permissions
About this article

Cite this article
Ghanchi, F.D., Fulcher, C., Madanat, Z. et al. Optical coherence tomography angiography for identifying choroidal neovascular membranes: a masked study in clinical practice. Eye 35, 134–141 (2021). https://doi.org/10.1038/s41433-020-01285-0
Received:
Revised:
Accepted:
Published:
Issue Date:
DOI: https://doi.org/10.1038/s41433-020-01285-0
