
Abstract
Extremely preterm infants are at risk for neurodevelopmental problems and the visual system is particularly vulnerable. However, development of visual function in preterm infants with little or no retinal or neurologic injury has not been well defined. This study compared development of visual function in preterm infants without severe retinopathy of prematurity (ROP), intraventricular hemorrhage (IVH) or periventricular leukomalacia (PVL) to that of term infants at 5–7 mo corrected age. Twenty-one very low birth weight (VLBW) preterm infants (24–32 wk gestational age, weighing < 1500 g), and 22 healthy term infants were tested at 5–7 mo corrected age. Infants with any IVH/PVL and > Stage II ROP or Plus disease were excluded. Contrast sensitivity, grating acuity, and vernier acuity were measured using swept-parameter visual evoked potentials. Thresholds and maximum amplitudes were compared between groups. VLBW and term infants showed no differences in sensitivity for contrast (67.5 versus 63.8), grating resolution (12.4 versus 12.5 cpd) or vernier acuity (1.2 versus 1.0 arcmin). However, the amplitudes for swept contrast (p < 0.03) and swept vernier offset (p < 0.04) stimuli were higher in VLBW infants. Visual thresholds in VLBW infants without serious retinal or neurologic abnormalities were not significantly different from those of term infants, suggesting that increased visual experience does not influence visual sensitivity. The higher amplitudes in VLBW infants, suggests that visual experience may affect responses to suprathreshold stimuli.
Main
Preterm infants are at higher risk for visual and other neurodevelopmental problems compared with infants born full-term (1–7). Those who are very low birth weight (VLBW ≤ 1500) are at particularly high risk due to an increased prevalence of retinopathy of prematurity (ROP) (2,5,6,8,9), intraventricular hemorrhage (IVH), and periventricular leukomalacia (PVL), among other complications (6,7,10–14). One area of the brain that is particularly vulnerable during the prenatal and neonatal period is the primary visual pathway (from the retina to the visual cortex) because it undergoes significant development during this time (15–19) and therefore may be vulnerable to disruption by perinatal events. Several studies have shown an increased incidence of visual impairment with ROP (1,3,20,21) and with periventricular leukomalacia or hemorrhagic lesions (10–13). A number of studies have also demonstrated the co-existence of visual impairment in preterm infants with other neurologic deficits (4,6,14).
One issue that has not been adequately addressed has been whether visual problems in premature infants result solely from the effects of morbidity (e.g. ROP, IVH or PVL), or whether premature exposure to the visual world in itself may influence visual functioning. Studies using behavioral techniques have shown either no trend (22), a trend toward rapid development (23), or reduced acuity with preterm birth (24–26), while those employing electrophysiological techniques have shown either no trend (27) or a trend toward a more rapid maturation in preterm infants (28–31). However, research on this question is inconclusive because these studies have not excluded infants with ROP or cerebral lesions and have typically included a wide range of gestational ages from 26–36 wk. No study, to our knowledge, has examined visual functioning in a group of VLBW infants excluding for detectable cerebral abnormalities and significant ROP. Only by testing such a group can the effects of premature visual exposure alone be investigated.
Most previous studies have relied on a single measure to assess functioning of the entire visual system. If the effects of prematurity on visual pathway development are selective, as has been suggested (31,32), then a measure of a single visual function may fail to identify problems, or may not identify maximal differences. A more useful strategy would be to evaluate a number of different visual functions.
In the present study we assessed visual functioning in VLBW infants using the sweep visual evoked potential (sVEP) technique. This technique offers a quantitative electrophysiological method to assess the response to different types of visual stimuli by determining a sensory threshold (i.e., the smallest stimulus that produces a cortical visual response) as well as response amplitudes (i.e., the strength of the response) to suprathreshold stimuli (33). Visual thresholds are sensitive measures of visual function and may provide independent information relative to suprathreshold measures such as the response amplitude to a clearly visual stimulus. The three different visual thresholds that were measured by this technique were contrast sensitivity, grating acuity and vernier acuity, each of which has different rates of development and has been studied extensively (34,35). Contrast sensitivity measures the ability to detect slight changes in luminance across space. It is the first of the three functions to mature, with sensitivity being half that of adult sensitivity by three months of age (34,36). Grating acuity is a test of spatial resolution, and measures the finest grating that can be resolved. Grating acuity thresholds reach half of adult values by eight months of age (37). Vernier acuity measures the minimum offset that can be detected between two line segments. Vernier acuity as measured by the sVEP is relatively poor during the first year of life (35). Behavioral and sVEP methods have shown that vernier thresholds reach approximately half of adult values by five years of age (38,39). Vernier acuity, since it requires recognition of spatial relationships, is believed to require a greater degree of cortical processing, and be a more meaningful indicator of higher-order visual cognitive function than other visual functions (35).
The goal of this study was to determine whether premature birth itself, in the absence of significant retinal or cerebral pathology, contributes significantly to alterations in visual development either by accelerating or delaying development.
METHODS
Participants.
Twenty-one VLBW and 22 term control infants were each tested between five and seven months corrected age. Information regarding birth weight and gestation for the VLBW group was obtained from the medical record. Infants included in the VLBW group were 24–32 wk gestation, and weighed less than 1500 g (mean ± SD, 1102 ± 218.5g). The mean post-conceptional age of VLBW infants was 63.5 ± 4.3 wk (mean ± SD) and mean chronologic age was 34.9 ± 4.8 wk. Gestational age was assessed by the best obstetrical estimate using the last menstrual period and ultrasound examination. Mean chronologic age of the term infants was 26.9 ± 5.6 wk (67 wk post-conceptual age). Term infants were either self-referred by parents interested in participating or referred by pediatricians aware of the study. Data regarding the highest degree of ROP was recorded by the ophthalmologist, and IVH or PVL was determined by a head ultrasound examination, as recorded in the medical record. Inclusion criteria for VLBW infants included ≤ than Stage II ROP, no Plus disease and no IVH or PVL. Of the four study infants who had ROP, three had Stage I and one had Stage II. Term infants were assumed to be appropriate for gestational age based on information regarding date of birth and neonatal course obtained from parents.
The Institutional Review Board for human subject research at Stanford University approved the study. Signed informed consent was obtained from the parents of the enrolled infants after explanation of the study procedures.
EEG recording.
The EEG (EEG) signal was amplified using a Grass© Model 12 amplifier (filter settings: 1–100 Hz at −6 dB) at a gain of 20,000. Active electrodes were placed over the infant's scalp at the occipital pole (location Oz, of the International 10-20 system) and at locations 3 cm to the left and right of Oz (O1 and O2) to record evoked potentials (40). A reference electrode was placed at Cz and a ground electrode was placed at Pz (50 and 30% of the inion-nasion distance at midline, respectively). Electrode impedance was equal to or less than 5 kΩ. Data acquisition and stimulus presentation were controlled using an in-house software system (37,41).
Stimulus presentation.
Stimuli were presented on a high-bandwidth monochrome monitor (MR2000HB-MED, Richardson Electronics) at a screen resolution of 1600 × 1200 pixels and a 60-Hz vertical refresh rate. The display was calibrated using a linear PIN-diode photometer with a photopic filter. The photo-diode was used to measure the luminance of a 5 × 5-cm2 region of the display monitor. The luminance of this region was incremented in 128 steps over the 256 available voltage levels of the video card. These values were used to correct the nonlinear voltage to luminance function in software. The contrast of each spatial frequency was not measured.
The effect of the monitor on high spatial frequencies is small with the display used. The monitor has a very high video bandwidth and patterns were displayed at 1600 × 1200 screen resolution. The slight reduction in contrast that occurs at the highest spatial frequencies would have affected both groups of infants and should not have affected the results reported, especially given the relative steepness of the high spatial frequency portion of the contrast sensitivity function. There is no attenuation at the low spatial frequencies used to measure contrast sensitivity or vernier acuity.
The nonlinear relationship between voltage and luminance was corrected in software. Mean luminance of the display was 102 cd/m2. A small toy, dangled 0–2 cm from the screen, directed the infant's attention to the monitor for the duration of the trials, each of which lasted 10 s. Viewing was binocular and the infants viewed the screen from 100 cm while seated in their parent's lap.
Contrast sensitivity was measured by presenting a phase-reversing, 2 cycles per degree (cpd) sine wave grating that was swept from 0.5–20% contrast over the 10-s trial. Grating acuity was measured with an 80% contrast that was swept from 2–16 cpd. Vernier acuity was measured using a 2 cpd, 80% contrast grating into which vernier displacements were periodically introduced and removed. The size of the vernier displacements was swept from 8 to 0.5 arc minutes. All stimuli were modulated at 3.76 Hz. A schematic illustration of the three sweep types is shown in Fig. 1.

Schematic diagrams of visual stimuli. The sweep VEP measures thresholds by varying or “sweeping” the stimulus parameter. To determine contrast sensitivity, grating acuity and vernier acuity, the contrast, spatial frequency and the line offset, respectively, were varied over 10-s intervals. Contrast was swept from 0.5–20%, spatial frequency was swept from 2–16 cpb and vernier offset was swept from 8–0.5 arc minutes.
Sweep VEP analysis.
The sweep VEP technique has been described in detail previously (37,42). Briefly, VEP response amplitude is measured as a stimulus parameter such as contrast, spatial frequency or vernier displacement is varied continuously over a range covering both below- and above-threshold values. The stimulus is presented at a given temporal frequency (3.76 Hz in this study), that drives visual cortical neurons at that frequency, and exact integer multiples of that frequency, as long as the stimulus is in the visible range. The visual response synchronized to the display is sampled with appropriately positioned leads, and the VEP amplitude versus stimulus intensity function is measured as the stimulus-driven response drops into the background EEG noise. In this study, sweeps were repeated several times (4–8) to increase the signal to noise ratio through averaging out the uncorrelated background EEG activity. Thresholds were estimated by extrapolating the suprathreshold portion of the response function to zero amplitude using linear regression as described below.
To measure the response functions, EEG recordings from the scalp for each 10-s trial were digitized and divided into 10 sequential epochs or “bins” of one-second duration. For each bin, a recursive, least-squares algorithm (41) was used to generate a series of complex-valued spectral coefficients representing the amplitude and phase of response components tuned to various multiples (harmonics) of the stimulus frequency. These spectral coefficients for each bin were averaged together across trials for each subject, channel, harmonic, and stimulus condition. Statistical significance for each bin was quantified using p-values derived from the circular T (T2 circ) statistic (43), which tests whether a given response amplitude is significantly different from zero taking into account both response amplitude and phase consistency across trials.
Threshold estimation.
The range of bins used for regression depended on the statistical significance and phase-consistency of the response across bins according to an algorithm adapted from Norcia et al. (37). Once the regression range was established, the threshold stimulus value was determined by extrapolating the regression line to zero response amplitude. Figure 2 shows the extrapolation of the second harmonic amplitude function to estimate a grating acuity threshold for an individual participant. The first harmonic (3.76 Hz) was used to estimate vernier thresholds because that harmonic has been shown to be specific for relative position (35,44) and the second harmonic (7.52 Hz) was used to estimate contrast sensitivity and grating acuity thresholds as the second harmonic is the dominant component of the reversal response.
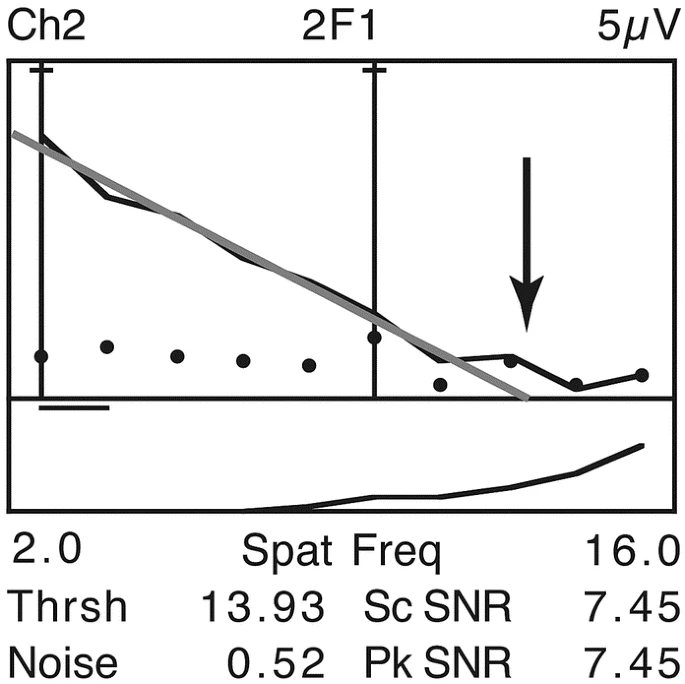
Measurement of visual threshold. Sweep VEP thresholds are determined by extrapolating the response function to zero amplitude via linear regression. The point where the (gray) line touches the abscissa is taken as the threshold. Here, a spatial frequency response function is used to estimate grating acuity for an individual infant. The dots indicate the background EEG levels measured simultaneously at frequencies that were 1 Hz above and 1 Hz below the response frequency of 7.6 Hz. The lower panel plots response phase. Thrsh, Threshold; Spat Freq, Spatial frequency; Pk SNR, the maximum signal-to-noise ratio in the record; Pk Sc SNR, the maximum signal-to-noise ratio in the range of values used to determine threshold. In this case, Peak Sc SNR and Peak SNR are the same.
Amplitude and phase analysis.
The amplitude for each one-second bin in the trial was averaged across subjects to calculate response functions for each group (Fig. 3). Finally, we also measured the response timing for each of the three measures by comparing the phases between the groups. We used the phase from the bin with the highest amplitude since this is the most statistically reliable datum. Phase differences were tested using the complex amplitudes (43).

Mean response functions for each of the three visual measures. Voltage vs. contrast functions (A) were measured by presenting a phase-reversing, 2 cycles per degree (cpd) sine wave grating that was swept from 0.5% (bin 1) to 20% contrast (bin 10) over the 10-s trial. Grating acuity (B) was measured with an 80% contrast grating that was swept from 2 to 16 cpd (bins 1 to 10, respectively). Vernier acuity (C) was measured using a 2-cpd, 80% contrast grating, with its lateral offset swept from 8–0.5 arc minutes (bins 1 to 10, respectively). Amplitudes were higher for the contrast and vernier offset sweeps in the preterm VLBW (•) group compared with term infants (▪).
Statistical analysis.
All threshold scores were converted to log values before conducting analyses. The mean threshold and amplitude values for each function measured were compared using the independent sample t-tests.
RESULTS
As shown in Table 1, thresholds for the three measures were remarkably similar between the two groups. There were no significant differences on any of the threshold measures. A power analysis indicated that, given our sample sizes and the SD of the measures, we should have been able to detect 10% or smaller differences in each of the thresholds, if these differences were present. To detect a threshold difference of 10% between premature and control infants for p = 0.05 and power 0.80 would require approximately 20 subjects for contrast sensitivity, 15 for grating, and 18 for vernier acuity. To detect a 25% difference would require 10 infants for contrast sensitivity, 6 for grating, and 9 for vernier acuities (also 80% power). This small sample size assumes that standard deviations were intermediate between those observed in controls and those observed in prematures.
A comparison of response phase (Table 2) showed no differences between the two groups.
We also compared the amplitude of the averaged response functions for the two groups (Fig. 3). Only those bins that were used to extrapolate thresholds (based on the average threshold for each group) were included in the analysis. Since thresholds were identical between the groups, the identical bins were compared. There was a significant difference in response amplitude between the groups for contrast sensitivity (p < 0.04) and vernier acuity (p < 0.02). In both cases the preterm group displayed higher amplitudes. Although the preterm group had higher amplitude in the grating acuity condition, this difference was not statistically significant.
DISCUSSION
The contrast sensitivity, grating acuity, and vernier acuity in this cohort of 5–7 mo adjusted age VLBW infants were comparable to that of term infants of similar age. These results suggest that premature birth in the absence of identifiable retinal or neurologic abnormalities does not have a detrimental effect on visual sensitivity at age 5–7 mo as indexed by threshold measures. Our results also demonstrate that earlier exposure to visual stimuli as occurs in preterm infants does not accelerate these abilities either, as has been suggested by pattern VEP studies with older preterm infants (30). Infants in the VLBW group had up to 16 wk of additional visual experience compared with the term group, and yet we found no evidence of improved thresholds.
Visual development as measured by thresholds appears to be regulated by a biologic clock, i.e., maturation of various visual functions is predetermined per a temporal schedule. Early exposure to visual stimuli experienced by these infants did not affect the threshold performance of the visual system. There remains the possibility that since the mean post-conceptional age of the term infants was 4 wk higher than that of the preterm infants, that the VLBW group would have performed better on all measures if the ages had been more similar. Another possible explanation for the results is that the cohort of preterm infants in the study may not have been as homogenous as assumed at the time of enrollment by virtue of having a normal head ultrasound and less than stage II ROP. Some of the infants may have had subtle neurologic damage that was undetected by the imaging modalities that were used.
Although thresholds were unaffected, preterm birth did affect the strength of the neuronal signal in the contrast and vernier displacement sweeps, with premature infants showing significantly higher amplitudes. There is a nonsignificant trend in the spatial frequency tuning function for higher amplitudes in the preterm group at the lowest spatial frequencies. The lowest spatial frequency in the spatial frequency sweep was also used for the contrast sensitivity and vernier acuity measurements. It is possible that the higher amplitudes of the preterm infants reflect accelerated visual cortical development of suprathreshold (low spatial frequency) mechanisms not responsible for the infants' thresholds. It may also be that the increased amplitudes reflect a hyperexcitability in the premature infants, possibly from an alteration of inhibitory neuron function in the visual cortex. Perhaps both accelerated cortical development and hyperexcitability are spatial frequency dependent. The visual pathway contains gamma aminobutyric acid (GABA) as its main inhibitory neurotransmitter and GABA plays a critical role in many neurodevelopmental processes (in addition to transmission) including the regulation of neuronal survival, dendrite and axonal maturation, and neuronal plasticity (44–46). Thus, disruptions in cortical development in visual cortex may be selectively affecting GABAergic neurons, resulting in a higher than normal neuronal signal. But again, if this is the case, it does not appear to directly affect infant thresholds.
In conclusion, we found that VLBW infants with no IVH or PVL on a head ultrasound and only mild or no ROP are largely spared from major disruptions in visual system function. We found no differences from age-matched term infants on three different measures of visual function. Since we observed no visual deficits these current data support that visual system disruption often seen during prematurity is predominantly affected by severe retinopathy or significant cerebral abnormalities. However, a single-point measurement may not necessarily be representative of the entire spectrum of visual development. Therefore it is important to follow these infants longitudinally through the first few years of childhood. Data from serial examinations, vision screening at older ages and, developmental follow up will be important to understand the effect of premature birth on visual development. In addition, further research with this cohort during early childhood will determine whether the higher than normal amplitudes in the premature group are clinically significant or related to any lasting effects on visual function.
Abbreviations
- IVH:
-
Intraventricular Hemorrhage
- PVL:
-
Periventricular Leukomalacia
- ROP:
-
Retinopathy of Prematurity
- sVEP:
-
Sweep Visual Evoked Potentials
- VLBW:
-
Very low birthweight
References
Palmer EA, Hardy RJ, Dobson V, Phelps DL, Quinn GE, Summers CG, Krom CP, Tung B 2005 15-year outcomes following threshold retinopathy of prematurity: final results from the multicenter trial of cryotherapy for retinopathy of prematurity. Arch Ophthalmol 123: 311–318
Fledelius HC, Kjer B 2004 Surveillance for retinopathy of prematurity in a Danish country. Epidemiological experience over 20 years. Acta Ophthalmol Scand 82: 38–41
Rudanko SL, Fellman V, Laatikainen L 2003 Visual impairment in children born prematurely from 1972 through 1989. Ophthalmology 110: 1639–1645
Wilson-Costello D, Friedman H, Minich N, Fanaroff AA, Hack M 2005 Improved survival rates with increased neurodevelopmental disability for extremely low birth weight infants in the 1990s. Pediatrics 115: 997–1003
O'Connor AR, Stephenson T, Johnson A, Tobin MJ, Moseley MJ, Ratib S, Ng Y, Fielder AR 2002 Long-term ophthalmic outcome of low birth weight children with and without retinopathy of prematurity. Pediatrics 109: 12–18
Lemons JA, Bauer CR, Oh W, Korones SB, Papile LA, Stoll BJ, Verter J, Temprosa M, Wright LL, Ehrenkranz RA, Fanaroff AA, Stark A, Carlo W, Tyson JE, Donovan EF, Shankaran S, Stevenson DK 2001 Very low birth weight outcomes of the National Institute of Child health and human development neonatal research network, January 1995 through December 1996. NICHD Neonatal Research Network. Pediatrics 107: E1
Hack M, Wilson-Costello D, Friedman H, Taylor GH, Schluchter M, Fanaroff AA 2000 Neurodevelopment and predictors of outcomes of children with birth weights of less than 1000 g: 1992-1995. Arch Pediatr Adolesc Med 154: 725–731
Steinkuller PG, Du L, Gilbert C, Foster A, Collins ML, Coats DK 1999 Childhood blindness. J AAPOS 3: 26–32
Early Treatment For Retinopathy Of Prematurity Cooperative Group 2003 Revised indications for the treatment of retinopathy of prematurity: results of the early treatment for retinopathy of prematurity randomized trial. Arch Ophthalmol 121: 1684–1694
Volpe JJ 2003 Cerebral white matter injury of the premature infant-more common than you think. Pediatrics 112: 176–180
O'Keefe M, Kafil-Hussain N, Flitcroft I, Lanigan B 2001 Ocular significance of intraventricular haemorrhage in premature infants. Br J Ophthalmol 85: 357–359
Cioni G, Fazzi B, Coluccini M, Bartalena L, Boldrini A, van Hof-van Duin J 1997 Cerebral visual impairment in preterm infants with periventricular leukomalacia. Pediatr Neurol 17: 331–338
Pike MG, Holmstrom G, de Vries LS, Pennock JM, Drew KJ, Sonksen PM, Dubowitz LM 1994 Patterns of visual impairment associated with lesions of the preterm infant brain. Dev Med Child Neurol 36: 849–862
Pennefather PM, Tin W 2000 Ocular abnormalities associated with cerebral palsy after preterm birth. Eye 14: 78–81
Provis JM, van Driel D, Billson FA, Russell P 1985 Development of the human retina: patterns of cell distribution and redistribution in the ganglion cell layer. J Comp Neurol 233: 429–451
Rakic P, Riley KP 1983 Overproduction and elimination of retinal axons in the fetal rhesus monkey. Science 219: 1441–1444
Birch EE, O'Connor AR 2001 Preterm birth and visual development. Semin Neonatol 6: 487–497
Hevner RF 2000 Development of connections in the human visual system during fetal mid-gestation: a DiI-tracing study. J Neuropathol Exp Neurol 59: 385–392
Lein ES, Finney EM, McQuillen PS, Shatz CJ 1999 Subplate neuron ablation alters neurotrophin expression and ocular dominance column formation. Proc Natl Acad Sci USA 96: 13491–13495
Fledelius HC 1996 Pre-term delivery and subsequent ocular development. A 7–10 year follow-up of children screened 1982-84 for ROP. 1) Visual function, slit-lamp findings, and fundus appearance. Acta Ophthalmol Scand 74: 288–293
Msall ME, Phelps DL, DiGaudio KM, Dobson V, Tung B, McClead RE, Quinn GE, Reynolds JD, Hardy RJ, Palmer EA 2000 Severity of neonatal retinopathy of prematurity is predictive of neurodevelopmental functional outcome at age 5.5 years. Behalf of the Cryotherapy for Retinopathy of Prematurity Cooperative Group. Pediatrics 106: 998–1005
Dobson V, Mayer DL, Lee CP 1980 Visual acuity screening of preterm infants. Invest Ophthalmol Vis Sci 19: 1498–1505
van Hof-van Duin J, Mohn G 1986 The development of visual acuity in normal fullterm and preterm infants. Vision Res 26: 909–916
Getz L, Dobson V, Luna B 1992 Grating acuity development in 2-week-old to 3-year-old children born prior to term. Clin Vis Sci 7: 251–256
Sebris SL, Dobson V, Hartmann EE 1984 Assessment and prediction of visual acuity in 3- to 4-year-old children born prior to term. Hum Neurobiol 3: 87–92
Fledelius H 1976 Prematurity and the eye. Ophthalmic 10-year follow-up of children of low and normal birth weight. Acta Ophthalmol Suppl 128: 3–245
Kos-Pietro S, Towle VL, Cakmur R, Spire JP 1997 Maturation of human visual evoked potentials: 27 weeks conceptional age to 2 years. Neuropediatrics 28: 318–323
Tsuneishi S, Casaer P 2000 Effects of preterm extrauterine visual experience on the development of the human visual system: a flash VEP study. Dev Med Child Neurol 42: 663–668
Roy MS, Barsoum-Homsy M, Orquin J, Benoit J 1995 Maturation of binocular pattern visual evoked potentials in normal full-term and preterm infants from 1 to 6 months of age. Pediatr Res 37: 140–144
Norcia AM, Tyler CW, Piecuch R, Clyman R, Grobstein J 1987 Visual acuity development in normal and abnormal preterm human infants. J Pediatr Ophthalmol Strabismus 24: 70–74
Sokol S, Jones K 1979 Implicit time of pattern evoked potentials in infants: an index of maturation of spatial vision. Vision Res 19: 747–755
Taylor HG, Hack M, Klein N, Schatschneider C 1995 Achievement in children with birth weights less than 750 grams with normal cognitive abilities: evidence for specific learning disabilities. J Pediatr Psychol 20: 703–719
Norcia A 1993 Improving infant evoked response measurement. In: Simons K (ed) Early visual development, normal and abnormal. Oxford University Press, New York, pp 536–552
Norcia AM, Tyler CW, Hamer RD 1990 Development of contrast sensitivity in the human infant. Vision Res 30: 1475–1486
Skoczenski AM, Norcia AM 1999 Development of VEP Vernier acuity and grating acuity in human infants. Invest Ophthalmol Vis Sci 40: 2411–2417
Norcia AM, Tyler CW, Hamer RD 1988 High visual contrast sensitivity in the young human infant. Invest Ophthalmol Vis Sci 29: 44–49
Norcia AM, Tyler CW 1985 Spatial frequency sweep VEP: visual acuity during the first year of life. Vision Res 25: 1399–1408
Skoczenski AM, Norcia AM 2002 Late maturation of visual hyperacuity. Psychol Sci 13: 537–541
Zanker J, Mohn G, Weber U, Zeitler-Driess K, Fahle M 1992 The development of vernier acuity in human infants. Vision Res 32: 1557–1564
Odom JV, Bach M, Barber C, Brigell M, Marmor MF, Tormene AP, Holder GE, Vaegan 2004 Visual evoked potentials standard (2004). Doc Ophthalmol 108: 115–123
Tang Y, Norcia AM 1995 An adaptive filter for steady-state evoked responses. Electroencephalogr Clin Neurophysiol 96: 268–277
Norcia AM, Tyler CW, Hamer RD, Wesemann W 1989 Measurement of spatial contrast sensitivity with the swept contrast VEP. Vision Res 29: 627–637
Victor JD, Mast J 1991 A new statistic for steady-state evoked potentials. Electroencephalogr Clin Neurophysiol 78: 378–388
Takayama C, Inoue Y 2004 GABAergic signaling in the developing cerebellum. Anat Sci Int 79: 124–136
van den Pol AN, Gao XB, Patrylo PR, Ghosh PK, Obrietan K 1998 Glutamate inhibits GABA excitatory activity in developing neurons. J Neurosci 18: 10749–10761
Kalloniatis M 1995 Amino acids in neurotransmission and disease. J Am Optom Assoc 66: 750–757
Author information
Authors and Affiliations
Corresponding author
Additional information
Supported in part by grant PDF 253013 from the Natural Sciences and Engineering Research Council of Canada (GM); grant 1 RO1 EY015228-01A2 from the National Eye Institute, National Institutes of Health, Department of Health and Human Services, Bethesda, MD (WVG, AM, AMN); grant 5 M01 RR000070 from the National Center for Research Resources, National Institutes of Health, Department of Health and Human Services, Bethesda, MD (Stanford University); funds from the Children's Eye Foundation of the American Association for Pediatric Ophthalmology and Strabismus (WVG); and Smith Kettlewell Eye Research Institute (AMN, AM).
Rights and permissions
About this article
Cite this article
Mirabella, G., Kjaer, P., Norcia, A. et al. Visual Development in Very Low Birth Weight Infants. Pediatr Res 60, 435–439 (2006). https://doi.org/10.1203/01.pdr.0000238249.44088.2c
Received:
Accepted:
Issue Date:
DOI: https://doi.org/10.1203/01.pdr.0000238249.44088.2c
This article is cited by
-
VEP estimation of visual acuity: a systematic review
Documenta Ophthalmologica (2021)
-
The impact of extrauterine life on visual maturation in extremely preterm born infants
Pediatric Research (2018)
-
Transcranial direct current stimulation can selectively affect different processing channels in human visual cortex
Experimental Brain Research (2015)
-
Visual function in preterm infants: visualizing the brain to improve prognosis
Documenta Ophthalmologica (2013)
-
Next-generation sequencing analysis of gene regulation in the rat model of retinopathy of prematurity
Documenta Ophthalmologica (2013)
