Abstract
Conformational changes occurring during the melting of various polyethylene (PE) materials, including high-density PE (HDPE), linear low-density PE (LLDPE) and low-density polyethylene (LDPE), were investigated using near-infrared spectroscopy. The assignment of PE to the 1650–1900 nm spectral region was suggested, on the basis of computational and experimental data for normal alkanes. The present results suggested that the 1690 and 1710 nm bands should be assigned to the CH3 groups in branched chains and chain ends, respectively. The HDPE and LDPE crystal lattices have very few defects, in contrast to LLDPE, which has more crystal lattice defects. The chain ends and junctions of LDPE are excluded from the crystal lattice and exist in a thick amorphous layer, whereas LLDPE includes comonomers in its crystalline lattice.
Introduction
The structural rearrangement and phase transformation of semicrystalline polymers, such as polyethylene (PE) and polypropylene, during annealing and heating have received significant academic and industrial interest. The thermal and melting properties of these semicrystalline polymers have been extensively investigated; however, the molecular mechanisms of melting and reorganization are still not well understood. The main reason for this is the paucity of reported in situ measurements of structural morphology and chain conformation during melting and heating processes.
Fourier transform infrared spectroscopy is a powerful tool for detecting chain conformation and structural change or phase transition during heating and cooling. In situ Fourier transform infrared spectroscopic studies of the conformational changes of semicrystalline polymers such as PE and polypropylene have been conducted.1, 2, 3 The mid-infrared region from 2500–25 000 nm is diagnostic for these polyolefins. However, the very high absorption in the mid-infrared region makes it difficult to assign spectra for industrial polyolefin bulk specimens; very thin films are usually required.
In the near-infrared (NIR) region, we consider absorption and luminescence spectra at wavelengths from 800–2500 nm, in which combination tones and overtones generated by anharmonic molecular vibrations are observed. Their absorption peaks are relatively weak compared with those of the basic tones in the mid-infrared region. These low absorption coefficients enable the nondestructive and direct measurement of vibrational spectra of bulk materials and industrial products. One disadvantage of NIR spectra is the absorption overlap of overtones and combination tones, which complicates the assignment of bands for more complex organic materials.
In such circumstances, Norris et al.4 proposed a band assignment method for NIR spectra using statistical techniques. Barton and Noda et al.5, 6, 7, 8 also assigned NIR bands by correlation with IR bands using two-dimensional correlation spectroscopy. Ozaki et al. and Siesler et al.9, 10, 11, 12, 13, 14, 15, 16 recently demonstrated that NIR spectroscopy can be useful for the structural characterization of polymeric materials, foods and bio-based materials.
Watanabe et al.17, 18, 19 demonstrated the applicability of NIR spectroscopy for characterizing thermally induced structural changes in PE. They monitored the temperature-induced phase transition of crystalline PE materials using NIR spectroscopy. They demonstrated how NIR spectroscopy could detect the melting behavior of crystalline phases in various PE materials but did not characterize the conformational changes during heating. Few studies have focused on the conformational changes of crystallizable polymers during the melting process. The aim of this study is to explore the conformational change of typical linear and branched PE materials during the melting process using in situ NIR spectroscopy. NIR spectroscopy makes it possible to analyze the molecular or structural state in actual materials and industrial products.
In this study, we assigned NIR bands to PE chains based on computational and experimental spectra of normal alkanes. The conformational changes of PE chains were investigated under a constant heating rate up to the melting point.
Experimental procedure
Materials
Commercial-grade samples of high-density polyethylene (HDPE), linear low-density polyethylene (LLDPE) with ethyl branches and low-density polyethylene (LDPE) produced by an autoclave reactor were used. The molecular characteristics of these samples are given in Table 1.
PE pellets were melted in a hot press at 483 K under 10 MPa for 10 min, with subsequent quenching from the melt to 373 K. The thickness of the compressed molded sheets was ∼500 μm.
Characterization
Differential scanning calorimetry (DSC) measurements were carried out using a Diamond DSC (PerkinElmer Inc., Waltham, MA, USA). Samples were heated from 313–473 K at a scanning rate of 20 K min−1 under a N2 atmosphere. The crystallinity in the weight fraction was determined from fusion enthalpy data, where the equilibrium fusion enthalpy of PE was taken to be 277.1 kJ kg−1.20 The density of sheet samples was obtained with the Archimedes method using a METTLER electrobalance XS205 (Mettler Toredo International Inc., Greifensee, Switzerland), with ethanol as the solvent. The melting temperatures, crystallinity and density of the polymer samples are given in Table 2.
NIR spectral measurements during melting
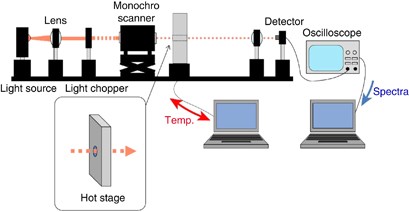
The experimental setup is illustrated in Figure 1. A Xe short-arc lamp (USHIO Inc., Tokyo Japan, UXL-300D-O), InGaAs PIN photodiode (Hamamatsu photonics Inc., Shizuoka, Japan, G8371-03) and monochromator (Hamamatsu photonics Inc. CT-10) were used as the light source, detector and monochromator, respectively. A digital oscilloscope (Lecroy Co., Chestnut Ridge, NY, USA, Model 9310 L) was used to capture spectral data. Spectral data from the oscilloscope and monochromator were analyzed with a program written using the Igor 4.0 software package (Wavematrix Inc., Portland, OR, USA). A GP-IB board (CONTEC Co. Ltd., Osaka, Japan, GP-IB(PCI)F) was used for communication between the oscilloscope, monochromator and computer.
A hot stage (Mettler Toredo International Inc., Greifensee, Switzerland) was placed in the optical pathway. NIR spectra were monitored during heating from 313–473 K at a rate of 2 K min−1. Spectra were measured at a sweep rate of 600 nm min−1 over the range 1650–1900 nm, where the absorption of the first CH stretching overtone vibration can be detected.16 Many overlapped absorption bands make it difficult to assign the absorption bands of NIR spectra. For the assignment of NIR bands of PE, we compared NIR spectra of various linear alkane solvents from hexane to tetradecane to that of molten linear HDPE. In addition, we computed the spectra of the fundamental molecular vibration of a linear C14 hydrocarbon and a C14 hydrocarbon with an ethyl group branch at the center of the main chain by using the Gaussian 03W Version 6.0 (GAUSSIAN Inc., Wallingford, CT, USA) software package. On the basis of the above measurements and computation in addition to published data,16, 17, 19 we determined the peak assignments of the major NIR bands for PE.
Results and discussion
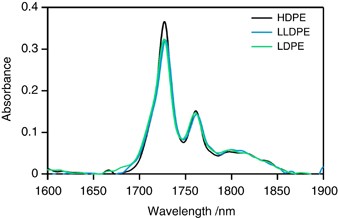
NIR spectra for PE samples in the 1650–1900 nm range are shown in Figure 2; there are two predominant peaks at 1728 and 1764 nm and various shoulders around these peaks. The intensity of the 1728 nm peak for HDPE with higher crystallinity is larger than the intensity of this peak for LLDPE and LDPE, whereas the 1764 nm peak intensity is comparable among the three PE samples. The intensity of the 1750 nm peak of LDPE and LLDPE is larger than that of HDPE. Peaks at 1728 and 1764 nm for LDPE and LLDPE are broadened in comparison to those for HDPE, which led us to conclude that the two predominant peaks include shoulder peaks associated with chain branching. According to our previous estimation of CH3-stretching IR absorptions, the first CH3 stretching overtone vibration occurs in this region.21
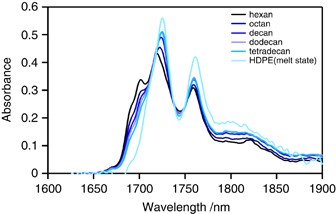
To assign NIR bands to PE, we measured NIR spectra of various linear alkane solvents from hexane to tetradecane, along with molten HDPE. These spectra were measured using optical path lengths of 2 and 0.65 mm, respectively. The intensity was divided by the thickness to yield thickness-independent results. The spectra of various alkanes and molten HDPE are shown in Figure 3.
The absorbance of the 1728 and 1764 nm peaks increases with increasing carbon atoms in the main chain, which suggests these peaks arise from the first CH2 stretching overtone vibration of the main chain. Figure 3 shows that the predominant peaks at 1728 and 1764 nm broaden with decreasing carbon atoms in the main chain. The 1750 nm absorption peak of the solvents is more intense than that for molten HDPE, and the valley between the 1728 and 1764 nm peaks deepens as the number of carbon atoms increases. This finding suggests that some absorptions around the 1740–1750 nm valley result from CH3 vibration. Shoulder peaks at 1690 and 1710 nm are apparent for linear alkanes but are largely absent in the spectrum of HDPE. Ozaki et al. reported that the 1710 nm absorption is associated with CH2 units in the amorphous phase.17, 19 It is likely that the 1690 and 1710 nm absorptions are associated with the CH3 groups of chain ends because the intensity of these absorptions decreases with increasing carbon atoms.
The fundamental molecular vibrations of methylene chains corresponding to each wavelength peak were calculated using the Gaussian 03W Version 6.0 (GAUSSIAN) software package, to confirm the assignment of these NIR bands. IR spectra calculated by the Gaussian software were converted to the vibrational overtone spectra, by adjusting them to the experimental NIR spectrum of the HDPE melt. Calculated spectra for a linear C14 hydrocarbon and C14 hydrocarbon with a central ethyl group branch were obtained. These spectra showed that the 1728 and 1764 nm peaks correspond to the first overtone of the CH2 asymmetric and symmetric stretching vibrations of the main chain, respectively. This result is consistent with assignments in previous reports.16 The calculated spectra indicate that the 1764 nm peak becomes more intense in the trans state and that absorption at 1750 nm arises from the symmetric vibration of CH3 and gauche conformation CH2 units of the main chain. The simulation results also indicate that the CH3 vibration occurs in the 1690–1710 nm region. The 1690 nm peak was assigned to the CH3 asymmetric vibration of the short-chain branches, and the peak at 1710 nm was assigned to the symmetric vibration of terminal CH3 groups. Computational assignments of NIR peaks for linear C14 and ethyl-branched C14 molecules are summarized in Table 3. These assignments support our earlier conclusions from experimental results that shoulder peaks at 1690, 1710 and 1750 nm are largely absent in molten HDPE, which has few terminal CH3 groups. Figure 3 shows that the NIR bands at 1710 and 1690 nm associated with the CH3 groups of LLDPE and LDPE shift to 1715 and 1705 nm, respectively.
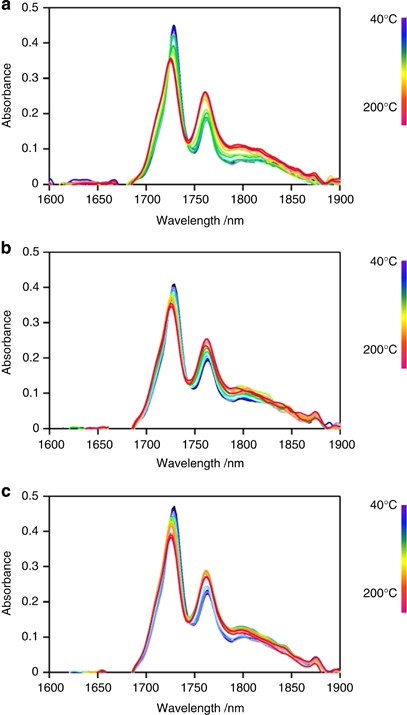
Figure 4 shows NIR spectra under a constant heating rate. The intensity of the 1728 nm peak decreases, and that of the 1764 nm peak increases with increasing temperature. The magnitude of the intensity change depends on the weight fraction of the crystalline phase before melting. The temperature sensitivity of the 1728 and 1764 nm peaks of HDPE is considerably higher than those of LDPE and LLDPE.
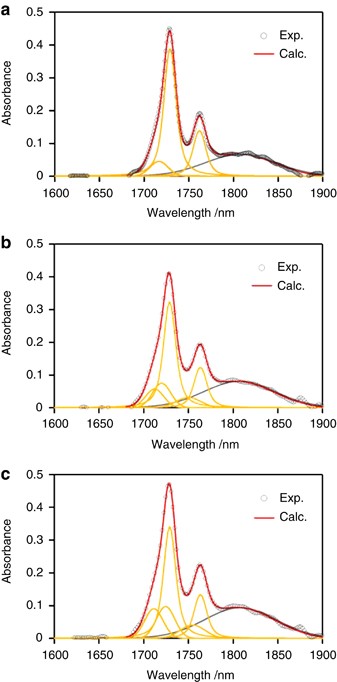
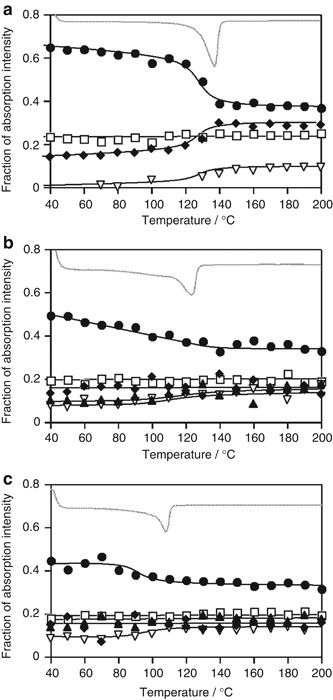
The 1650–1900 nm NIR region is thought to be composed of 5 peaks at 1705, 1715, 1728, 1750 and 1764 nm. Spectral decomposition was performed using the Voigt function implemented in the Igor 4.0 software package (Wavematrix). Figure 5 shows the component peaks obtained from curve fitting. The intensities of the 1705, 1715 and 1750 nm peaks of LDPE and LLDPE are greater than those of HDPE. This is due to the high terminal CH3 group content of LDPE and LLDPE because chain branching in this sample is much larger than that in HDPE. Figure 6 shows integrated intensities of the 1705, 1715, 1728, 1750 and 1764 nm peaks plotted against temperature. Each peak intensity was normalized by the total intensity of the five peaks. The DSC profile is also shown.
Figure 6a shows that as the temperature increases, the intensity of the HDPE CH stretching peak at 1728 nm decreases near the melting point of the DSC curve. This suggests that the asymmetric CH2 stretching vibration in the crystal lattice becomes active upon melting. In contrast, the intensity of the 1715 and 1750 nm peaks ascribed to terminal CH3 and gauche conformation CH2 units in the main chain, respectively, exhibits a stepwise increase near the DSC melting peak. This result suggests that melting releases the chain ends within crystalline lamellae and cilia chains embedded into crystalline lamellae, thus making it possible to change from the trans to gauche conformations. The 1705 nm peak ascribed to the CH3 group of short branches is too weak to detect for HDPE.
The intensity of the LLDPE peak at 1728 nm continuously decreases, reflecting the broad melting behavior seen in the DSC profiles in Figure 6b. In contrast to HDPE, the intensity of the LLDPE terminal CH3 peak at the 1715 nm peak is largely unchanged near the melting point, indicating that the molecular mobility of chain ends in the solid state is similar to that in the melted state. It suggests that there are many dangling chains or long cilia chains within the amorphous layer, which is plausible because the crystallinity of LLDPE is much lower than that of HDPE. The 1705 nm peak intensity (short branches) slightly increases near the DSC melting peak, indicating the inclusion of short-chain branches in the crystal lattice before melting.22
Figure 6c shows that the 1705 nm peak intensity is almost independent of melting, and that the 1728 nm peak intensity decreases near the DSC melting peak for LDPE. This behavior is similar to that for HDPE but different from that of LLDPE, indicating that most branches of LDPE are sufficiently long that chain ends and junctions are completely excluded from the crystal lattice and exist in the thick amorphous layers. The monotonous decrease of the 1728 nm peak for LLDPE suggests the inclusion of defects or comonomers in the crystalline lattice.
The 1764 nm peak intensity (CH2 trans) in HDPE, LLDPE and LDPE is independent of temperature, suggesting that it is not sensitive to the melting of the crystal lattice. It appears that a certain concentration of trans conformation sequences exists that are independent of heating, up to the melting point.
Conclusions
The NIR spectra of PE materials during heating were acquired to directly examine the molecular behavior during melting. The utility of NIR spectroscopy in investigating conformational changes of different crystallizable PE samples has been demonstrated. NIR bands of PE in the 1650–1900 nm region were assigned with the aid of computer-simulated molecular vibrations and the experimentally measured NIR spectra of alkane solvents. The following conclusions were reached:
-
1)
Peaks at 1728 and 1764 nm result from the first overtone of the CH2 asymmetric and symmetric stretching vibrations of the main chain, respectively. The 1764 nm peak has a high spectral intensity in the trans state, and absorption at 1750 nm is associated with the symmetric vibration of CH3 and gauche conformation of CH2 groups of the main chain. The 1705 nm peak was assigned to the CH3 asymmetric vibration of short branches, and that at 1715 nm was assigned to the terminal CH3 symmetric vibration.
-
2)
The 1728 nm peak is associated with CH2 units within the crystal lattice. The molecular motion of HDPE chain ends becomes active near the melting point. The chain ends and junctions of LDPE are completely excluded from the crystal lattice and exist in the thick amorphous layer. In contrast, the crystal lattice of LLDPE includes defects or comonomers. The 1764 nm peak intensity is resistant to heating and melting, suggesting that a constant amount of trans sequence CH2 units always exists.
References
Zhu, X., Yan, D. & Fang, Y. In Situ FTIR spectroscopic study of the conformational change of isotactic polypropylene during the crystallization process. J. Phys. Chem. B 105, 12461–12463 (2001).
Plass, M., Streck, R., Nieto, J. & Siesler, H. W. Rheo-optical FT-IR spectroscopy of LLDPE: effect of comonomer and composite materials. Macromol. Symp. 265, 166–177 (2008).
Parthasarthy, G., Sevegney, M. & Kannan, R. M. Rheooptical Fourier transform infrared spectroscopy of the deformation behavior in quenched and slow-cooled isotactic polypropylene films. J. Polym. Sci. B 40, 2539–2551 (2002).
Ben-Gera, I. & Norris, K. H. Direct spectrophotometric determination of fat and moisture in meat products. J. Food Sci. 33, 64–67 (1968).
Barton II, F. E., Himmelsbach, D. S., Duckwoeth, J. H. & Smith, M. J. Two-dimensional vibration spectroscopy: correlation of mid- and near-infrared regions. Appl. Spectrosc. 46, 420–429 (1992).
Noda, I., Dowrey, A. E. & Marcott, C. Recent developments in two-dimensional infrared (2D IR) correlation spectroscopy. Appl. Spectrosc. 47, 1317–1323 (1993).
Noda, I., Liu, Y., Ozaki, Y. & Czarnecki, M. A. Two-dimensional Fourier transform near-infrared correlation spectroscopy studies of temperature-dependent spectral variations of Oleyl alcohol. J. Phys. Chem. 99, 3068–3073 (1995).
Noda, I. Determination of two-dimensional correlation spectra using the Hilbert transform. Appl. Spectrosc. 54, 994–999 (2000).
Hoffmannn, U., Pfeifer, F., Okretic, S., Völky, N., Zahedi, M. & Siesler, H. W. Rheo-optical Fourier transform infrared and Raman spectroscopy of polymers. Appl. Spectrosc. 47, 1531–1539 (1993).
Schade, C., Heckmann, W., Borchert, S. & Siesler, H. W. Determination of orientational states in impact-polystyrene specimens by near-infrared polarization spectroscopy. Polym. Eng. Sci. 46, 381–383 (2006).
Watari, M. & Ozaki, Y. Prediction of ethylene content in melt-state random and block polypropylene by near-infrared spectroscopy and chemometrics: comparison of a new calibration transfer method with a slope/bias correction method. Appl. Spectrosc. 58, 1210–1218 (2004).
Watari, M. & Ozaki, Y. Calibration models for the vinyl acetate concentration in ethylene-vinyl acetate copolymers and its on-line monitoring by near-infrared spectroscopy and chemometrics: use of band shifts associated with variations in the vinyl acetate concentration to improve the models. Appl. Spectrosc. 59, 912–919 (2005).
Watari, M. & Ozaki, Y. Practical calibration correction method for the maintenance of an on-line near-infrared monitoring system for molten polymers. Appl. Spectrosc. 60, 529–538 (2006).
Miller, C. E. Near-infrared spectroscopy of synthetic polymers. Appl. Spectrosc. Rev. 26, 277–339 (1991).
Furukawa, T., Watari, M., Siesler, H. W. & Ozaki, Y. Discrimination of various poly(propylene) copolymers and prediction of their ethylene content by near-infrared and Raman spectroscopy in combination with chemometric methods. J. Appl. Polym. Sci. 87, 616–625 (2003).
Sato, H., Shinoyama, M., Kamiya, T., Amari, T., Šašić, S., Ninomiya, T., Siesler, H. W. & Ozaki, Y. Near infrared spectra of pellets and thin films of high-density, low-density and linear low-density polyethylenes and prediction of their physical properties by multivariate data analysis. J. Near Infrared Spectrosc. 11, 309–321 (2003).
Watanabe, S., Dybal, J., Tashiro, K. & Ozaki, Y. A near-infrared study of thermally induced structural changes in polyethylene crystal. Polymer 47, 2010–2017 (2006).
Watanabe, S., Noda, I. & Ozaki, Y. Thermally induced conformational changes in polyethylene studied by two-dimensional near-infrared-infrared hetero-spectral correlation spectroscopy. J. Mol. Struct. 883–884, 173–180 (2008).
Watanabe, S., Noda, I. & Ozaki, Y. Thermally induced conformational and structural disordering in polyethylene crystal studied by near-infrared spectroscopy. Polymer 49, 774–784 (2008).
Wunderlich, B. & Dole, M. Specific heat of synthetic high polymers. VIII. Low pressure polyethylene. J. Polym. Sci. 24, 201–213 (1957).
Krimm, S. Infrared spectra of high polymers. Fortschr. Hochpolym. Forch. 2, 51 (1960).
Salazer, J. M. & Calleja, F. J. B. On the Inclusion of Chain Defects in the Polyethylene Lattice A statistical Approach. Polym. Bull. 2, 163–167 (1980).
Author information
Authors and Affiliations
Corresponding author
Rights and permissions
About this article
Cite this article
Mizushima, M., Kawamura, T., Takahashi, K. et al. In situ near-infrared spectroscopic studies of the structural changes of polyethylene during melting. Polym J 44, 162–166 (2012). https://doi.org/10.1038/pj.2011.100
Received:
Revised:
Accepted:
Published:
Issue Date:
DOI: https://doi.org/10.1038/pj.2011.100

