MARIA ANTONIETTA TOSCHES: Maps to explore uncharted territory in the brain
For centuries, explorers have drawn and updated geographical maps, and used them to organize information and venture into new parts of the world. Similarly, brain atlases have been instrumental in neuroscience research. A series of papers from the BRAIN Initiative Cell Census Network (BICCN) present cellular maps of the mouse brain (Fig. 1), which will enable neuroscientists to explore previously uncharted territories with unprecedented depth and resolution.

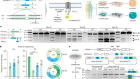
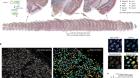
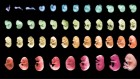
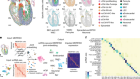
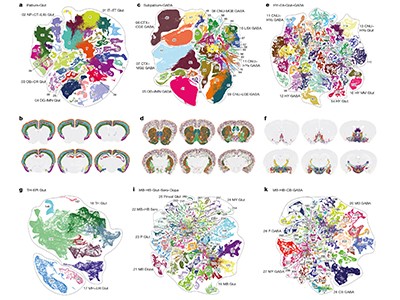
Figure 1 | Whole mouse-brain atlases from the BRAIN Initiative Cell Census Network provide a wealth of spatial transcriptomic and epigenomic data. a, Thousands of cell types (shown in different colours) can be identified on the basis of their transcriptomic profiles, and mapped to the anatomical regions of the mouse brain. (Adapted from Fig. 1 of ref. 2.) b, Epigenetic information, such as the methylation state of a gene (shown in shades of blue), can also be spatially mapped to allow comparisons between cell types and brain regions. (Adapted from Fig. 3 of ref. 13.) c, Neurons that project to the spinal cord can be investigated using spatial transcriptomic information. This reveals, for example, that the combination of transcription factors that spinal-projecting neurons express (shown by different colours) defines where they are in the brain. (Adapted from Fig. 4 of ref. 7.) d, Transcriptomic and epigenomic data sets enable comparisons between species. For example, comparing gene-expression patterns in neurons of the retinas of the eyes of different vertebrate species (including mice and humans) reveals characteristics of cells that have either been conserved or diverged throughout evolution. (Adapted from Fig. 1 of ref. 10.)
In the past decade, single-cell RNA sequencing — a method of analysing the complete set of genes expressed in an individual cell (its transcriptome) — has fuelled the generation of cell-type atlases. So far, multimodal, high-resolution atlases have been limited mostly to particular parts of the brain, such as the motor cortex1. The latest BICCN papers by Yao et al.2, Zhang et al.3, Langlieb et al.4 and Shi et al.5 bring cell-type atlases to the next level. First, they present comprehensive resources that encompass not just specific regions, but the entire brain of the mouse (Mus musculus). Second, they combine single-cell RNA sequencing with spatial transcriptomics, which allows cell types to be placed in their native tissue context.
These brain-wide atlases allow for unbiased comparisons between brain regions. A key insight emerging from these data is that the number of neuron types in an area does not scale with the size of that area or the total number of neurons in it. Certain regions of the brain — such as the hypothalamus, midbrain and hindbrain — contain many types of neuron, which are relatively similar to one another. By contrast, other regions of the brain, including the cerebral cortex and cerebellum, contain fewer types of neuron, but they are more divergent in their identities. These findings indicate that different rules govern neuronal diversity across the brain, perhaps because each region evolved under different constraints. The BICCN data sets will prompt further investigations of poorly studied brain regions by providing open access to the transcriptomic profiles and spatial distributions of all of their neuronal types.
After sequencing the RNA transcripts of millions of cells in the mouse brain, Yao et al.2 and Langlieb et al.4 report that cells can be grouped into more than 5,000 distinct clusters, most of which are neuronal. However, one set of genes — those that encode transcription factors — alone have the same classification power as complete transcriptomes, indicating that the immense diversity of brain cell types can be defined simply by the combinations of transcription factors that the cells express2.
Read the paper: Molecularly defined and spatially resolved cell atlas of the whole mouse brain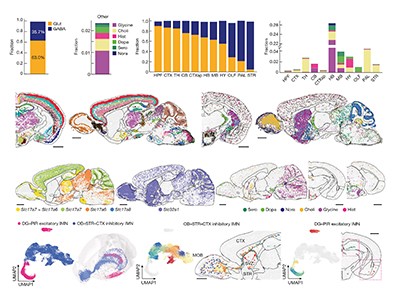
Further to these observations, Zhou et al.6 and Winter et al.7 investigated the relationships between the molecular identity of neurons and the region of the central nervous system to which they extend their neuronal projections (axons). By focusing on a specific population of neurons that project to the spinal cord, Winter and colleagues show that patterns of expression of a particular family of transcription factors distinguish five spatially segregated subpopulations. These results support the hypothesis that multiple facets of neuronal identity, including its transcriptome and projection specificity, are controlled in concert by cell-type-specific combinations of transcription factors8.
If this is the case, it is tempting to speculate that neurons that are evolutionarily conserved across species should express the same transcription factors, and that they might have some similar anatomical and functional features9. This is precisely what Hahn et al.10 found when they studied eye evolution by comparing single-cell RNA sequencing data from the retinas of 17 vertebrate species. The retina is an excellent choice to study cell-type evolution: it has a conserved organization, with six major cell classes, but it nevertheless serves the visual needs of animals inhabiting different environments, suggesting that there have been evolutionary adaptations at the cellular level.
Read the paper: The molecular cytoarchitecture of the adult mouse brain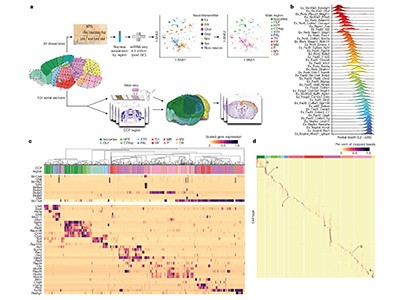
Using comparative transcriptomics, Hahn and colleagues show that neurons that were thought to be specific to primates, known as midget retinal ganglion cells, actually have counterparts in rodents. Furthermore, the granularity of the cell-type data allows scientists to test whether evolutionary adaptations affect certain cell classes more than others. Indeed, the authors show that cell-type diversification is highly pronounced in retinal ganglion cells, which are the neurons that transmit visual information from the retina to the brain.
Cell-type atlases are important not only for understanding brain architecture at the cellular scale, but also for making precise inferences about how brains evolved. As the studies by Hahn et al.10 and others11 show, each class of neuron evolves at its own pace. The kinship between gene expression (including that of transcription factors) and axonal projections suggests that the molecular evolution of neurons is tied to the evolution of their function. In the future, these hypotheses can be tested rigorously by comparing comprehensive maps of gene expression and neural connections between multiple species.
HEATHER J. LEE: Buried treasure in the epigenomic landscape
Whether you got to work this morning by bike, car or boat, your choice was probably dictated by your environment. In the same way that our daily lives are shaped by the landscapes in which we live, the specialized functions of our cells are constrained by the ‘epigenomic landscape’ — the pattern of the molecular features across a genome that control access to the genetic code. Such features include biochemical modifications to DNA (such as the addition of a methyl group), the compaction of chromatin (the packaged form of DNA in complex with proteins) and the conformation of chromosomes, all of which are dynamically rearranged during development. This leads to distinct epigenetic profiles that maintain expression of the appropriate genes at the appropriate levels in each specialized cell type. The BICCN presents an incredibly detailed survey of the epigenomic landscapes across thousands of specialized cell types from the adult mouse brain.
Read the paper: Single-cell analysis of chromatin accessibility in the adult mouse brain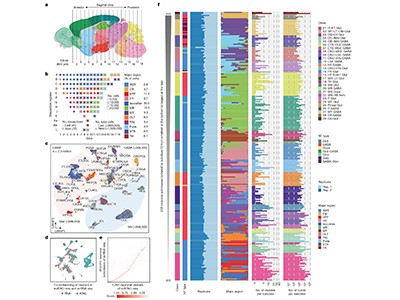
The authors used advanced experimental and analytical approaches to map multiple epigenetic features in the nuclei of individual cells and to connect information about gene transcription with information about the anatomical location of cells in the brain. This collaborative effort in cellular cartography has revealed insights into the rules that govern how the genetic code is read and interpreted in different cell types and species.
Key features of epigenomic landscapes are segments of non-coding DNA called regulatory elements, which control gene activity. Zu et al.12, Liu et al.13 and Zemke et al.14 have mapped these regulatory elements in individual cell types of the mouse brain. Zu and colleagues also developed deep-learning models that can identify potential cell-type-specific regulatory elements on the basis of the underlying DNA sequence. When tested on human DNA sequences, these models predicted regulatory elements in the corresponding cell types from the mouse brain, illustrating that the links between the genetic sequence and cell-type-specific epigenomic landscapes are conserved across species.
Read the paper: Single-cell DNA methylome and 3D multi-omic atlas of the adult mouse brain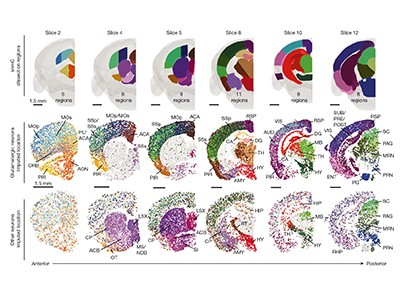
A detailed comparison between four mammalian species found that highly conserved regulatory elements tend to be located near the starts of genes that they regulate, whereas species-specific regulatory elements were at sites farther away. Another interesting observation is that regulatory elements specific to either mouse or human cells often overlap with transposable elements — genetic sequences that moved around the genome during mammalian evolution14. This suggests that transposable elements could have been co-opted to fine-tune gene activation in specialized cell types and in different species.
Another feature of the epigenomic landscape is the segregation of active and inactive segments of the genetic code into distinct chromatin compartments. Liu and colleagues mapped these features in each cell type and found that DNA segments that switched between active and inactive compartments contained genes that are important for specialized neuronal functions. They also identified physical interactions between different parts of the genetic sequence and, using machine learning, demonstrated that these interactions could be used to predict which version of a gene is active in each cell type.
Read the paper: Conserved and divergent gene regulatory programs of the mammalian neocortex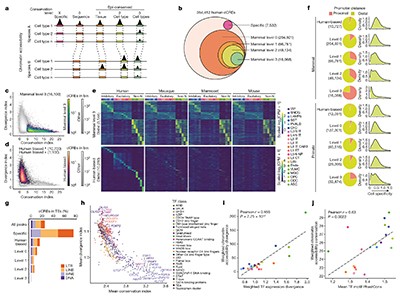
Next, the same group mapped places in the genome that limit interactions between genes and regulatory elements — known as genomic boundaries — across brain cells. Interestingly, boundaries that were specific to a particular cell type were often found at the start or end of long neuronal genes that were active in that population of cells. When comparing between species, Zemke and colleagues found that evolutionarily conserved genomic boundaries were associated with genes that were uniformly expressed in all the species that they tested. Similar to regulatory elements, boundary sites that differed between species contained many transposable elements.
Zhou et al.6 explored links between epigenomic landscapes and synaptic connections between cell types in different parts of the brain. In a region of the cerebrum (the forebrain) called the isocortex, for example, cells that project to other regions in the cerebrum had epigenetic profiles that were distinct from those that project to regions outside the cerebrum, such as the hindbrain. This suggests that epigenomic landscapes can shape interactions between cell types in different brain regions, as well as genetic activity in individual cells.
Will this survey of epigenomic landscapes point future studies to any buried treasure? The directory of cell-type-specific gene regulatory networks — which describe the interactions between hundreds of transcription factors, regulatory elements and genes — will certainly be an excellent resource for researchers investigating atypical cell differentiation in neurodevelopmental disorders. In other neurological conditions, epigenomic landscapes will guide the interpretation of genetic contributions to disease risk. Indeed, Zemke and colleagues demonstrate that genetic variants linked to multiple sclerosis, anorexia nervosa and tobacco-use disorder often overlap with regulatory elements that are conserved across species14. Thus, the work presented by the BICCN has laid a firm foundation for many further discoveries relating to neurobiology and neurological disorders.
 Read the paper: A high-resolution transcriptomic and spatial atlas of cell types in the whole mouse brain
 Read the paper: Molecularly defined and spatially resolved cell atlas of the whole mouse brain
 Read the paper: The molecular cytoarchitecture of the adult mouse brain
 Read the paper: Spatial atlas of the mouse central nervous system at molecular resolution
 Read the paper: Brain-wide correspondence of neuronal epigenomics and distant projections
 Read the paper: A transcriptomic taxonomy of mouse brain-wide spinal projecting neurons
 Read the paper: Evolution of neuronal cell classes and types in the vertebrate retina
 Read the paper: Single-cell analysis of chromatin accessibility in the adult mouse brain
 Read the paper: Single-cell DNA methylome and 3D multi-omic atlas of the adult mouse brain
 Read the paper: Conserved and divergent gene regulatory programs of the mammalian neocortex
 The quest to map the mouse brain
 A census of cell types in the brain’s motor cortex