
Abstract
This digital texture analysis-based study evaluates the chromatin organization state in flat and cribriform high-grade prostatic intraepithelial neoplasia (PIN), in the adjacent normal looking secretory epithelium and in the co-occurring adenocarcinoma. Digital texture analysis (karyometry) was carried out on hematoxylin and eosin-stained sections from 24 radical prostatectomy specimens with high-grade PIN (12 with flat and 12 with cribriform architectural pattern, respectively) and cancer. Quantification was also conducted on the normal looking secretory epithelium. Discriminant analysis and the nonsupervised learning algorithm P-index were used to identify suitable subsets of features useful for the discrimination and classification of pathological groups and to explore multivariate data structure in the pathological subgroups. The average nuclear abnormality increases monotonically from the histologically normal appearing secretory epithelium to high-grade PIN and to adenocarcinoma. The nuclei from the so-called perimeter compartment of the flat high-grade PIN lesions show a higher nuclear abnormality compared to the nuclei of the cribriform high-grade PINs. Discriminant analysis shows that flat and cribriform high-grade PINs fall into two populations. Processing by the nonsupervised learning algorithm P-index revealed the existence of three well-defined, distinct subpopulations of nuclei of different chromatin phenotype. In the flat high-grade PIN lesions the proportions of nuclei in the three subpopulations are 16.5% (low abnormality), 25.0% (mid abnormality) and 58.5% (high abnormality), respectively. In the cribriform high-grade PIN lesions, 100% of the nuclei are in the mid-abnormality subpopulation. These differences are also discernible in the co-occurring adenocarcinoma and the histologically normal appearing secretory epithelium. To conclude, karyometry and statistical analysis detect the existence of distinct cell subpopulations of different chromatin packaging and phenotype, with the nuclei from the flat high-grade PIN lesions, adjacent normal looking epithelium and co-occurring adenocarcinoma expressing a greater nuclear abnormality than in the specimens with cribriform high-grade PIN.
Main
Prostatic intraepithelial neoplasia is defined by an intraluminal proliferation of the secretory cells in the prostate duct–acinar system. PIN is characterized by a spectrum of atypical cytological features ranging from minimal changes to those that are indistinguishable from carcinoma cells.1, 2
The classification of PIN into low-grade and high-grade is chiefly based on the cytological characteristics of the cells. The nuclei of cells composing low-grade PIN are enlarged, vary in size, have a normal or slightly increased chromatin content, and possess small or inconspicuous nucleoli. High-grade PIN is characterized by cells with large nuclei of relatively uniform size, an increased chromatin content, which may be irregularly distributed, and prominent nucleoli that are similar to those of carcinoma cells. The basal cell layer is intact or rarely interrupted in low-grade PIN, but may have frequent disruptions in high-grade lesions.2
Many pathologists no longer report the presence of low-grade PIN and note only the histologic findings associated with high-grade PIN. The latter is a likely precursor for many peripheral zone moderately to poorly differentiated adenocarcinomas of the prostate, and hence it is often recognized in prostate glands that have not yet developed invasive carcinoma.3
Bostwick et al4 described four architectural patterns of high-grade PIN. These include flat, tufting, micropapillary and cribriform. The cribriform pattern is the easiest to identify also at low magnification, being composed of atypical cells completely spanning the lumen and often filling it (ie, cell mass with multiple small, round to elongated lumens). In many examples of cribriform PIN, the atypical cells are found only at the periphery, with cytologically bland cells in the center, such that atypical cells do not completely span the lumen. The flat pattern can be the most difficult to identify even at high magnification, being often composed of secretory cells with atypical nuclei in ducts and acini with minor architectural changes. Intraductal lesions with either a tufting or a micropapillary pattern might represent an intermediate stage in the formation of a cribriform structure from a flat lesion.
Familiarity with this diverse architectural spectrum may facilitate the histological recognition of PIN, even though these various architectural patterns have no apparent clinical significance: the pattern and morphologic features are not considered as important as the presence of this condition.5, 6
To the best of our knowledge, there are no previous studies comparing the so-called perimeter compartment in cribriform and flat high-grade PIN. The perimeter compartment refers to the ring of secretory epithelial cells, which is close to, or in contact with, the periglandular stroma.7 The objective of this study was to determine whether the nuclei in these two architectural types of high-grade PIN reveal different phenotypes in terms of chromatin organization state. Also, it was the objective of this study to determine if any such differences are expressed in the adjacent normal looking secretory epithelium, and whether they might persist into the co-occurring adenocarcinoma.
This was an exploratory study conducted on a limited sample size, however, which satisfied statistical power requirements to distinguish the high-grade PIN lesions according to their architecture, and to detect changes in the co-occurring adenocarcinoma and in the normal-appearing epithelium (see below in the Results section).
Materials and methods
The histological material used in the current study consisted of 24 cases of prostatic (acinar) adenocarcinoma obtained from the radical prostatectomy (RP) file of the Institute of Pathological Anatomy and Histopathology, Polytechnic University of the Marche Region (Ancona). The cases that met the following criteria were selected:
-
The study patients (their mean age was 62.5 years) did not receive chemo-, hormone or radiation therapy before surgery.
-
The serum total PSA was below 10 ng/ml.
-
The material had been fixed in 10% formalin for up to 24 h before processing.
-
The pathologic stage was pT2a/b N0 and M0 (2002 revision of the TNM system)8 in all cases.
-
Cancer and high-grade PIN were always localized in the peripheral zone of the prostate.
-
All the cancers had a Gleason score of 6 (3+3).
-
High-grade PIN showed a predominant flat architecture in 12 cases, while the cribriform pattern was the most prevalent in the other 12 (Figure 1a and b).
Figure 1 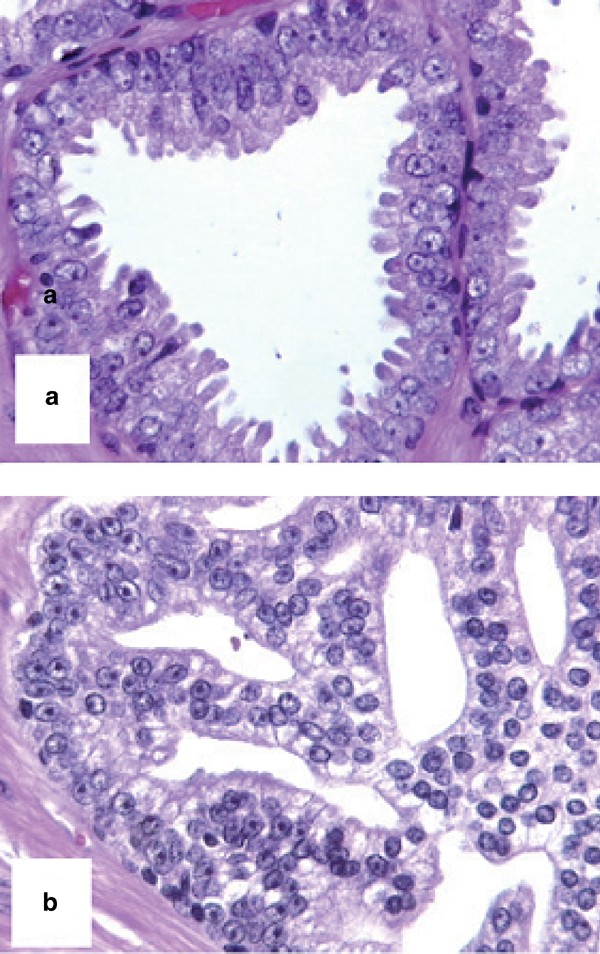
Histological appearance of flat (a) and cribriform (b) high-grade PIN.
-
In each of the 24 cases, the slide (and its corresponding paraffin block) that contained cancer, high-grade PIN and normal and that was devoid of inflammation was selected for the study. As far as normal was concerned, this did not show morphological features of atrophy.

Sections, 5 μm thick, were cut from the paraffin blocks and stained with hematoxylin and eosin (H&E) in the same batch and at the same time. The areas of cancer, high-grade PIN and normal were marked on each slide with a pen. The areas of normal prostate were adjacent to the high-grade PIN foci.
Karyometric and Statistical Analyses
Karyometry was carried out at the Optical Sciences Center of the University of Arizona, Tucson, AZ, on the fresh H&E-stained sections. H&E-staining was used so that the results from image analysis could be directly compared and correlated with histopathologic assessment. Bahr9 and Keenan et al10 showed that data derived from H&E and Papanicolaou stains are linearly correlated with those from Feulgen.
The nuclei were recorded on a video-microscope equipped with a 63:1 Zeiss (Zeiss, Oberkochen, Germany) planapochromatic oil immersion objective, NA=1.40, and a COHU (San Diego, CA, USA) black and white video camera. An interference filter with a maximum bandpass at 610 nm was used to enhance contrast of the H&E-stained sections. The relay optics provided a sampling density of six pixels per micrometer. Individual nuclei from the images were edited using an interactive procedure and then filed for feature extraction. Enough fields were recorded to provide 100 nuclei from each diagnostic area per case (ie, 100 from high-grade PIN, 100 from normal looking secretory epithelium and 100 from adenocarcinoma), for a total of 7200 nuclei. Only the ring of secretory epithelial cells which is close to, or in contact with, the periglandular stroma was measured in high-grade PIN, histologically normal appearing secretory epithelium and adenocarcinoma.7 This approach was adopted to avoid the fact that the ‘maturation effect’1 present in the central compartment of cribriform high-grade PIN could have influenced the results in the measurements. The basal cells, as identifiable by the morphology of the nuclei and by the degree of staining of the cytoplasm, were excluded from the evaluation.
A total of 93 karyometric features were analyzed in this study. These are related to nuclear area, total optical density and chromatin distribution.11, 12, 13 Table 1 gives a sample list of features used in the discriminant function analyses and in the unsupervised learning program P-index11, 12, 13 (see below) (all features are given in relative units of measure) (the values in parenthesis refer to an arbitrary code number with which the feature is identified in the computer program). The P-index groupings are based on two composite features: the discriminant function I score, and the nuclear abnormality.
Statistical analysis included the use of the Kruskal–Wallis test to determine significant differences in chromatin texture features between pathological subgroups. Discriminant analysis was adopted to identify suitable subsets of features useful for the discrimination and classification of pathological groups. The nonsupervised learning algorithm P-index was used to explore multivariate data structure in pathological subgroups (details of these analyses are given in Bartels et al,14 Bartels and Olson,15 Beale16 and Kruskal and Willis17).
Results
Identification of the Normal Reference Data Set
In an effort to define a suitable reference data set to assess the degree of deviation of nuclei from ‘normal’, for the computation of nuclear signatures and lesion signatures, a discriminant function was derived. For this, all nuclei from the histologically normal appearing secretory epithelium were discriminated against all nuclei from the cases of adenocarcinoma. A threshold was set in the discriminant function score distribution from the histologically normal appearing secretory epithelium. A set of nuclei with low discriminant function scores was arbitrarily defined as the ‘normal’ reference nuclei.
Nuclear Abnormality, Nuclear Signature and Lesion Signature
The average nuclear abnormality for nuclei (for details in the calculation of the nuclear abnormality value, see Bartels et al18 and Montironi et al19) increases monotonically from the histologically normal appearing secretory epithelium (norm/lesion) to high-grade PIN and to adenocarcinoma. The nuclei from the flat high-grade PIN lesions show a higher nuclear abnormality compared to the nuclei from cribriform high-grade PINs. This is also observed for the nuclei from the histologically normal appearing secretory epithelium of flat high-grade PIN cases and the nuclei from the co-occurring adenocarcinomas. In fact, in the cases with flat high-grade PIN the nuclear abnormality for all sites is greater than for nuclei from the cases with cribriform high-grade PIN (Table 2). The observed mean differences are in the order of 15–25%, that is, substantially larger than the 4–5%, which could have been detected with a group sample size of 1000 nuclei, and which still would have offered 90% power.
A second option for the derivation of a grading curve of the lesions being investigated in this study is offered by the set of feature z-values used in the nuclear signatures.11, 12, 13 These values express the relative deviation of each feature from ‘normal’, as assessed from the set of ‘normal’ reference nuclei. These features have the advantage that they are based on a relative, ‘internal’ standard. They also can indicate changes in the variance of features even if no change in the mean value occurs (for details in the calculation of the nuclear signature features, see Bartel et al14). Figure 2a and b show the nuclear signatures of the reference data set, the nuclei measured in the histologically normal appearing secretory epithelium, in high-grade PIN, and in adenocarcinoma, for the cases with flat and with cribriform high-grade PIN lesions, respectively. The nuclear signatures in both high-grade PIN patterns are clearly different from that of the reference nuclei and are similar to those in the co-occurring cancer. In addition, the profiles in the nuclear signatures in the flat high-grade PINs are different from those in the cribriform group of high-grade PINs, deviating more from normal in the former group. Interestingly, the nuclei in the histologically normal appearing secretory epithelium for cases of either high-grade PIN patterns show a signature that is more similar to that of high-grade PIN than to that of the reference nuclei.

Nuclear signatures of the reference data set, the nuclei measured in the histologically normal appearing secretory epithelium, in high-grade PIN, and in adenocarcinoma, for the cases with flat and with cribriform high-grade PIN lesions, respectively. The nuclear signatures in the flat high-grade PINs are different from those in the cribriform group of high-grade PINs, deviating more from normal in the former group.
The lesion signatures (for details in the calculation of the lesion signatures, see Montironi et al19) show an increasing nuclear abnormality from the histologically normal appearing secretory epithelium, to the high-grade PIN lesions, and the adenocarcinomas, with a shift towards higher nuclear abnormalities in the group of flat high-grade PIN lesions, as seen in Figure 3.

The lesion signatures show an increasing nuclear abnormality from the histologically normal appearing secretory epithelium, to the high-grade PIN lesions, and the adenocarcinomas, with a shift towards higher nuclear abnormalities in the group of flat high-grade PIN lesions.
Discriminant Analyses
The nuclei in flat high-grade PINs, when compared to those in cribriform high-grade PIN lesions, exhibit differences in the values of almost all karyometric features. A Kruskal–Wallis test identified 65 out of 93 karyometric features as statistically different at a level of P<0.005. Relative nuclear area and a number of run length features were selected on the basis of this test and entered into a discriminant analysis. Table 3 lists the feature mean values. The differences are not substantial, but Wilks’ Lambda was reduced to 0.84. This confirms statistical significance of the differences even though the two discriminant function score distributions clearly overlap. The average correct classification rate for nuclei was only a modest 67%. Figure 4 shows the discriminant function score distributions. Again, the nuclei from flat high-grade PIN are shown to be shifted towards the higher scores.

Discriminant function score distributions. The nuclei from flat high-grade PIN are shown to be shifted towards the higher scores.
The distributions of the feature values, of the nuclear abnormality values and of the discriminant function scores overlap to such an extent that case classification on this basis is not effective. To improve the case classification rate, it was decided to abandon the discrimination on the basis of the nuclear discriminant function scores, and to rely instead on the within case function score distributions, that is, to conduct a secondary discriminant analysis using the relative frequencies of occurrence of discriminant function score values as metafeatures. For seven of the 24 value intervals on the discriminant function I score range a statistical difference of P<0.05 was found. A discriminant analysis based on these metafeatures reduced Wilks’ Lambda to 0.52 (discriminant function II) and achieved a case correct classification rate of 85%.
Figure 5 shows a plot where discriminant function score I is used as ordinate, and discriminant function II as abscissa. The 95% bivariate confidence ellipses are based on the modest sample sizes of 12 cases each only, and show minimal overlap. It is evident that nuclei from flat and from cribriform high-grade PIN fall into two populations that overall are very similar, with the nuclei from flat high-grade PIN expressing a higher nuclear abnormality.

Plot where discriminant function score I is used as ordinate, and discriminant function II as abscissa. The 95% bivariate confidence ellipses show minimal overlap (the larger ellipses correspond to 90% tolerance) (triangles: cribriform HG-PIN, asterisks: Flat HG-PIN).
These differences are also discernible in the co-occurring adenocarcinoma and the histologically normal appearing secretory epithelium, when the corresponding discriminant functions I and II were developed (data not shown).
Phenotype Identification by Unsupervised Learning
The data set from flat and cribriform high-grade PIN lesions was submitted to the unsupervised learning algorithm P-index (for details in the calculation see Montironi et al19) to establish whether the nuclei represented a homogeneous population. Processing by this algorithm revealed the existence of three well-defined, distinct subpopulations of different chromatin phenotype. One of these three phenotypes has a low nuclear abnormality2 (ie, low abnormality subpopulation). The second phenotype represents nuclei deviating by about 1.2–2.4 averaged standard deviations from normal (ie, mid abnormality subpopulation), and the third phenotype represents nuclei deviating from 2.5 to 3.2 average standard deviations from normal (ie, high abnormality subpopulation).
Table 4 lists the average nuclear abnormality values and the mean discriminant function I values for these three subpopulations (the nuclei of the flat and high-grade PINs are pooled together). Figure 6 shows the nuclear signatures of these phenotypes. The three subpopulations differ notably and statistically in a large number of karyometric features. Table 5 shows the mean values for some features. The P-index algorithm was then applied to the data sets from adenocarcinomas and histologically normal appearing secretory epithelium and revealed the existence of the same subpopulations of nuclei seen in the flat and cribriform PIN lesions (Table 6).

Nuclear signatures of the three subpopulations.
In the flat high-grade PIN lesions, the proportions of nuclei in the three subpopulations are 16.5% (low abnormality), 25.0% (mid-abnormality) and 58.5% (high abnormality), respectively. In the cribriform high-grade PIN lesions, 100% of the nuclei are in the mid-abnormality subpopulation.
The adenocarcinomas co-occurring with the flat and cribriform high-grade PIN lesions are somewhat similar as far as the high abnormality subpopulation is concerned, even though the former has a slightly higher proportion than the other, that is, 64.5 vs 60.5%, respectively. Different are the proportions in the other two subpopulations. There are no nuclei in the low subpopulation in the cancers co-occurring with flat high-grade PIN.
In the norm/lesion data sets from the samples with flat high-grade PINs, 60 and 40% of nuclei are found to belong to the mid and high abnormality subpopulations, respectively. In the norm/lesion data sets from the samples with cribriform high-grade PINs, the nuclei belong to the low (24%) and mid (76%) abnormality subpopulations, respectively.
In the flat high-grade PIN there are, overall diagnostic sites, 5.5% of all nuclei in the low abnormality group, 40.2% in the mid-abnormality group, and 54.3% in the high abnormality group. This compares to 13.2, 66.7 and 20.2% in the cribriform high-grade PIN. The proportion of 54.3% is clearly significantly greater than the 20.2% in the cribriform high-grade PIN for the highest abnormality group. Conversely, the cribriform high-grade PIN has, with 66.7%, a significantly higher proportion in the mid-abnormality group than is seen in the flat high-grade PIN. For the sample sizes involved, the differences in proportions are significant at P<0.01 in these comparisons. The difference in proportions for the lowest abnormality group is not significant.
Figure 7 is a bivariate plot based on the average nuclear abnormality and discriminant function I score for the low, mid and high abnormality subpopulations in normal looking tissue, high-grade PIN and cancer, both for the flat and cribriform groups.

Bivariate plot based on the average nuclear abnormality and discriminant function I score for the low, mid- and high abnormality subpopulations in normal looking tissue, high-grade PIN and cancer, both for the flat and cribriform groups.
Discussion
Karyometry and statistical analysis in prostates harboring high-grade PIN and cancer detect the existence of nuclear subpopulations with distinct chromatin phenotypes. Little is known about the underlying biological mechanisms responsible for the subvisual differences in chromatin organization state in the three subpopulations.19 The fact that the patterns of chromatin packaging are consistent within defined pathological subgroups may be considered an indication of functional inter-relationships between nuclear structure and gene expression20 and suggests that chromatin organization is under very tight cellular control and that chromatin phenotype impacts on malignant potential.21 Epigenetic mechanisms such as histone acetylation and methylation are likely to play a major role in determining chromatin pattern. Numerous recent studies have also shown that nuclear architecture, higher order chromatin organization and the topology of chromosomal territories in interphase cells might be involved in gene regulation.22 A comprehensive model for these interactions does not yet exist but as this study shows, nuclear chromatin phenotype provides very specific clues to the underlying pathology and its study is likely to be extremely important in cancer pathobiology.
Karyometry and statistical analysis show the presence of the three subpopulations in flat and cribriform high-grade PIN, the nuclei from the former expressing a higher degree of nuclear abnormality compared to those from the latter. To the best of our knowledge, this is the first investigation documenting differences in cell composition in PIN lesions showing different architectural patterns. Previous studies1, 23, 24 have either tried to identify cell subpopulations or to define subgroups in high-grade PIN, regardless of its architecture.
For instance, Montironi et al23 conducted a morphological and morphometric investigation on the so-called perimeter compartment in high-grade PIN and prostate cancer from cystoprostatectomy specimens of patients with bladder cancer and RP specimens of patients with clinically evident prostate cancer. When image analysis was applied, two subpopulations were identified. In the cystoprostatectomy specimens, there was a greater proportion of nuclei in the subpopulation with lower nuclear and nucleolar area values, compared to the RP specimens in which the nuclei in the subpopulation with higher nuclear and nucleolar area values prevailed. The message put forward in that study was that the distinct subpopulations exist and these might be related to differences in cancer development and aggressiveness. Even though data on the four architectural patterns were not collected due to the small number of cases included in the investigation, the results were somewhat similar to what was found in the current work: high-grade PIN lesions might share the same morphology when examined under the microscope; however, subpopulations can be identified when image analysis is applied.
A study published by Weinstein24 gives further support to the concept of subpopulations of high-grade PIN. This author examined the proliferative indices of benign epithelium, carcinoma as well as noncribriform high-grade PIN that is found in close proximity to carcinoma. It was found that the proliferative index was higher for cancer than for high-grade PIN, and that the latter fell into two distinct subgroups. It was concluded that there may be two types of lesions with the morphological appearance of high-grade PIN and that they may have different biological relationship to carcinoma.
Digital chromatin texture analysis demonstrates that the three subpopulations are also identifiable in the histologically normal appearing secretory epithelium adjacent to high-grade PIN as well as in the co-occurring adenocarcinoma, and that the proportion of nuclei in the three subpopulations reflects that seen in the type of PIN being present.
Recent studies have pointed out that the normal looking prostate epithelium may show some molecular and morphometric changes similar to those detected in the preneoplastic and neoplastic lesions.25, 26, 27 It is worth mentioning a previous study27 in which karyometry was performed on prostatectomy specimens either devoid of PIN and cancer, or with isolated PIN, or with PIN and co-occurring cancer. The nuclei from normal looking epithelium examined in the latter two types of specimens formed three subgroups, one with low nuclear and nucleolar area values, another with nuclear features overlapping those seen in high-grade PIN (most of the PIN cases showed either tufting or micropapillary architecture) and cancer, and another with values intermediate between those of the other two groups. The pathologist, when examining the specimens under the microscope, could not fully appreciate these abnormalities, even though a certain number of nuclei with some nucleolar prominence could be spotted. The conclusion of the study was that the subtle nuclear abnormalities belong the group of malignancy-associated changes, which in turn might be an example of preneoplastic condition.5
In conclusion, karyometry and statistical analysis detect the existence of distinct cell subpopulations of different chromatin packaging and phenotype. The nuclei from the flat high-grade PIN lesions, adjacent normal looking epithelium and co-occurring adenocarcinoma express a greater nuclear abnormality than in the specimens with cribriform high-grade PIN. Further studies are needed to investigate the chromatin organization state in the four major architectural patterns described by Bostwick et al4 and to better understand the clinical relevance and biological implications of our findings.
References
Montironi R, Mazzucchelli R, Algaba F, et al Morphological identification of the patterns of prostatic intraepithelial neoplasia and their importance. J Clin Pathol 2000;53:655–665.
Montironi R, Mazzucchelli R, Scarpelli M . Precancerous lesions and conditions of the prostate: from morphological and biological characterization to chemo prevention. Ann NY Acad Sci 2002;963:169–184.
Montironi R, Mazzucchelli R, Scattoni V, et al. Pathological findings in TRUS prostatic biopsy — diagnostic, prognostic and therapeutic importance. Eur Urol Suppl 2002;1:60–75.
Bostwick DG, Amin MB, Dundore P, et al. Architectural patterns of high-grade prostatic intraepithelial neoplasia. Hum Pathol 1993;24:298–310.
Bostwick DG, Montironi R, Sesterhenn IA . Diagnosis of prostatic intraepithelial neoplasia. Scand J Urol Nephrol. 2000;205 (Suppl):3–10.
Montironi R, Mazzucchelli R, Santinelli A . Prostatic intraepithelial neoplasia and prostate cancer. Panminerva Med 2000;44:213–220.
Cohen RJ, McNeal JE, Baillie T . Patterns of differentiation and proliferation in intraductal carcinoma of the prostate: significance for cancer progression. Prostate 2000;43:11–19.
Sobin LH, Wittekind CH, (eds). TNM Classification of Malignant Tumours, 6th edn. Wiley-Liss: New York, 2002.
Bahr GF, Bartels PH, Bibbo M, et al. Evaluation of the Papanicolaou stain for computer assisted cellular pattern recognition. Acta Cytol 1973;17:106–112.
Keenan S, Diamond J, Mccluggage G, et al. Nuclear chromatin texture in the grading of cervical intraepithelial neoplasia (CIN). Cytometry 2002;11 (Suppl):116A.
Galloway M . Texture analysis using gray level run lengths. Comput Graphics Image Process 1975;4:172–179.
Haralick RM, Shamugam K, Dinstein I . Textural features for image classification. IEEE Trans Man Cybernet 1973;3:610–621.
Young T, Verbeek PW, Mayall B . Characterization of chromatin distributions in cell nuclei. Cytometry 1986;7:467–474.
Bartels PH, Montironi R, Bostwick D, et al. Karyometry of secretory cell nuclei in high-grade PIN lesions. Prostate 2001;48:144–155.
Bartels PH, Olson GB . Computer analysis of lymphocyte images, In: Catsimpoolas N (ed). Methods of Cell Separation. New York: Plenum Press, 1980, pp. 1–99.
Beale EM I . Euclidean cluster analysis. Bull Int Stat Inst 1969;43:21–43.
Kruskal W H, Wallis WA . Use of ranks on one-criterion variance analysis. J Am Stat Assoc 1952;47:583–621 (Addendum: 1953; 48: 907-911).
Bartels PH, Duval da Silva V, Montironi R, et al. Chromatin texture signature in nuclei from prostate lesions. Anal Quant Cytol Histol 1998;20:407–716.
Montironi R, Scarpelli M, Mazzucchelli R, et al. Subvisual changes in chromatin organization state are detected by karyometry in the histologically normal urothelium in patients with synchronous papillary carcinoma. Hum Pathol 2003;34:893–901.
Zini N, Trimarchi C, Claudio PP, et al. pRb2/p130 and p107 control cell growth by multiple strategies and in association with different compartments within the nucleus. J Cell Physiol 2001;189:34–44.
Ranger-Moore J, Bozzo P, Alberts D, et al. Karyometry of nuclei from actinic keratosis and squamous cell cancer of the skin. Anal Quant Cytol Histol 2003; 25:353–361.
Cremer T, Cremer C . Chromosome territories, nuclear architecture and gene regulation in mammalian cells. Nat Revi (Genet) 2001;2:292–301.
Montironi R, Mazzucchelli R, Santinelli A, Scarpelli M, Lòpez Beltran A, Bostwick DG . The nuclear and nucleolar size and proliferation index of prostate cancer and high-grade PIN in cystoprostatectomies are lower than in radical prostatectomies. Virchows Archiv, (submitted for publication).
Weinstein MH . Digital image analysis of proliferative index: two distinct population of high-grade prostatic intraepithelial neoplasia in close proximity to adenocarcinoma of the prostate. Hum Pathol 1998;29:620–626.
Colanzi P, Santinelli A, Mazzucchelli R, Pomante R, et al. Changes in the normal-looking epithelium with PIN or cancer. Adv Clin Pathol 1999;3:129–134.
Montironi R, Hamilton PW, Scarpelli M, et al. Subtle morphological and molecular changes in the normal-looking epithelium in prostates with prostatic intraepithelial neoplasia or cancer. Eur Urol 1999;35:468–473.
Montironi R, Longatto Filho A, Santinelli A, et al. Nuclear changes in the normal-looking columnar epithelium adjacent to and distant from prostatic intraepithelial neoplasia and prostate cancer. Morphometric analysis in whole-mount sections. Virchows Arch 2000;437:625–634.
Acknowledgements
This research has been supported by grants from the Polytechnic University of the Marche Region (Ancona) (MS), and the Italian Ministry of University and Scientific Research (RM, 2003) and, in part, by a grant from the National Cancer Institute, CA 53877-13 (PHB). The content of this paper is solely the responsibility of the authors and does not necessarily represent the official views of the Polytechnic University of the Marche Region (Ancona) (Italy), and the National Cancer Institute (USA). We wish to thank Dr James Ranger-Moore (College of Public Health, Arizona Cancer Center, University of Arizona, AZ, USA) for his contribution to statistical analysis.
Author information
Authors and Affiliations
Corresponding author
Rights and permissions
About this article
Cite this article
Montironi, R., Thompson, D., Scarpelli, M. et al. Karyometry detects subvisual differences in chromatin organization state between cribriform and flat high-grade prostatic intraepithelial neoplasia. Mod Pathol 17, 928–937 (2004). https://doi.org/10.1038/modpathol.3800142
Received:
Revised:
Accepted:
Published:
Issue Date:
DOI: https://doi.org/10.1038/modpathol.3800142
Keywords
This article is cited by
-
Prediction of non-muscle invasive bladder cancer recurrence using machine learning of quantitative nuclear features
Modern Pathology (2022)
-
Use of 1,25α dihydroxyvitamin D3 as a cryosensitizing agent in a murine prostate cancer model
Prostate Cancer and Prostatic Diseases (2011)
-
Quantitative nuclear texture features analysis confirms WHO classification 2004 for lung carcinomas
Modern Pathology (2006)
