
Introduction
New methods from molecular biology have the potential to change medicine fundamentally. However, for the time being there is a substantial gap between fiction and clinical reality, especially in the field of oncology.
‘Cancer is clearly a disease of the genes’,1 therefore genetic markers – in the most general sense – receive special attention in oncology and specifically in leukemia research. To assess the prognostic and therapeutic relevance of new parameters information from different sources must be integrated: results from molecular biology and clinical information such as follow-up data, to determine which of the many possible parameter constellations, are related to relevant medical outcomes like patient survival time or quality of life.
Despite the obvious advantages of integrated databases covering all relevant clinical and research aspects of leukemia there is no comprehensive software product on the market because of severe methodological problems.
Results from different laboratory procedures are typically stored in separate databases; new experimental parameters especially are handled in dedicated research systems.
For statistical evaluation all records concerning a particular patient must be linked. In the context of large data sets and a larger quantity of data sources, integration can be a challenging and time-consuming task. Common problems are documentation inaccuracies, misspellings of names and incompatibilities of data structures.
In the context of a nationwide German leukemia research project (‘Kompetenznetz: Akute und Chronische Leukämien’) we designed, implemented and evaluated a comprehensive research database which was integrated into the routine workflow of a large clinical laboratory serving as a national reference center. All important modalities were taken into account: cytomorphology, cytogenetics, molecular genetics, fluorescence in situ hybridization (FISH) and immunophenotyping; altogether several hundred parameters per patient had to be handled. The overall objective was to provide an integrated database serving both for routine diagnostics and research purposes, which is – from our point of view – the direction we should go in the future.
In the next sections we present more details on our approach, the results we have obtained so far and challenges to be addressed in the future.
Computer system
We applied state-of-the-art Internet technology to build the integrated database: a Linux server (http://www.suse.de) provides an Apache web server (http://www.apache.org) and a SQL database, which is accessed by means of server-side PERL2 programs.
A dedicated software tool3,4,5 was applied for rapid implementation of ergonomic, highly adaptive web forms. A standard web browser at the client side (eg Netscape Communicator or Internet Explorer) is sufficient to use the system. All programs are generated from templates by the tool set mentioned above, ie no line of code is programmed manually.
We applied an iterative software engineering approach to specify the detailed data structure. Regular user meetings were held; after approximately 20 iteration cycles a suitable database structure was defined.
To embed the system into the routine workflow of the laboratory, word processing documents for written reports as well as adhesive labels for probes are generated directly from the database by means of templates which are completed with the appropriate item values.
A very difficult task has been the integration of preexisting records of all laboratory modalities and clinical information covering approximately 5 years of operation.
Cytogenetics, cytomorphology and FISH data were exported from a Windows-based desktop database application (Cybase from MetaSystems; built with Paradox). Data were adjusted to the new schema by means of a PERL-program. Records from other modalities (molecular genetics, immunophenotyping) as well as clinical information (follow-up) were provided in the form of Microsoft Excel files, which were converted to the new database by PERL programs.
The problems associated with matching of data for statistical purposes were one of the main incentives for building the integrated database. To enable patient-specific evaluations, surname, first name, date of birth and laboratory number were used as matching criteria. We considered applying probabilistic matching techniques,6 but finally decided to verify questionable records manually to ensure correct assignment by means of lists of unmatched as well as similar cases (eg same date of birth, but different surname).
Laboratory methods
The International System for Human Cytogenetic Nomenclature7 was applied to document the karyotype of leukemic cells and its aberrations. Cytogenetic analysis was performed according to established standards.8
Molecular genetics applies polymerase chain reaction (PCR) as well as Southern blot for detection of gene rearrangements and other gene mutations9,10,11 and real time PCR12 was performed for minimal residual disease detection13,14 and detection of point mutations.15 Microarray data was collected from Affymetrix Genechip(R) (http://www.affymetrix.com). Cytomorphological findings were supplemented as well as fluorescence in situ hybridization.16,17
Immunophenotyping was applied according to standard procedures.18
The integrated leukemia database
A multi-user database with a web frontend consisting of eight main modules was established:
-
1
patient demographics and follow-up (see Figure 1);
Figure 1 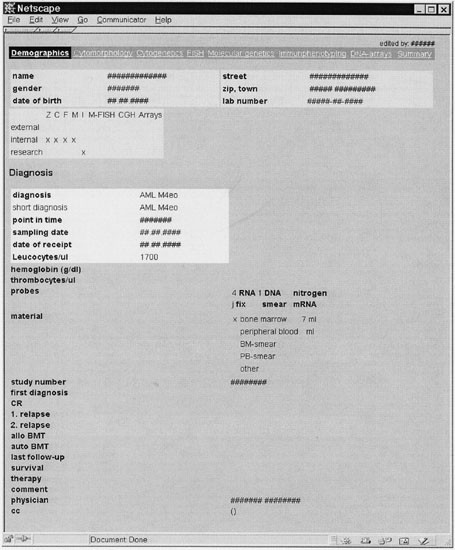
Demographic and follow-up data of the patient (translated to English). Important items are precise diagnosis, leukocyte count, available material, date of diagnosis, survival time. The navigation bar provides access to the eight main modules of the system (demographics, cytomorphology, cytogenetics, FISH, molecular genetics, immunophentyping, DNA arrays, summary report).
-
2
cytomorphology;
-
3
cytogenetics (see Figure 2);
Figure 2 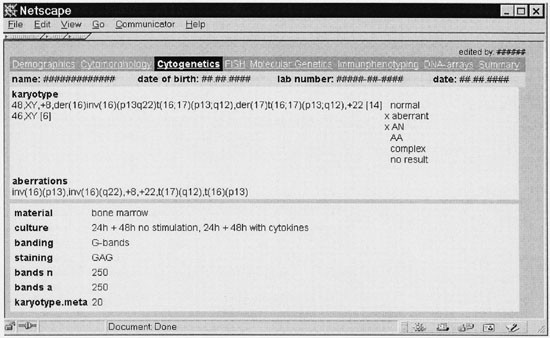
Cytogenetic module of the leukemia database (translated to English). The karyotype and its aberrations as well as technical parameters are presented.
-
4
FISH;
-
5
molecular genetics (see Figure 3);
Figure 3 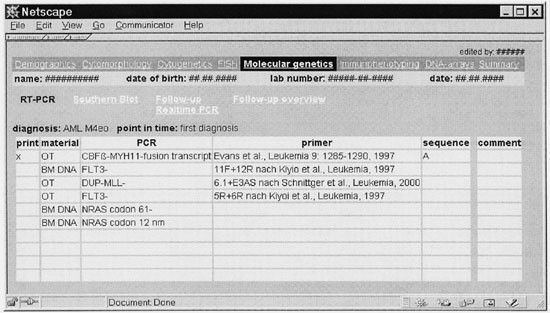
Molecular genetics module of the leukemia database (translated to English). PCR results during first diagnosis are shown. In addition, an overview of follow-up data can be generated.
-
6
immunophenotyping (see Figure 4);
Figure 4 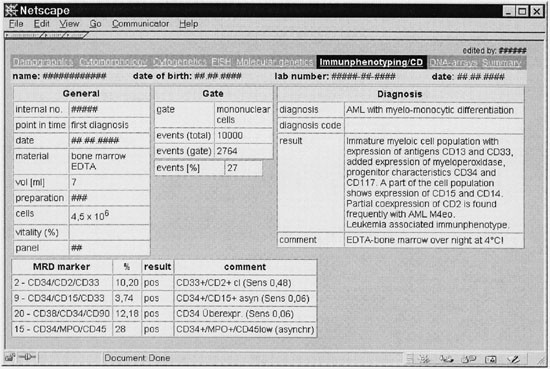
Small section from the immunophentyping module of the leukemia database (translated to English). Administrative information (eg type of material), gate parameters, precise diagnosis and MRD marker are provided.
-
7
microarray data; and
-
8
summary report.


To integrate the system into the routine workflow a German frontend was required, including functions for administrative purposes (eg billing). To ensure patient data security the system was protected by a firewall. An English version of the core data structure of all seven modules is available on the Internet in XML-format (http://www.w3.org/XML) from http://mdplot.ibe.med.uni-muenchen.de. We want to provide a framework for international standardization of data models in the field of leukemia research and welcome comments from other researchers. If other research groups build databases compatible with this core data set, pooled analyses are feasible.
To date the system contains information on 9415 cases from 5663 patients (March 2001). The leukemia laboratory of the University of Munich acts as a nationwide reference center, therefore patient data from 1026 physicians located at 244 hospitals are available online.
The data structure – including internal and administrative items – consists of 15 tables and altogether 888 (!) variables. For each probe 15 cytogenetic items, 10 PCR markers, 10 FISH probes, 8 MRD markers, 72 immunphenotype measurements and one set of microarray data (binary large object) can be stored; most parameters can be customized by the user. Several probes per patient can be managed; for each sample all procedures can be documented.
To assure quality of documentation the identity of the persons who enter data is recorded automatically for each form.
Besides standard documents for every single method which are printed and sent to physicians, the database allows various search strategies, for example:
-
create a file with all patients having AML M2 and t(8;21) and follow-up data in real time PCR demonstrating therapy success, or
-
determine new aberrations in specific leukemia subtypes, or
-
correlate cytogenetic findings to morphology, molecular biology, immunphenotyping or microarray data and vice versa, or
-
combine information of diagnostic results with survival data and transfer them to a standard statistic program
Success factors: fine tuning and adaptive data entry
In a research environment, where current classifications tend to be updated frequently, it is very difficult to maintain coded data entry which is required for reliable statistical evaluations.
In this context we enabled the user to update the classification categories to ensure sufficient flexibility. All forms are highly customizable by the user to enable flexible documentation. The content of certain pull-down menus can be adjusted as needed to address the permanent progress in molecular biology generating eg new PCR primers. In the field of immunophenotyping especially the parameters (ie antibodies) and methods change frequently, therefore the documentation scheme can be updated by the user.
The overall goal is to store complete and comprehensible information: what parameter was measured according to what method at what time for which patient by whom using which material?
To support the generation of summary reports, text blocks can be adapted individually.
Data monitoring and analysis of a complex database
By integration of heterogeneous data sources the complexity of the system is growing substantially. It is important to keep an overview of the system – in terms of completeness and correctness – to avoid bias and imprecise results during statistical evaluation.
To provide an overview not only on the structure, but also on the available content, we designed a web-based data mining tool which visualizes the number of non-missing values by class and by item. This tool has been applied to other medical domains19 and is available on the Internet from http://mdplot.ibe.med.uni-muenchen.de/.
Figure 5 provides detailed information on the cytogenetics data (for further information on this kind of analysis see Ref. 19).

Detailed information on the cytogenetics data. For each item the number of non-missing values is provided. Item type: c, categorical; n, numerical, t, text; o, other.
This web-based data mining tool enables the identification of variables, which are suitable for statistical evaluation and helps to avoid bias due to missing values.
Statistical analysis was performed with standard software packages (http://www.spss.com). Because follow-up data from the AML-CG20 study were included into the database we were able to confirm the prognostic relevance of specific cytogenetic or molecular genetic anomalies.11,21,22,23,24,25
The detection of new chromosomal aberration patterns is supported by a specific program providing frequency distributions of chromosome breakage points ordered by disease.
Impact of integrating clinical and genetic data
The rapid progress during the past years in the field of molecular biology in general and particularly in genomics is a major driving force in the evolvement of the new discipline Bioinformatics. There is, however, a substantial gap between genomics and proteomics on the one hand and progress in clinical medicine on the other. To identify genetic patterns which are relevant to patients in general, genomic data – in the most general sense – must be linked with clinical data in the context of large clinical trials. The following basic question must be answered for any diagnostic parameter: Is it relevant to the patient?
To speed up the knowledge transfer from molecular biological research into clinical practice, prognostic relevant variables, ie parameters that are highly correlated with important medical outcomes like patient survival, must therefore be distinguished from surrogate markers. For this reason a close co-operation between Medical Informatics and Bioinformatics is Important, as stated by Kohane,26 Altman27 and Miller.28 Biomedical databases are characterized by complex and dynamic data structures. Formalization of medical facts is a well-known, non-trivial problem.29 More than 800 variables per patient were needed for the leukemia database. The effort required for system design is characterized not only by the number of items but also by the intensive fine tuning of the system.
The integration of clinical and genetic data generates new scientific results; some examples in the field of leukemia research are provided in Refs11,21,22,23,24,25
Integration of clinical and scientific documentation requires significant efforts, but is feasible and provides better data quality and therefore faster research results. Before the integrated database was available, we lost up to 50% of cases when we combined several data sources automatically due to mismatch of patient demographic data and other inconsistencies.
Now comprehensive reports on data quality are possible; this is very important to manage the content of the system: missing or presumably wrong values can be identified and corrected in time. One might argue, by means of range and cross checks, that data quality should be enforced during data entry. In the context of workflow integration, this is not recommendable, because often intermediate results have to be stored.
Adaptive and highly customizable data entry is a key success factor for bioinformatic systems. Forms consisting of up to a hundred items cannot be filled in manually from scratch. Therefore, intelligent methods to speed up the data entry process must be implemented – for example, adjustable default values, customizable text blocks and interfaces to technical devices.
By means of precise documentation, for example new chromosome aberrations30 can be detected earlier providing important insights into genetic pathways.1
The need for international standards
Obviously our approach is focused on the needs of a specific national laboratory and cannot be simply copied to another leukemia research institution.
In the context of an epidemiological study on leukemia we collected anonymous records from all over Germany and recognized the wide range of varying data structures imposing severe problems on building a common database. Therefore, great efforts must be undertaken by the medical community to standardize the documentation.
An integrated leukemia database handles approximately five times more variables than a patient administration system of a hospital, therefore a professional software product is required.
Medical standards for documentation of leukemia are urgently needed which provide flexibility, to handle progress in research, and at the same time precision, to enable sound statistical analysis. This challenge can only be addressed by interdisciplinary collaboration between clinical and research hematologists in co-operation with medical informatics professionals and bioinformaticians.
Future directions
Genetic and gene expression profiles generated by microarray analysis are an important focus of ongoing research. With this technique Alizadeh et al31 and Hedenfall et al32 demonstrated recently that new disease entities can be characterized by distinct genetic pathways. The number of patients involved is very limited so far. Integrated analysis of clinical and genetic data will contribute in improving the understanding of leukemia's biology on a molecular level.
References
DePinho RA . The age of cancer Nature 2000 408: 248
Wall L, Schwartz R . Programming PERL. O'Reilly & Associates Inc : Sebastopol, CA, USA 1992
Dugas M . Clinical applications of Intranet-Technology. In: Dudeck J et al (eds) New Technologies in Hospital Information Systems vol. 45: IOS Press: Amsterdam 1997 pp 115–118
Dugas M, Bosch R, Paulus R, Lenz T . Intranet-based multi-purpose medical records in orthopedics Med Informatics 1999 24: 269–275
Dugas M, Überla K . Intranet based clinical workstations. In: Victor N et al (eds) Medical Informatics, Biostatistics and Epidemiology for Efficient Health Care and Medical Research Urban und Vogel: München 1999 pp 235–238
Kendrick SW, Douglas MM, Gardner D, Hucker D . Best-link matching of Scottish health data sets IMIA Yearbook 1999 Schattauer Verlag: Stuttgart 1999 pp 405–409
ISCN . In: Mitelman F (ed.). Guidelines for Cancer Cytogenetics. Supplement to: An International System for Human Cytogenetic Nomenclature S Karger: Basel 1995
Schoch C, Haase D, Haferlach T et al. Incidence and implication of additional chromosome aberrations in acute promyelocytic leukaemia with translocation t(15;17)(q22;q21): a report on 50 patients Br J Haematol 1996 94: 493–500
Schnittger S, de Sauvage FJ, Le Paslier D, Fonatsch C . Refined chromosomal localization of the human thrombopoietin gene to 3q27-q28 and exclusion as the responsible gene for thrombocytosis in patients with rearrangements of 3q21 and 3q26 Leukemia 1996 10: 1891–1896
Schnittger S, Wormann B, Hiddemann W, Griesinger F . Partial tandem duplications of the MLL gene are detectable in peripheral blood and bone marrow of nearly all healthy donors Blood 1998 92: 1728–1734
Schnittger S, Kinkelin U, Schoch C et al. Screening for MLL tandem duplication in 387 unselected patients with AML identify a prognostically unfavorable subset of AML Leukemia 2000 14: 796–804
Schoch R, Jenisch S, Haferlach T et al. Glass slide smears are a suitable source for RT-PCR-based analysis of chromosomal aberrations in leukaemias Br J Haematol 1996 92: 140–142
Haferlach T . Quantitative reverse transcriptase-polymerase chain reaction in AML with t(8;21)(q22;q22) Leuk Res 2001 25: 55–56
Emig M, Saussele S, Wittor H, Weisser A, Reiter A, Willer A, Berger U, Hehlmann R, Cross NC, Hochhaus A . Accurate and rapid analysis of residual disease in patients with CML using specific fluorescent hybridization probes for real time quantitative RT-PCR Leukemia 1999 13: 1825–1832
Nakao M, Janssen JW, Seriu T, Bartram CR . Rapid and reliable detection of N-ras mutations in acute lymphoblastic leukemia by melting curve analysis using LightCycler technology Leukemia 2000 14: 312–315
Haferlach T, Winkemann M, Loffler H et al. The abnormal eosinophils are part of the leukemic cell population in acute myelomonocytic leukemia with abnormal eosinophils (AML M4Eo) and carry the pericentric inversion 16: a combination of May–Grunwald-Giemsa staining and fluorescence in situ hybridization Blood 1996 87: 2459–2463
Haferlach T, Loffler H, Nickenig C et al. Cell lineage specific involvement in acute promyelocytic leukaemia (APL) using a combination of May–Grunwald-Giemsa staining and fluorescence in situ hybridization techniques for the detection of the translocation t(15;17)(q22;q12) Br J Haematol 1998 103: 93–99
Ludwig WD, Rieder H et al. Immunophenotypic and genotypic features, clinical characteristics, and treatment outcome of adult pro-B acute lymphoblastic leukemia: results of the German multicenter trials GMALL 03/87 and 04/89 Blood 1998 92: 1898–1909
Dugas M, Hoffmann E, Janko S, Hahnewald S, Matis T, Miller J, v Bary Ch, Farnbacher A, Vogler V, Überla K . Complexity of biomedical data models in cardiology: the Intranet-based Atrial Fibrillation Registry Comp Meth Prog Biomed 2001 (in print)
Büchner T, Hiddemann W et al. Double induction strategy for acute myeloid leukemia: the effect of high-dose cytarabine with daunorubicin and 6-thioguanine: a randomized trial by the German AML Cooperative Group Blood 1999 93: 4116–4124
Haferlach T, Bennett JM, Loffler H et al. Acute myeloid leukemia with translocation (8;21). Cytomorphology, dysplasia and prognostic factors in 41 cases. AML Cooperative Group and ECOG Leuk Lymphoma 1996 23: 227–234
Kern W, Schoch C, Haferlach T et al. Multivariate analysis of prognostic factors in patients with refractory and relapsed acute myeloid leukemia undergoing sequential high-dose cytosine arabinoside and mitoxantrone (S-HAM) salvage therapy: relevance of cytogenetic abnormalities Leukemia 2000 14: 226–231
Schoch C, Haase D, Haferlach T et al. Fifty-one patients with acute myeloid leukemia and translocation t(8;21)(q22;q22): an additional deletion in 9q is an adverse prognostic factor Leukemia 1996 10: 1288–1295
Schoch C, Haase D, Fonatsch C et al. The significance of trisomy 8 in de novo acute myeloid leukaemia: the accompanying chromosome aberrations determine the prognosis. German AML Cooperative Study Group Br J Haematol 1997 99: 605–611
Schoch C, Haferlach T, Haase D et al. Patients with de novo acute myeloid leukaemia and complex karyotype aberrations show a poor prognosis despite intensive treatment: a study of 90 patients Br J Haematol 2001 112: 118–126
Kohane IS . Bioinformatics and clinical informatics – the imperative to collaborate JAMIA 2000 7: 512–516
Altman RB . The interactions between clinical informatics and bioinformatics JAMIA 2000 7: 439–443
Miller PL . Opportunities at the intersection of bioinformatics and health informatics: a case study JAMIA 2000 7: 431–438
Moormann PW, van Ginneken AM, van der Lei J, van Bemmel JH . A model for structured data entry based on explicit descriptional knowledge Meth Inform Med 1994 33: 454–463
Schoch C, Bursch S, Kern W, Schnittger S, Hiddemann W, Haferlach T . Gain of an isochromosome 5p: a new recurrent chromosome abnormality in acute monoblastic leukemia Cancer Genet Cytogenet 2001 (in press)
Alizadeh AA, Eisen MB, Davis RE et al. Distinct types of diffuse large B-cell lymphoma identified by gene expression profiling Nature 2000 403: 503–511
Hedenfalk I, Duggan D, Chen Y et al. Gene-expression profiles in hereditary breast cancer N Engl J Med 2000 344: 539–548
Acknowledgements
This work was supported by a grant from the German Ministry of Education and Research (BMBF), Kompetenznetz: Akute und Chronische: Leukämien – 01 GI 9980/6 and by a grant from ‘Deutsche José Carreras Stiftung e.V’.
Author information
Authors and Affiliations
Rights and permissions
About this article
Cite this article
Dugas, M., Schoch, C., Schnittger, S. et al. A comprehensive leukemia database: integration of cytogenetics, molecular genetics and microarray data with clinical information, cytomorphology and immunophenotyping. Leukemia 15, 1805–1810 (2001). https://doi.org/10.1038/sj.leu.2402301
Received:
Accepted:
Published:
Issue Date:
DOI: https://doi.org/10.1038/sj.leu.2402301
This article is cited by
-
New insights into MLL gene rearranged acute leukemias using gene expression profiling: shared pathways, lineage commitment, and partner genes
Leukemia (2005)
-
Pediatric acute lymphoblastic leukemia (ALL) gene expression signatures classify an independent cohort of adult ALL patients
Leukemia (2004)
-
The German competence network ‘Acute and chronic leukemias’
Leukemia (2004)
