
Figures, tables and video
From the following article
Role of cerebral cortex in the control of swallowing
Shaheen Hamdy
GI Motility online (2006)
doi:10.1038/gimo8
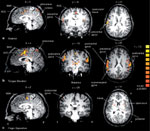
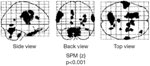
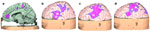
Figure 3
Magnetoencephalography data co-registered with magnetic resonance images.
Full size figure and legend (48K)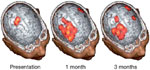
Figure 4
Transcranial magnetic stimulation (TMS) topographic maps superimposed on MRI images.
Full size figure and legend (46K)
Table 1
Summary of the main cortical and sub-cortical activations associated with swallowing, as identified by functional brain imaging studies.
Full size table and legend