
Figures, tables and video
From the following article
Clinical disorders of the upper esophageal sphincter
Ian J. Cook
GI Motility online (2006)
doi:10.1038/gimo37
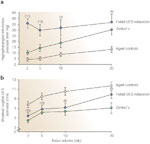
Figure 1
Intrabolus pressure and maximal sagittal upper esophageal sphincter (UES) diameter expressed as a function of swallowed bolus volume.
Full size figure and legend (85K)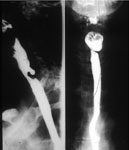
Figure 2
Barium radiographs of a typical posterior pharyngeal (Zenker's) diverticulum.
Full size figure and legend (54K)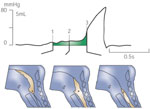
Figure 3
Hypopharyngeal intrabolus pressure is an indirect measure of UES compliance.
Full size figure and legend (50K)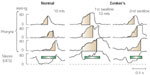
Figure 4
Example of increased hypopharyngeal intrabolus pressure in a patient with Zenker's diverticulum compared with a normal on the left.
Full size figure and legend (53K)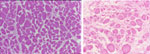
Figure 5
Normal cricopharyngeus muscle (left) compared to that from a patient with Zenker's (right).
Full size figure and legend (54K)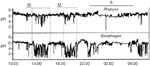
Figure 6
Tracing derived from an ambulatory dual (esophageal, pharyngeal) pH study.
Full size figure and legend (45K)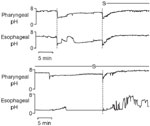
Figure 7
Two examples from the same patient, showing different patterns of regurgitation.
Full size figure and legend (33K)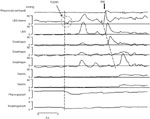
Figure 8
Example of esophagopharyngeal regurgitation captured during prolonged manometric and dual pH recording.
Full size figure and legend (89K)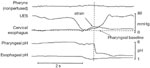
Figure 9
Example of esophagopharyngeal acid regurgitation occurring during a transient UES relaxation, but aided by strain.
Full size figure and legend (34K)
Table 1
Neurological lesions causing failed upper esophageal sphincter (UES) relaxation5
Full size table and legend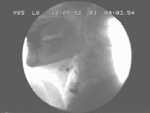
Video 1
Videoswallow and corresponding manometric traces from a patient with mild dysphagia and failed UES relaxation due to syringobulbia.
Full size video and legend (0K)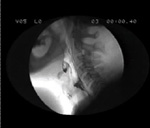
Video 2
Example of videoswallow and concurrent manometric tracing from a patient with severe dysphagia secondary to lateral medullary infarction causing failed UES relaxation and marked pharyngeal weakness.
Full size video and legend (0K)