
Figures, tables and video
From the following article
Richard H. Holloway
GI Motility online (2006)
doi:10.1038/gimo30
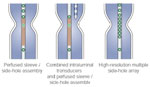
Figure 1
Schematic representation of various options for manometric recording configurations for pharyngoesophageal manometry.
Full size figure and legend (50K)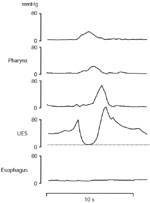
Figure 2
Normal upper esophageal sphincter (UES) relaxation recorded by a sleeve–side-hole assembly.
Full size figure and legend (27K)
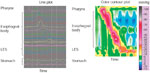
Figure 4
An example of a normal esophageal response to a water swallow displayed as a conventional line plot (left panel) and as a colored topographical plot (right panel).
Full size figure and legend (101K)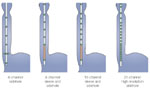
Figure 5
Schematic representation of several configurations for esophageal manometric assemblies.
Full size figure and legend (26K)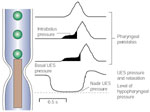
Figure 6
Schematic depiction of the various elements of pharyngoesophageal motility analysis.
Full size figure and legend (47K)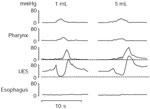
Figure 7
Recording of pharyngoesophageal motility in a patient with dysphagia due to a cricopharyngeal bar.
Full size figure and legend (30K)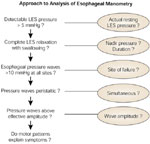
Figure 8
Schematic representation of an approach to the analysis of esophageal manometric recordings.
Full size figure and legend (80K)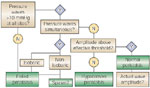
Figure 9
Schematic representation of an approach to the analysis of esophageal body motility.
Full size figure and legend (23K)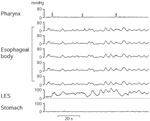
Figure 10
Representative recording of esophageal motility from a patient with achalasia.
Full size figure and legend (48K)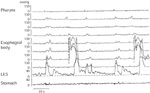
Figure 11
Representative recording of esophageal motility from a patient with diffuse esophageal spasm. Note the simultaneous pressure in the midesophagus.
Full size figure and legend (64K)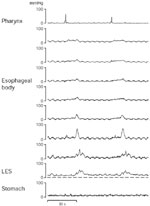
Figure 12
Representative recording of esophageal motility from a patient with a nonspecific esophageal motor disorder.
Full size figure and legend (59K)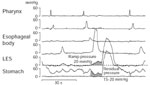
Figure 13
Representative recording of esophageal motility from a patient with an isolated abnormality of lower esophageal sphincter (LES) relaxation.
Full size figure and legend (39K)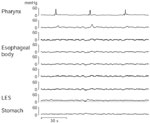
Figure 14
Representative recording of esophageal motility from a patient with scleroderma.
Full size figure and legend (44K)