
Abstract
Despite recent advances in sequencing technology and large-scale drug screenings employing hundreds of cell lines, the predictive accuracy of mutation-based biomarkers is still insufficient as a guide for cancer therapy. Therefore, novel types of diagnostic methods using alternative biomarkers would be highly desirable. We have hypothesized that sensitivity-specific changes in the phosphorylation of signaling molecules could be useful in this respect. Here, with the aim of developing a method for predicting the response of cancers to cisplatin using a combination of specific biomarker(s) and patient-derived tumor organoids (PDOs), we found that cisplatin-sensitive cell lines or PDOs showed enhanced phosphorylation of c-Jun (p-c-Jun) within 24 h after cisplatin treatment. We also compared the responses of 6 PDOs to cisplatin with the therapeutic effect of neoadjuvant chemotherapy (docetaxel/cisplatin/5-fluorouracil) in 6 matched patients. Mechanistically, the c-Jun induction was partly related to TNF signaling induced by cisplatin. Our data suggest that enhanced phosphorylation of c-Jun in response to cisplatin treatment could be a predictive biomarker for the efficacy of cisplatin in selected cancer patients.
Introduction
Prediction of therapeutic outcome in cancer patients is important because of the wide variation of drug efficacy among individuals. Large-scale drug screening and sequencing technology has facilitated the development of methods for predicting the clinical efficacy of a number of anti-cancer drugs1,2. However, predictive accuracy based on genetic mutations is still limited3 and novel types of diagnostic methods are still needed.
Patient-derived tumor organoids (PDOs) are three-dimensional (3D) tumor cell cultures derived from human-tumor tissues4,5. PDOs can potentially offer great benefits as a preclinical cancer model because they closely recapitulate the morphological and genetic features of matched original tumor tissues6,7,8,9,10,11,12,13,14. Furthermore, the success rates for establishment of PDOs are generally higher than those of traditional 2D cell lines for various tumor types15.
To develop novel diagnostic methods, we have focused on sensitivity-associated changes in signal transduction after drug treatment and proposed that such changes could be used as predictive biomarkers. Previously, we have reported one such example, in which reduced phosphorylation of ribosomal protein S6 (pS6) after a treatment with MEK inhibitor was well associated with the sensitivity of gastric and colon cancer cells to the inhibitor16,17. With the combined use of PDOs, we have speculated that this change in pS6 after MEK inhibition might be applicable as a predictive biomarker for the efficacy of MEK inhibitors16.
Cisplatin is widely used for the treatment of various tumors, such as gastric, esophageal, colorectal, lung, ovary and bladder cancers, but prediction of its efficacy based on genomic or transcriptomic information is still not satisfactory18,19,20. Therefore, in the present study, we explored predictive biomarker(s) for cisplatin sensitivity by investigating the correlation between the phosphorylation status of signaling molecules after cisplatin treatment and cisplatin sensitivity. To evaluate whether the identified predictive biomarker(s) detectable in PDOs were sensitivity-specific, we established PDOs from gastric (GC) and esophageal (EC) cancers, and then analyzed the association between sensitivity to cisplatin and cellular responses in the PDOs after cisplatin treatment.
Materials and methods
Patients
Establishment of PDOs was approved by all the patients concerned and by Oita University ethics committee (Approval No. 1495 and 1496). Patient information is provided in Table 1. For GC PDOs, surgically resected tissues or endoscopic biopsy samples from patients with advanced GC were used. For EC PDOs, endoscopic biopsy samples from patients who were scheduled to receive DCF-NAC followed by surgery were used.
Cell lines
We used 20 gastric cancer cell lines for which details on resources, culture conditions and characterization were in our previous study17. All the cell lines were grown for several passages within one month of receipt from the providers, and aliquots of each were frozen. They were authenticated by short tandem repeat analysis in November 2014 as described previously17.
Establishment of c-Jun-knockout cells
Knockout of c-Jun in TMK-1 and NUGC-3 cells was achieved using the CRISPR/Cas9 system in accordance with the previous report by Ran et al.21. pSpCas9(BB)-2A-Puro (PX459) was a gift from Prof. Feng Zhang (Addgene plasmid # 48139; http://n2t.net/addgene:48139; RRID:Addgene_48139). The guide RNA targeting c-Jun (5ʹ-CCATAAGGTCCGCTCTCGGA-3ʹ) was inserted into pSpCas9(BB)-2A-Puro and the resulting plasmid was transfected into TMK-1 and NUGC-3. One day after the transfection, the plasmid-positive cells were enriched by medium containing 2 µg/ml puromycin for 48 h and then cloned by the limited dilution method. Control cells for the knockout experiments were cloned in the same way as the knockout cells except for the use of non-targeting pSpCas9(BB)-2A-Puro.
Cisplatin sensitivity assay for cell lines
Cells were seeded at densities of 2–10 × 103 cells /well in 96-well plates, depending on their growth speed, to reach subconfluency at 96 h after plating. After seeding, cells were incubated for 24 h and then treated with normal saline or cisplatin (Pfizer Inc, New York, NY, USA), which was diluted with culture medium to concentrations of 0.1, 1, 5, 10 and 20 µM, for 72 h. The growth inhibitory effect of cisplatin was analyzed by CellTiter96 aqueous one solution cell proliferation assay (Promega, Madison, WI, USA) in triplicate. IC50 values were calculated using the linear relationship between the percentage inhibition and concentration.
Patient-derived tumor organoids (PDOs)
Organoids from GC and EC tissues were established as reported previously with some modifications7,9,22,23. For PDOs from GC tissues, endoscopic biopsy or surgical specimens from primary tissues were minced into 0.5-mm3 fragments using scalpels and washed three times with cold wash medium (DMEM (Thermo Fisher Scientific, Waltham, MA, USA) supplemented with 1% FCS and 1% penicillin/ streptomycin). Then, tissue fragments were digested with a digestion solution containing 0.125 mg/ml collagenase XI (Cat#C9407, Sigma-Aldrich, Irvine, UK) and 0.125 mg/ml dispase II (Thermo Fisher Scientific) in wash medium, at 37 °C for 45 min with shaking. Supernatants were transferred to a new 15-ml tube and centrifuged at 300 x g at 4 °C for 20 min after addition of the cold wash medium to increase the volume to 12 ml. Collected epithelial cells were embedded in 1:2 mixture of wash medium and growth factor-reduced Corning Matrigel (Corning, NY, USA) and placed as 20-µl droplets in a multi-well plate. Basically, we seeded 6 droplets per well in a 12-well plate and overlaid them with 1 ml of gastric cancer medium containing advanced DMEM/F12 (Thermo Fisher Scientific) supplemented with 50% Wnt conditioned medium (MTA for the producer cell line was obtained from the Hubrecht Institute, the Netherlands), 10% R-spondin1-conditioned medium (Trevigen, Gaithersburg, MD, USA), 10% noggin-conditioned medium (MTA for the producer cell line was obtained from the Hubrecht Institute, the Netherlands), 1xB27 (Thermo Fisher Scientific), 1 mM nicotinamide (Sigma-Aldrich), 1.25 mM N-acetylcysteine (Sigma-Aldrich), 1 µM A83-01 (Sigma-Aldrich), 100 ng/ml recombinant human EGF (PeproTech, London, UK), 5 nM gastrin I (Tocris Bioscience, Bristol, UK), 50 ng/ml recombinant human FGF10 (Tocris Bioscience), and 100 µg/ml Primocin (InvivoGen, San Diego, CA, USA). The medium was changed every 2 days. Cultures were disrupted with TrypLE (Thermo Fisher Scientific) and split at a ratio of 1:2 to 1:4 once every 6-10 days depending on the growth speed of each PDO.
For PDOs from EC tissues, endoscopic biopsies were minced into 0.5-mm3 fragments using scalpels and washed three times with cold wash medium. The tissue fragments were then incubated with 10 U/ml dispase II (Thermo Fisher Scientific) at room temperature for 10 min. After incubation, the fragments were washed with cold PBS and digested with TrypLE at 37 C for 10 min with mixing at 750 rpm on a ThermoMixer C (Eppendorf, Humburg, Germany). After digestion, remaining tissue fragments were allowed to settle, and the supernatants were transferred to a new 15-ml centrifuge tube containing wash medium. The remaining tissue fragments were digested, and the supernatants were transferred again to the same 15-ml tube. The supernatants were centrifuged at 300 × g at 4 °C after addition of cold wash medium to increase the volume to 12 ml. Collected epithelial cells were embedded in a 1:2 mixture of wash medium and Matrigel, and placed as droplets as described above. PDOs of ECs in a 12-well plate were overlaid with 1 ml of EC medium containing advanced DMEM/F12 supplemented with 10% R-spondin 1-conditioned medium, 10% noggin-conditioned medium, 1xB27, 1 mM nicotinamide, 1.25 mM N-acetylcysteine, 0.5 µM A83-01, 100 ng/ml recombinant human EGF, 10 nM gastrin I, and 100 µg/ml Primocin. The medium was changed every 2 days. Cultures were disrupted with TrypLE and split at a ratio of 1:2 to 1:4 once every 6–10 days depending on growth speed.
Cisplatin sensitivity assay for patient-derived tumor organoids
Before the drug sensitivity assay, organoids were disrupted with TrypLE and cultured at higher density than usual passage (1:1 or less) in a 12-well plate. Three days after plating, organoids were collected from Matrigel by treatment with 1 ml of 0.2% dispase II at 37 °C for 5 min. After washing with wash medium, the organoids were filtered using a 70-µm cell strainer (Greiner Bio One, Frichenhausen, Germany), and then organoids that passed through the filter were filtered again using a 15-µm cell strainer (pluriSelect, Leipzig, Germany). The trapped organoids were collected with 2-5 ml of wash medium, counted, centrifuged and resuspended in organoid medium containing 10% Matrigel and cisplatin at a concentration of 0, 1, 5, 10, 20 or 30 µM. Small organoids at a density of 1000 organoids/100 µl medium were then plated in each well of a 96-well plate (96well microplate cell-repellent surface F-Bottom; Greiner Bio One) and cultured at 37 C for 5 days. A CellTiter-Glo 3D Cell Viability Assay Kit was used to determine the organoid viability in accordance with the manufacturer’s instructions (Promega).
Apoptosis assay
To investigate apoptosis induction, the activities of caspases 3 and 7 were detected in 96-well format using the Caspase-Glo 3/7 Assay System in accordance with the manufacturer’s instructions (Promega).
Proteome profiler
Phosphorylation levels of 43 phospho-proteins in TMK-1 cells treated with normal saline or 5 µM cisplatin were determined using a Proteome Profiler kit in accordance with the manufacturer’s instructions (Human Phospho-Kinase Antibody Array ARY003B; R&D Systems, Minneapolis, MN, USA). We used 400 µg of protein for each sample.
Western blotting
For sample preparation, cell lines grown on a 10-cm culture dish were treated with normal saline, 5 µM cisplatin or 10 µM cisplatin for 24 h, washed twice with cold PBS, collected by SDS-modified RIPA buffer containing protease and phosphatase inhibitor cocktails (cOmplete Mini and PhosSTOP EASY pack; Roche Diagnostics, Mannheim, Germany), and then incubated on ice for 20 min for cell lysis. Similarly, PDOs grown in Matrigel were treated with normal saline, 10 µM cisplatin or 20 µM cisplatin for 24 h, collected, and incubated with 1 ml of Cell Recovery Solution (Corning) in a 1.5-ml tube on ice for 20 min. After centrifugation at 400 × g at 4 °C for 5 min, they were washed with cold PBS and lysed with SDS-modified RIPA buffer on ice for 20 min. Subsequently, the lysates of cell lines or organoids were centrifuged at 17400 × g at 4 °C for 20 min. Supernatants were transferred to a new tube, and the resulting cell lysates (20 µg) were boiled with Laemmli sample buffer and subjected to SDS-PAGE. The samples were then transferred to a PVDF membrane (Merk Millicellpore, Darmstadt, Germany), which was blocked with Block Ace (DS Pharma, Osaka, Japan) for 30 min at RT and then incubated overnight at 4 °C with primary antibodies against p-p38 (Thr180/Tyr182) (Cat#4631, Cell Signaling Technology, Danvers, MA, USA), p-c-Jun (Ser63) (Biotinylated) (Cat#5464, Cell Signaling Technology), p-c-Jun (Ser63) (Cat#2361, Cell Signaling Technology), total c-Jun (Cat#9165, Cell Signaling Technology), p-JNK (Thr183/Tyr185) (Cat#4668, Cell Signaling Technology), β-actin (Cat#sc-47778, Santa Cruz Biotechnology, Santa Cruz, CA, USA) or GAPDH (Cat#sc-32233, Santa Cruz Biotechnology). After washing, the membranes were incubated for 1 h at RT with suitable secondary antibodies. As a biotinylated primary antibody against p-c-Jun (Ser63), we used streptavidin-HRP (AB7403; Abcam). Signals were visualized using an ECL Western blotting analysis system (GE Healthcare, Piscataway, NJ, USA). Band intensities of p-c-Jun were measured using ImageJ and normalized against that of βActin. Then, the phosphorylation levels of c-Jun in 10 µM cisplatin-treated cells were expressed as fold changes relative to those in mock-treated cells.
Immunofluorescence
Immunofluorescence of PDOs was determined as described previously16. The PDOs treated with or without 5 µM cisplatin were fixed with 4% paraformaldehyde for 30 min and gently washed with 1xPBS three times. They were then permeabilized with 0.5% Triton X-100/PBS for 20 min, blocked with Block Ace (DS Pharma) in 0.05% Tween20/TBS for 1 h at room temperature and incubated overnight at 4 °C with a primary antibody against p-c-Jun (Ser73) (Cat#3270, Cell Signaling Technology) diluted 1:500. Subsequently, the organoids were washed with 0.05% Tween20/TBS three times and incubated with a secondary antibody (Alexa Fluor R488, 1:500; Thermo Fisher Scientific) and DAPI (diluted 1:1000) at RT for 2 h. After washing, images were captured using an LSM 710 confocal laser microscope (Carl Zeiss, Oberkochen, Germany).
Evaluation of response to neoadjuvant chemotherapy with docetaxel/cisplatin/5-fluorouracil (5FU) (DCF-NAC)
The DCF-NAC regimen consisted of 3 courses of a 1-h intravenous infusion of docetaxel (70 mg/m2) on day 1, a 2-h infusion of cisplatin (70 mg/m2) on day 1, and continuous intravenous infusion of 5-FU (750 mg/m2) on days 1–5. This course was repeated 3 times every 3 weeks24. Surgery was scheduled within 4-6 weeks after the last day of the chemotherapy. Tumor volumes of primary tumors from which EC002, EC006, EC015, EC020, EC021 and EC022 had been derived were evaluated by 18F-FDG PET/CT and analyzed by VOX-BASE II software (J-MAC System, Sapporo, Japan). The therapeutic response of the primary tumor was expressed as the shrinkage rate by comparing the SULmax (maximum standardized uptake value derived for lean body) of primary tumor before and after the first or third course of DCF-NAC. SULmax was measured using a 1.0-cm-diameter volume region of interest (ROI) placed on the hottest area of the tumor. We also determined whether the SULmax of the tumor was at least 1.5 times higher than the liver SULmean +2SDs in a 3-cm-diameter volume ROI in the normal right lobe of the liver.
Gene expression microarray
For gene expression microarray, a cisplatin-sensitive PDO, EC007, was treated with mock medium, 10 µM cisplatin for 24 h, or 10 µM cisplatin for 24 h with 40 µM JNK inhibitor (SP600125) for the last 3 h of the treatment in triplicate, as illustrated in Fig. 4A. Total RNAs were collected and labeled with Cy3 dye, then subjected to microarray analysis as described previously25. Briefly, total RNAs from each PDO were extracted with a FastGene RNA Premium Kit in combination with DNase treatment (NIPPON Genetics, Tokyo, Japan) in accordance with the manufacturer’s instructions, labeled with a Quick Amp labeling Kit (Agilent Technologies, Palo Alto, CA, USA), and hybridized with a Human GE 4x44K v2 Microarray Kit (G4845A; Agilent Technologies) for 17 h at 65 °C. After washing, the signals on the microarray slides were scanned with a high-resolution microarray scanner system (Agilent Technologies) and quantified with Feature Extraction software (Agilent Technologies). Analysis of the raw data obtained was performed with GeneSpring GX11 Software (Agilent Technologies). For comparison among multiple arrays, probe set data were median-normalized per chip. Then, data were centered across the genes in four control samples, followed by filtering based on signal intensity and flagged values. Differentially expressed genes were identified using ANOVA with post hoc Tukey and Benjamini-Hochberg correction. Genes with corrected P values of <0.05 were considered to be differentially expressed. To identify target genes of JNK/c-Jun after cisplatin treatment, we compared genes that were significantly upregulated more than 1.2-fold by cisplatin treatment and genes significantly downregulated more than 1.2-fold by JNK inhibitor in the presence of cisplatin. Commonly dysregulated genes were subjected to KEGG pathway analysis using DAVID26. KEGG terms with a false discovery rate (FDR) of <0.05 were considered to be significant.
Quantitative RT-PCR (qRT-PCR)
Total RNAs from PDOs were subjected to qRT-PCR analysis using a LightCycler 480 realtime PCR System with a Universal probe library and a LightCycler 480 probe master (Roche Diagnostics, Penzberg, Germany), in accordance with the manufacturer’s instructions. All the primer sets for genes of interest were designed by Roche Diagnostics. All assays were normalized by the KPNA6 internal control.
Measurement of secreted TNFα
TNFα secretion from PDOs after cisplatin treatment was measured using the Quantikine HS ELISA Human TNF-α Immunoassay (R&D Systems) in accordance with manufacturer’s instructions.
Statistical analysis
The two-sided Student’s t test was used to analyze differences in experiments with cell lines. Data are reported as mean values ± SD of quadruplicate determinations. P values of <0.05 were considered to be statistically significant.
Results
Cisplatin sensitivity is associated with enhanced phosphorylation of p38 and c-Jun in GC cell lines
To screen candidate biomarkers for cisplatin sensitivity, we used a series of GC cell lines as a drug test model because we had previously characterized these cell lines in terms of passage ratio, the number of cells needed for drug assay, and authentication17. First, we evaluated the sensitivity of 20 GC cell lines to cisplatin (Fig. 1A and Fig. S1). To identify phospho-proteins that are affected by cisplatin, we investigated the phosphorylation levels of 43 proteins in a cisplatin-sensitive cell line, TMK-1, with or without cisplatin treatment. As shown in Fig. 1B and Fig. S2, phosphorylation of p38 (p-p38), JNK (p-JNK) and c-Jun (p-c-Jun) was enhanced by the treatment, consistent with previous studies by other groups27,28,29. To determine whether activation of the pathway is associated with cisplatin sensitivity across all of the 20 GC cell lines, we analyzed the phosphorylation levels of p38 and c-Jun after cisplatin treatment using Western blotting. As shown in Fig. 1C, cell lines that were highly sensitive to cisplatin, including NUGC-3, 44As3, SNU-601, 58As9, MKN-1, TMK-1 and SH101-P4, showed clear activation of both p38 and c-Jun in response to cisplatin, while the other cell lines showed little response. This suggested that the activation of p38 and c-Jun in response to cisplatin might correlate with cisplatin sensitivity. Total c-Jun was also increased in cisplatin-sensitive cell lines by cisplatin treatment, probably due to autoactivation of c-Jun transcription.
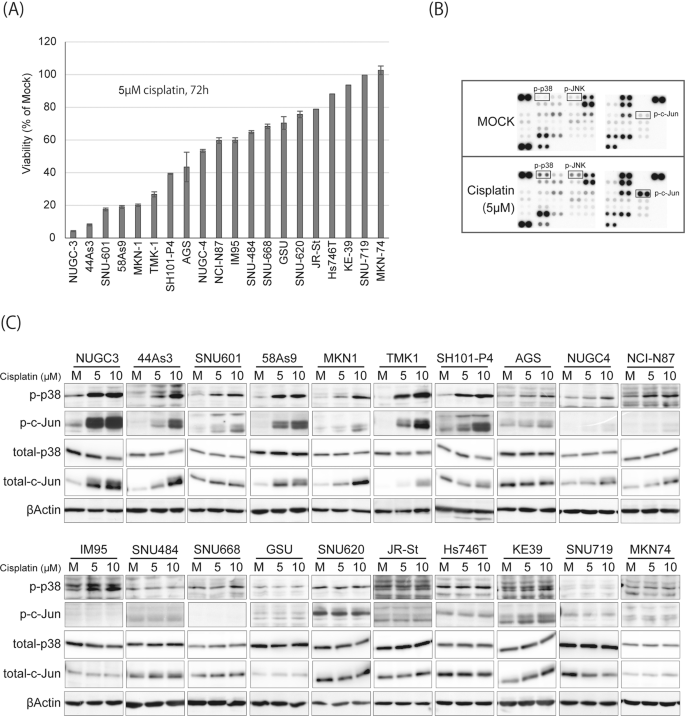
A GC cell lines were treated with 5 µM cisplatin for 3 days and the cell viabilities were determined by MTS assay. B TMK-1 cells were treated with mock medium or 5 µM cisplatin and subjected to an antibody array, Human Phospho-Kinase Array Kit (R&D Systems, ARY003B). Antibodies against phospho-proteins or control antibodies were spotted in duplicate. C GC cell lines were treated with mock medium or cisplatin (5 or 10 µM) for 24 h and then subjected to Western blotting using antibodies against p-p38, p-c-Jun, total p38, total c-Jun or β-actin.
Cisplatin sensitivity is associated with enhanced phosphorylation of c-Jun in PDOs
Our data on cell lines suggested that it might be possible to identify cisplatin-sensitive tumors by comparison of p-p38 or p-c-Jun in the presence and absence of cisplatin. To develop an ex vivo preclinical model, we established PDOs from 5 and 10 cases of GC and EC, respectively (Table 1, Fig. 2) and examined the typical histological features of three representative PDOs using ultrastructural and immunohistochemical analyses (Fig. 2B, C). Then, we investigated the sensitivity of these PDOs to cisplatin and their phosphorylation levels of p38 and c-Jun after cisplatin treatment (Fig. 3A, B, S3 and Fig. S4). The five most sensitive PDOs—EC001, EC006, EC007, EC015 and EC022—showed a marked increase in c-Jun phosphorylation (Fig. 3B, C), suggesting that activation of c-Jun in response to cisplatin was associated with their sensitivity to cisplatin (Pearson’s r = −0.75, p = 0.00125). In contrast to the results obtained for the cell lines, p-p38 was barely affected by cisplatin treatment even in the sensitive PDOs (Fig. S4). All of the gastric PDOs were less sensitive than the 5 most sensitive organoids (Fig. 3A) and none of them showed activation of p38 or c-Jun in response to cisplatin (Fig. 3B). This difference in the activation of c-Jun between sensitive and resistant organoids was also detectable by immunostaining (Fig. 3D), implicating its potential application as an immunofluorescence-based biomarker.

A Bright field microscopy images of PDOs derived from gastric and esophageal cancers. All of the gastric cancer PDOs originated from poorly differentiated tumor tissues and showed less coherent (GC006 and GC011) and grape-like growth patterns (GC004, GC010, and GC015) without any lumen structures. All but one (EC018) of the esophageal PDOs originated from squamous cell carcinoma tissues and showed a round shape without any lumen structures. EC018 originated from esophageal adenocarcinoma tissue and showed a more irregular outline than PDOs derived from squamous carcinoma tissue. B Scanning (SEM) and transmission (TEM) electron microscope images of PDOs derived from gastric signet ring cell carcinoma (SRCGC) (GC006), esophageal squamous cell carcinoma (ESCC) (EC007) and esophageal adenocarcinoma (EAC) (EC018). GC006 showed less cohesive cell clusters by SEM and abundant mucous granules (yellow arrowheads) by TEM. Additionally, nuclei (N) are compressed by the granules toward the cell periphery in GC006. These features of GC006 are typical of SRCGC. EC007 showed a solid spherical shape by SEM and contained substantial numbers of cells without a lumen structure, consistent with the features of organoids derived from squamous carcinoma tissue7,9. Tight junctions were also observed between the cells (white arrows). EC018 showed an irregular surface by SEM and luminal structures lined by microvilli (white arrowheads) by TEM, which is a characteristic of adenocarcinoma. C Hematoxylin & eosin (HE), periodic acid-Schiff (PAS; a marker of mucin-producing cells) and immunohistochemistry with antibodies against AE1/AE3 (a marker of pan cytokeratin), TP63 (a marker of basal cells) and Ki67 (a proliferation marker). GC006 and EC018 showed positive PAS staining, suggesting that these PDOs produced mucin. All of the three organoids were positive for cytokeratin (AE1/AE3), indicating their epithelial origin. Almost all of the cells in EC007 were positive for TP63, thus characterizing them as squamous cells. All of the three organoids contained abundant MKI67-positive cells, suggesting their proliferative capacity. Bars in A and C are 50 and 20 µm, respectively.

A PDOs were treated with 5 µM cisplatin for 5 days and the cell viabilities were determined using a CellTiter-Glo 3D Cell Viability Assay kit. B PDOs were treated with mock medium or cisplatin (10 or 20 µM) for 24 h and then subjected to Western blotting using antibodies against p-c-Jun, total c-Jun or β-actin. C Fold change in p-c-Jun expression after cisplatin treatment was expressed as described in “Materials and Methods”, and lined up in the same order as in A. The values of fold change were compared to the viability of 5 µM cisplatin-treated cells in A and the comparison was performed using Pearson correlation coefficient (Pearson cc). D Cisplatin-sensitive (EC007) and resistant (EC002) PDOs were treated with mock medium or 5 µM cisplatin for 24 h and subjected to immunofluorescence for p-c-Jun. E FDG uptake, which is indicative of tumor mass, was shown by colors (highest in red) and overlayed on CT images. Tumor volumes were expressed as SULmax within 1-cm-diameter ROIs, which was placed on the hottest area of each tumor. Shrinkage rates (%) of primary tumors were calculated as described in “Materials and methods”, and are indicated in white. Untrimmed images are shown in Fig. S5. F Shrinkage rates of primary tumors after the first course of DCF-NAC (white bar) were compared with fold the change in p-c-Jun induction by cisplatin treatment in matched PDOs (black bar; the same value as in (C)). G Shrinkage rates of primary tumors after the first course of DCF-NAC (white bar) were compared with the growth-inhibitory effect on PDOs (gray bar; calculated from the value in A). In F and G, correlations were analyzed by Pearson correlation test.
Next, we compared the p-c-Jun induction in PDOs with the clinical response shown by their matched original tumor tissues to neoadjuvant chemotherapy that included docetaxel, cisplatin and 5-fluorouracil (5-FU) (DCF-NAC). Among the 10 patients with EC, 8 received DCF-NAC, of whom 6 were evaluated for their tumor response by PET/CT. The PET/CT images from 4 of these cases are shown in Fig. 3E and S5. We determined the tumor shrinkage ratio for the 6 patients whose PET/CT information had been available before and after the first course of DCF-NAC (Fig. 3F). PDOs derived from tumors showing substantial shrinkage (>70%) after chemotherapy (EC015, EC006 and EC022) exhibited clear induction of p-c-Jun after the cisplatin treatment, although this correlation did not reach statistical significance due to the small sample size (p = 0.0673). We also compared the clinical response to DCF-NAC with the growth-inhibitory effect of 5 µM cisplatin in the matched PDOs, and found that the PDOs derived from the three tumors showing the greatest degree of regression (EC015, EC006 and EC022) also showed a greater growth-inhibitory effect than the other 3 organoids (EC002, EC021 and EC020), although the correlation was much lower than that for p-c-Jun induction (p = 0.304) (Fig. 3G). The impact of DCF-NAC was also obvious by endoscopic observation (Fig. S6). It was notable that the primary tumor of EC020 showed substantial shrinkage rate (79.48%) after the 3rd course of DCF-NAC, despite having shown only slight shrinkage (1.11%) after the 1st course (Fig. 3F, G and Fig. S6).
We also verified that freeze-thaw cycles and long-term passage had little effect on either cisplatin sensitivity or induction of p-c-Jun after cisplatin treatment (data not shown and Fig. S7). These results suggested that enhanced phosphorylation of c-Jun in combination with PDOs could be a potentially robust biomarker for prediction of sensitivity to cisplatin-containing therapy.
Enhanced phosphorylation of c-Jun is partly involved in the expression of TNF-induced cytokines
We assumed that c-Jun was phosphorylated by JNK, a major upstream kinase of c-Jun, since phosphorylation of JNK was also enhanced by cisplatin treatment in TMK-1 cells (Fig. 1B and Fig. S2). We tested this by using a JNK inhibitor, SP600125, in the presence of cisplatin and found that phosphorylation of both c-Jun and JNK was suppressed by JNK inhibition for the last 3 h of cisplatin treatment in a cisplatin-sensitive PDO, EC007 (Fig. 4A, B). Furthermore, c-Jun expression was increased at both the mRNA and protein level by cisplatin treatment in EC007 (Fig. 4B). These results suggested that cisplatin treatment activated c-Jun via the JNK pathway at both the mRNA and protein level.

A Schedule of cisplatin and inhibitor treatment. B EC007, a cisplatin-sensitive PDO, was treated with cisplatin with or without JNK inhibitor (SP600125) according to the schedule in A and subjected to Western blotting (left and right panels) and qRT-PCR (middle panel). C Probes showing significant upregulation of more than 1.2-fold after the cisplatin treatment (left circle, 689 probes in total) and those showing significant downregulation of more than 1.2-fold after JNK inhibition under cisplatin treatment, as shown in A (right circle, 345 probes in total) identified candidate downstream targets of JNK/c-Jun by cisplatin treatment in EC007 (122 genes corresponding to 130 probes at the intersection). Identified candidate genes were subjected to KEGG pathway analysis using DAVID to explore the key pathways. KEGG terms with FDR of <0.05 were considered to be significant. D Expression levels of genes related to TNF signaling were validated by qRT-PCR. EC007 was treated with cisplatin with or without JNK inhibitor (SP600125) according to the schedule shown in A. E Induction of TNF by cisplatin treatment in EC007 was analyzed by qRT-PCR and Quantikine HS ELISA Human TNF-α Immunoassay (R&D Systems). F Effect of TNF inhibition on the phosphorylations of c-Jun and JNK. EC007 was treated with cisplatin with or without TNF inhibitors (C87 and R-7050) according to the schedule shown in A.
To address the consequences of JNK/c-Jun activation, we explored the global gene expression profile after 24 h of cisplatin treatment with or without JNK inhibition for the last 3 h of the treatment. We identified 122 genes that were significantly upregulated by cisplatin treatment and downregulated by JNK inhibition. Further KEGG pathway analysis revealed that TNF-related molecules were most significantly enriched in the gene list (Fig. 4C). Expression of the genes related to TNFα signaling was validated by qRT-PCR (Fig. 4D), except for SOCS3, which showed only a slight tendency for upregulation. In fact, TNFα expression was induced by cisplatin at both the mRNA and protein level (Fig. 4E). We also investigated the effects of inhibition of TNFα signaling using R-7050, which inhibits the interaction of TNFR with its adaptor proteins (e.g. TRADD and RIP), and C87, which inhibits TNF signaling by modulating the interaction of TNF and TNFR. We found that both of them partially, although not completely, suppressed the phosphorylation of JNK and c-Jun (Fig. 4F). Additionally, we attempted to investigate whether or not inhibition of TNF signaling with R-7050 and C87 contributes to cisplatin resistance. Unexpectedly, however, even treatment with R-7050 or C87 alone caused massive cell death within 24 h (data not shown). These inhibitors induced apoptosis as early as 5 h after the start of treatment, which is earlier than cisplatin-induced apoptosis (data not shown). Therefore, it is possible that R-7050 and C87 might have caused cell death through JNK/c-Jun-independent pathway(s) and that the use of TNF-knockout cells or TNF neutralizing antibody might be more appropriate for investigating the effect of TNF inhibition on cisplatin sensitivity. Further studies will be required. Collectively, these results suggested that the JNK/c-Jun pathway was partly activated by TNF, which was upregulated by cisplatin treatment, and contributed to regulating the expression of TNF downstream cytokines.
Cisplatin-induced activation of the JNK/c-Jun pathway contributes to apoptosis
Next, we investigated the contribution of JNK/c-Jun activation to cisplatin sensitivity. First, we inhibited JNK activation in cisplatin-treated cells using a JNK inhibitor, SP600125, and analyzed cell viability and apoptosis induction. TMK-1 and SH101-P4 cells exhibited improved-cell survival in response to cisplatin upon JNK inhibition, whereas NUGC-3 cells did not (Fig. 5A). In contrast, 24-h cisplatin treatment caused caspase activation and this was significantly suppressed by JNK inhibition in both cell lines as well as a PDO line, EC007 (Fig. 5B). These results suggested that cisplatin treatment causes apoptosis, and that JNK activation is involved in the induction of apoptosis. Second, to investigate the importance of c-Jun in cisplatin sensitivity, we generated c-Jun-knockout cell lines using the CRISPR/Cas9 system. We confirmed knockout of c-Jun in TMK-1 and NUGC-3 by Western blotting (Fig. 5C), and then analyzed the effect of c-Jun knockout on cisplatin-induced cytotoxicity in the knockout cells. Similarly to the results of JNK inhibition experiments, TMK-1 cells showed significant resistance to cisplatin as a result of c-Jun knockout, while NUGC-3 cells did not (Fig. 5D). In contrast, both knockout cell lines showed significant reduction of caspase activation after cisplatin treatment (Fig. 5E). These results suggested that JNK/c-Jun activation is partly involved in cisplatin-induced apoptosis, and that inhibition of JNK/c-Jun may be related to reduced apoptosis induction, which is one of the characteristics of cisplatin resistance30,31. However, whether or not the suppression of apoptosis by JNK/c-Jun inhibition results in improved cell survival after cisplatin treatment might depend on the cellular context of the cancer cells. Furthermore, we also found that c-Jun knockout suppressed the expression of cisplatin-induced cytokines (Fig. 5F) such as EDN1, CXCL1 and CXCL2, confirming the involvement of JNK/c-Jun activation in expression of these cytokines after cisplatin treatment.
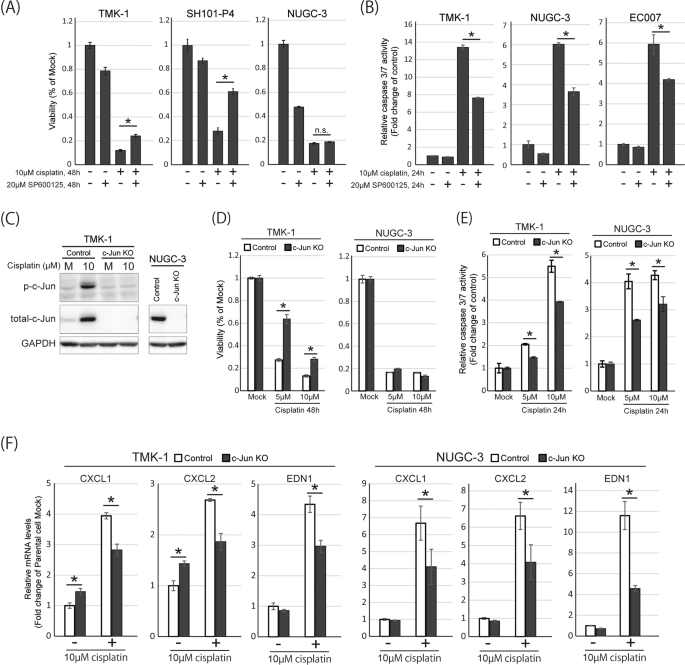
A TMK-1, SH101-P4 and NUGC-3 were treated with 10 µM cisplatin and/or 20 µM SP600125 for 48 h and the cell viabilities were determined by MTS assay. B TMK-1, NUGC-3 and EC007 were treated with 10 µM cisplatin and/or 20 µM SP600125 for 24 h and the activities of caspase 3 and 7 were measured using the Caspase Glo 3/7 assay kit. Data are expressed as the fold change relative to mock-treated cells. C Control- or c-Jun-knockout TMK-1 cells were treated with mock medium or 10 µM cisplatin for 24 h and then subjected to Western blotting using antibodies against p-c-Jun, total c-Jun and GAPDH. Control- or c-Jun-knockout NUGC-3 cells were subjected to Western blotting using antibodies against total c-Jun and GAPDH. D Control- or c-Jun-knockout TMK-1 and NUGC-3 cells were treated with mock medium or cisplatin (5 µM or 10 µM) for 48 h and the cell viabilities were determined by MTS assay. E Control- or c-Jun-knockout TMK-1 and NUGC-3 cells were treated with mock medium or cisplatin (5 µM or 10 µM) for 24 h and the activities of caspase 3 and 7 were measured using the Caspase Glo 3/7 assay kit. F Expressions of CXCL1, CXCL2, and EDN1 in control- or c-Jun-knockout TMK-1 and NUGC-3 were measured by qRT-PCR. The expression values of cytokines were normalized by the value of KPNA6 and data are expressed as the fold change relative to mock-treated control cells.
Discussion
Despite the widespread use of cisplatin as standard chemotherapy for cancers in various organs, prediction of its efficacy is still difficult for current diagnostics. In this study, we aimed to develop a novel diagnostic method for the prediction of cisplatin efficacy and hypothesized that some cellular signaling pathways may be differentially activated by cisplatin treatment and that such differential activation could be used as a biomarker of cisplatin response. Until about a decade ago it was not practically possible to test this hypothesis because conventional diagnostic materials are static, i.e. fixed, frozen or lysed tissues, and thus lack any biological response to drug treatments. However, recent advances in organoid technology have enabled us to employ living cancer tissues as diagnostic materials.
In this study, we showed that stress-responsive proteins, including p-38, JNK and c-Jun, were activated by cisplatin treatment. Although many previous studies have already reported similar results, most of them used only a few cell lines because their aim was to investigate the mechanism of cisplatin action. In contrast, we used a number of cell lines and PDOs to investigate the correlation between response intensity and cisplatin sensitivity, because our aim was to test the feasibility of using the response as a biomarker in combination with PDOs. We found that the change in p-c-Jun was correlated with sensitivity to cisplatin across 15 PDO lines (Pearson’s r = –0.75, p = 0.00125). Furthermore, the enhanced expression of p-c-Jun in 6 PDOs showed a tendency to be correlated with the effect of neoadjuvant chemotherapy in 6 matched patients (p = 0.067). To our knowledge, this is the first reported study to have attempted to apply the change in p-c-Jun caused by cisplatin treatment as a biomarker of cisplatin response in combination with PDOs.
There are two reasons why we selected c-Jun phosphorylation as a candidate biomarker among the three stress-responsive phosphoproteins (p-38, JNK and c-Jun). First, expression of p-p38 was not induced so much in PDOs relative to the cell lines. Second, the change in pJNK expression was not as dynamic as that of p-c-Jun, and its activation was difficult to detect by immunofluorescence. Enhancement of c-Jun phosphorylation by cisplatin treatment was sufficiently dynamic to allow stratification of the PDOs’ cisplatin response and easy to detect by immunofluorescence, making it advantageous for reducing the number of PDOs required. This allowed us to develop a prototype cellular response-based diagnostic system by using a novel type of biomarker combined with PDOs. To establish this diagnostic system for clinical use, further large-scale studies with more samples will be required.
Currently, in organoid-related research, ATP-based cell viability assays are mainly used to evaluate drug sensitivity. However, this method has some practical limitations when applying organoids for clinical diagnosis, as it is costly and requires much time for obtaining a sufficient amount of organoids. Furthermore, variations in the size or growth speed of individual organoids often lead to inter- and intra-assay variability, thus limiting its applicability for drug assays. To reduce this variation, complex procedures are required, such as filtration before drug assays to obtain organoids of similar size (see “Organoid viability assay” in Materials and Methods) and mathematical modeling to correct for variations in growth speed32,33. In this study, we showed that the change in p-c-Jun expression resulting from cisplatin treatment was detectable by immunofluorescence, which would be advantageous for reducing the amount of organoids required and making organoid size irrelevant. Thus, detection of p-c-Jun in organoids with or without cisplatin treatment could be a simple and robust diagnostic approach with potential advantages over conventional cell viability assays for prediction of cisplatin sensitivity.
Previous studies and our present investigation have shown that PDOs can be established from endoscopic biopsy samples7,34, despite the fact that such samples contain smaller amounts of tissue (10-20 mg) than surgical resection speciments (>200 mg). Establishment of PDOs from endoscopic biopsy samples has advantages for prediction of drug efficacy in individual patients, because patients with recurrent or metastatic tumors usually do not undergo surgery, and chemotherapy may be the only option for those with inoperable tumors, especially tumors arising in the digestive tract. Therefore, predictive systems that require very small amounts of tumor tissue obtained as surplus specimens from diagnostic procedure would be desirable. The predictive system proposed in this study involves detection of a biomarker by immunostaining thus potentially reducing the number of PDOs required. Although this study focused only on cisplatin, the present predictive approach would be abblicable to other types of cytotoxic drugs whose efficacies would also be difficult to evaluated by mutation diagnosis.
Recently, studies intended to develop organoid-based diagnostic systems are increasing. However, those investigating the correlation between in vitro drug sensitivity and the clinical response to chemotherapy are still limited35. Therefore, further studies of relationships between in vivo and ex vivo drug sensitivity are required. Here, we compared the cisplatin sensitivities of PDOs with the DCF-NAC responses of the matched primary tumors. Although PDOs and their primary tumors were treated differently (i.e. with cisplatin alone or in combination with other agents [docetaxel/cisplatin/5-FU]), patients whose PDOs showed an increase of p-c-Jun expression after cisplatin treatment (EC006, EC015 and EC022) showed a better response to DCF-NAC than patients whose PDOs did not show such a response (EC002, EC021 and EC020). This finding suggests that, through the use of PDOs, detection of p-c-Jun could be a useful method for identifying patients who might benefit from cisplatin-based chemotherapy for EC. Interestingly, the growth-inhibitory effects of EC021 and EC020 did not correlate with the fold change in p-c-Jun expression resulting from cisplatin treatment (Fig. 3A, B). Although we cannot fully explain this inconsistency, we realized that the correlation of clinical response to neoadjuvant chemotherapy tended to be clearer for the p-c-Jun fold change (r = 0.78, p = 0.0673) than for the growth-inhibitory effect (r = 0.507, p = 0.304) (Fig. 3F, G). Therefore, a further study using larger samples will be required to determine whether it is better to predict cisplatin efficacy using PDOs, by evaluation of p-c-Jun induction, or by ATP-based cell viability assay.
Our data suggested that cisplatin treatment induced TNF secretion in a sensitive PDO (EC007) and activated JNK/c-Jun, leading to upregulation of cytokines. The same molecular dynamics after DNA damage have been reported previously by Biton et al.36. They demonstrated that persistent DNA damage caused by overdose of etoposide induced a feedforward NF-kB/TNF signaling loop in which activation of JNK was also involved36. Persistent DNA damage can be caused by not only excess amounts of DNA-damaging agents but also delayed DNA repair due to defects in DNA repair genes. Therefore, we propose that induction of p-c-Jun by cisplatin treatment could be a surrogate marker for delayed DNA repair in cisplatin-treated cells, since we evaluated p-c-Jun across a number of cell lines or PDOs at constant concentration of cisplatin.
Previous studies have demonstrated that defects in DNA repair genes sensitize cells to cisplatin29,37. Therefore, mutations or deletions in DNA repair genes might also be potential biomarkers of cisplatin sensitivity. However, even with the use of hundreds of cell lines, large-scale correlation analyses were unable to find mutations or deletions of particular DNA repair genes associated with cisplatin sensitivity1,2. This is probably because responsiveness to cisplatin might be mainly associated with functional defects of DNA repair rather than genomic mutations of particular genes. For example, it has been demonstrated that a defect of ERCC8, a nucleotide excision repair (NER) gene, is highly correlated with cisplatin sensitivity38. However, 33 mutations have been mapped in the coding region of ERCC8 in the COSMIC Cell Line Project (https://cancer.sanger.ac.uk/cell_lines), and the functional significance of each mutation type remains unclear: i.e., to separate driver from passenger mutations, functional analysis of this gene is needed. Additionally, there are more than 50 DNA repair genes showing multiple types of mutations, including both driver and passenger mutations. Among these DNA repair genes, approximately 15 are NER genes, mainly related to cisplatin sensitivity39. This considerable number of genes and mutations related to cisplatin sensitivity could make any attempt at predictive analysis complicated. Therefore, it might be more reasonable to investigate functional consequences, such as activation or inactivation of signal transduction, as surrogate biomarkers of the cisplatin response rather than focusing of functionally unidentified mutations.
In conclusion, we have developed a potentially useful method for prediction of cisplatin efficacy using a combination of PDOs and a novel type of biomarker. As our study had several limitations, such as a small sample size, a limited success rate in deriving PDOs, and was focused specifically on activation of c-Jun in sensitive PDOs, more extensive improvement and validation will be needed before its clinical application can be justified. However, considering that cisplatin is one of the most widely used and effective chemotherapeutic agents for the treatment of various solid tumors, further exploration of this approach would be worthwhile.
Data availability
The data that support the findings of this study are available from the corresponding authors, upon reasonable request.
References
Barretina, J, Caponigro, G, Stransky, N, Venkatesan, K, Margolin, AA, Kim, S, et al. The Cancer Cell Line Encyclopedia enables predictive modelling of anticancer drug sensitivity. Nature 483, 603-607 (2012).
Garnett, MJ, Edelman, EJ, Heidorn, SJ, Greenman, CD, Dastur, A, Lau, KW, et al. Systematic identification of genomic markers of drug sensitivity in cancer cells. Nature 483, 570-575 (2012).
Pauli, C, Hopkins, BD, Prandi, D, Shaw, R, Fedrizzi, T, Sboner, A, et al. Personalized in vitro and in vivo cancer models to guide precision medicine. Cancer Discov 7, 462-477 (2017).
Sato, T, Stange, DE, Ferrante, M, Vries, RG, Van Es, JH, Van den Brink, S, et al. Long-term expansion of epithelial organoids from human colon, adenoma, adenocarcinoma, and Barrett’s epithelium. Gastroenterology 141, 1762-1772 (2011).
Sachs, N, Clevers, H. Organoid cultures for the analysis of cancer phenotypes. Curr Opin Genet Dev 24, 68-73 (2014).
Vlachogiannis, G, Hedayat, S, Vatsiou, A, Jamin, Y, Fernandez-Mateos, J, Khan, K, et al. Patient-derived organoids model treatment response of metastatic gastrointestinal cancers. Science 359, 920-926 (2018).
Kijima, T, Nakagawa, H, Shimonosono, M, Chandramouleeswaran, PM, Hara, T, Sahu, V, et al. Three-Dimensional Organoids Reveal Therapy Resistance of Esophageal and Oropharyngeal Squamous Cell Carcinoma Cells. Cell Mol Gastroenterol Hepatol 7, 73-91 (2019).
Driehuis E, van Hoeck A, Moore K, Kolders S, Francies HE, Gulersonmez MC, et al. Pancreatic cancer organoids recapitulate disease and allow personalized drug screening. Proc Natl Acad Sci USA (2019).
Driehuis, E, Kolders, S, Spelier, S, Lohmussaar, K, Willems, SM, Devriese, LA, et al. Oral Mucosal Organoids as a Potential Platform for Personalized Cancer Therapy. Cancer Discov 9, 852-871 (2019).
van de Wetering, M, Francies, HE, Francis, JM, Bounova, G, Iorio, F, Pronk, A, et al. Prospective derivation of a living organoid biobank of colorectal cancer patients. Cell 161, 933-945 (2015).
Matano, M, Date, S, Shimokawa, M, Takano, A, Fujii, M, Ohta, Y, et al. Modeling colorectal cancer using CRISPR-Cas9-mediated engineering of human intestinal organoids. Nat Med 21, 256-262 (2015).
Boj, SF., Hwang, CI., Baker, LA., Chio, II., Engle, DD. & Corbo, V. et al. Organoid models of human and mouse ductal pancreatic cancer. Cell 160, 324–338 (2015).
Li, X, Francies, HE, Secrier, M, Perner, J, Miremadi, A, Galeano-Dalmau, N, et al. Organoid cultures recapitulate esophageal adenocarcinoma heterogeneity providing a model for clonality studies and precision therapeutics. Nat Commun 9, 2983 (2018).
Lee, SH, Hu, W, Matulay, JT, Silva, MV, Owczarek, TB, Kim, K, et al. Tumor Evolution and Drug Response in Patient-Derived Organoid Models of Bladder Cancer. Cell 173, 515-528 e517 (2018).
Weeber, F, Ooft, SN, Dijkstra, KK,Voest, EE. Tumor Organoids as a Pre-clinical Cancer Model for Drug Discovery. Cell Chem Biol 24, 1092-1100 (2017).
Hirashita, Y, Tsukamoto, Y, Kudo, Y, Kakisako, D, Kurogi, S, Hijiya, N, et al. Early response in phosphorylation of ribosomal protein S6 is associated with sensitivity to trametinib in colorectal cancer cells. Lab Invest 101, 1036-1047 (2021).
Hirashita, Y, Tsukamoto, Y, Yanagihara, K, Fumoto, S, Hijiya, N, Nakada, C, et al. Reduced phosphorylation of ribosomal protein S6 is associated with sensitivity to MEK inhibition in gastric cancer cells. Cancer Sci 107, 1919-1928 (2016).
Bellmunt, J, Pons, F,Orsola, A. Molecular determinants of response to cisplatin-based neoadjuvant chemotherapy. Curr Opin Urol 23, 466-471 (2013).
Rose, MC, Kostyanovskaya, E,Huang, RS. Pharmacogenomics of cisplatin sensitivity in non-small cell lung cancer. Genomics Proteomics Bioinformatics 12, 198-209 (2014).
Ecke, TH. Biomarker in cisplatin-based chemotherapy for urinary bladder cancer. Adv Exp Med Biol 867, 293-316 (2015).
Ran, FA, Hsu, PD, Wright, J, Agarwala, V, Scott, DA, Zhang, F. Genome engineering using the CRISPR-Cas9 system. Nat Protoc 8, 2281-2308 (2013).
Bartfeld, S, Bayram, T, van de Wetering, M, Huch, M, Begthel, H, Kujala, P, et al. In vitro expansion of human gastric epithelial stem cells and their responses to bacterial infection. Gastroenterology 148, 126-136 e126 (2015).
Busslinger, GA, Weusten, BLA, Bogte, A, Begthel, H, Brosens, LAA,Clevers, H. Human gastrointestinal epithelia of the esophagus, stomach, and duodenum resolved at single-cell resolution. Cell Rep 34, 108819 (2021).
Fujishima, H, Fumoto, S, Shibata, T, Nishiki, K, Tsukamoto, Y, Etoh, T, et al. A 17-molecule set as a predictor of complete response to neoadjuvant chemotherapy with docetaxel, cisplatin, and 5-fluorouracil in esophageal cancer. PLoS One 12, e0188098 (2017).
Tsukamoto, Y, Nakada, C, Noguchi, T, Tanigawa, M, Nguyen, LT, Uchida, T, et al. MicroRNA-375 is downregulated in gastric carcinomas and regulates cell survival by targeting PDK1 and 14-3-3zeta. Cancer Res 70, 2339-2349 (2010).
Kanehisa, M, Goto, S, Hattori, M, Aoki-Kinoshita, KF, Itoh, M, Kawashima, S, et al. From genomics to chemical genomics: new developments in KEGG. Nucleic Acids Res 34, D354-357 (2006).
Yan, D, An, G,Kuo, MT. C-Jun N-terminal kinase signalling pathway in response to cisplatin. J Cell Mol Med 20, 2013-2019 (2016).
Mansouri, A, Ridgway, LD, Korapati, AL, Zhang, Q, Tian, L, Wang, Y, et al. Sustained activation of JNK/p38 MAPK pathways in response to cisplatin leads to Fas ligand induction and cell death in ovarian carcinoma cells. J Biol Chem 278, 19245-19256 (2003).
Helbig, L, Damrot, J, Hulsenbeck, J, Koberle, B, Brozovic, A, Osmak, M, et al. Late activation of stress-activated protein kinases/c-Jun N-terminal kinases triggered by cisplatin-induced DNA damage in repair-defective cells. J Biol Chem 286, 12991-13001 (2011).
Brozovic, A, Osmak, M. Activation of mitogen-activated protein kinases by cisplatin and their role in cisplatin-resistance. Cancer Lett 251, 1-16 (2007).
Wang, Q, Shi, S, He, W, Padilla, MT, Zhang, L, Wang, X, et al. Retaining MKP1 expression and attenuating JNK-mediated apoptosis by RIP1 for cisplatin resistance through miR-940 inhibition. Oncotarget 5, 1304-14 (2014).
Harris, LA, Frick, PL, Garbett, SP, Hardeman, KN, Paudel, BB, Lopez, CF, et al. An unbiased metric of antiproliferative drug effect in vitro. Nat Methods 13, 497-500 (2016).
Hafner, M, Niepel, M, Chung, M,Sorger, PK. Growth rate inhibition metrics correct for confounders in measuring sensitivity to cancer drugs. Nat Methods 13, 521-527 (2016).
Nanki, K, Toshimitsu, K, Takano, A, Fujii, M, Shimokawa, M, Ohta, Y, et al. Divergent Routes toward Wnt and R-spondin Niche Independency during Human Gastric Carcinogenesis. Cell 174, 856-869 e817 (2018).
Veninga, V,Voest, EE. Tumor organoids: Opportunities and challenges to guide precision medicine. Cancer Cell 39, 1190-1201 (2021).
Biton, S,Ashkenazi, A. NEMO and RIP1 control cell fate in response to extensive DNA damage via TNF-alpha feedforward signaling. Cell 145, 92-103 (2011).
Bulmer, JT, Zacal, NJ,Rainbow, AJ. Human cells deficient in transcription-coupled repair show prolonged activation of the Jun N-terminal kinase and increased sensitivity following cisplatin treatment. Cancer Chemother Pharmacol 56, 189-198 (2005).
Furuta, T, Ueda, T, Aune, G, Sarasin, A, Kraemer, KH,Pommier, Y. Transcription-coupled nucleotide excision repair as a determinant of cisplatin sensitivity of human cells. Cancer Res 62, 4899-4902 (2002).
Murai, J. Targeting DNA repair and replication stress in the treatment of ovarian cancer. Int J Clin Oncol 22, 619-628 (2017).
Acknowledgements
We would like to thank Ms. Mami Kimoto for technical assistance. We are also grateful to Prof. Hans Clevers, Dr. Georg A Busslinger, Dr. Else Driehuis and Ms. Stieneke van den Brink for critical advice on organoid experiments. This work was supported by Oita University President’s Strategic Discretionary Fund (2020 and 2021), by JSPS KAKENHI Grant Numbers JP21H02703 and JP18H02631, by Takeda Science Foundation (2020) and by Japan AMED Translational Research Network Project Seeds A (A232).
Author information
Authors and Affiliations
Contributions
Conceptualization Y.T., Y.H. and M.M.; Formal analysis and investigation Y.T., S.K., S.F., S.Y. and F.M.; Writing—original draft preparation Y.T., Y.H., N.H. and M.M.; Writing—review and editing T.S., K.o.S., S.F., K.Y., C.N., K.K., T.F., K.M.i., Y.U., T.E., T.U,. M.T,. T.D., K.u.S., S.H,. K.M.u. and M.I.; Funding acquisition Y.T.; Resources T.S., K.o.S., Y.H., S.F., K.Y., K.M.i., Y.U., T.E., T.H,. S.H., K.M.u. and M.I.; Supervision: K.M.u., M.I., N.H. and M.M. All authors have approved the final version of the paper.
Corresponding author
Ethics declarations
Competing interests
The authors declare no competing interests.
Ethical approval
This study was approved by the ethics committee of Oita University Faculty of Medicine (approval No. 1495 and 1496).
Additional information
Publisher’s note Springer Nature remains neutral with regard to jurisdictional claims in published maps and institutional affiliations.
Supplementary information
Rights and permissions
Springer Nature or its licensor holds exclusive rights to this article under a publishing agreement with the author(s) or other rightsholder(s); author self-archiving of the accepted manuscript version of this article is solely governed by the terms of such publishing agreement and applicable law.
About this article

Cite this article
Tsukamoto, Y., Kurogi, S., Shibata, T. et al. Enhanced phosphorylation of c-Jun by cisplatin treatment as a potential predictive biomarker for cisplatin response in combination with patient-derived tumor organoids. Lab Invest 102, 1355–1366 (2022). https://doi.org/10.1038/s41374-022-00827-2
Received:
Revised:
Accepted:
Published:
Issue Date:
DOI: https://doi.org/10.1038/s41374-022-00827-2
