The extreme complexity of the E. coli transcriptional regulatory network.
Keywords
Flag Inappropriate
Delete Content
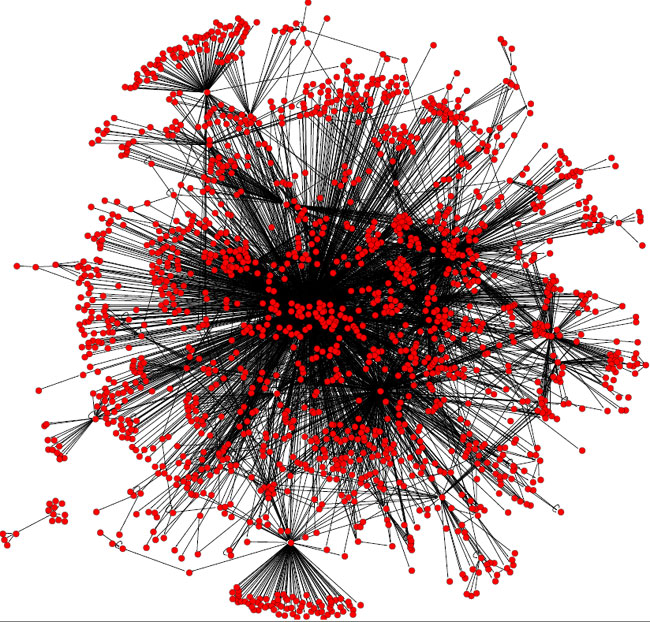
The extreme complexity of the E. coli transcriptional regulatory network.
In this graphical representation, nodes are genes, and edges represent regulatory interactions. The network was reconstructed using data from the RegulonDB (Salgado et al. 2006). This figure highlights the extreme complexity present in regulatory networks. To obtain a deeper understanding of regulatory complexity, scientists must first discover biologically relevant organizational principles to unravel the hidden architecture governing these networks.
This image is linked to the following Scitable pages:

How does a cell coordinate and integrate multiple signals coming from multiple sources in a complex environment? A complex system-wide analysis can help map it out.


Comments
CloseComments
Please Post Your Comment