


« Prev Next »
Bacteria (and other organisms) express genes in response to environmental signals. Thus, when scientists study bacterial gene expression in vitro, they must avoid the presence of any undesired signal in the medium, lest it interfere with their results. To avoid undesired signals, scientists prepare purified growth media with carefully measured ingredients and grow bacteria under strictly controlled conditions. However, unlike the sterile and controlled lab environment of in vitro cultures, in natural settings bacteria grow in the presence of an enormous variety of complex, ever-changing signals. For example, Escherichia coli (E. coli) are bacteria that are commonly found in the lower intestine of mammals, but these organisms can also live outside the body in different habitats, including sewage and sludge, where conditions such as temperature and nutrient availability are quite different. This environment poses a challenge to any type of bacterium: How can a cell coordinate multiple different signals coming from disparate sources and integrate a response to cope with a complex environment? Answering this question is an important goal in current systems and synthetic biology research, and the issue even has social and ecological implications. For example, during the 1980s, genetic engineering boosted interest in developing microbial catalysts for bioremediation of toxic chemicals (Timmis & Pieper 1999). Scientists had the idea of increasing the expression of certain metabolic pathway enzymes using strong promoters. They found that although these genetically modified organisms worked well in the laboratory, they were not optimally expressed in natural environments. Why was there a difference in expression? The answer to this question proved to be more complex than expected. The key issue depends in part on the complex organization of transcriptional regulation and how this organization coordinates and integrates multiple environmental signals.
Understanding Genetic Organization: The First Steps
How does a cell control which genes are turned on or turned off according to environmental cues? In 1961, while studying lactose metabolism, Nobel laureates François Jacob and Jacques Monod showed that bacteria respond to environmental signals by expressing (turning on) or repressing (turning off) certain genes (Jacob & Monod 1961). This mechanism is now known as transcription initiation regulation. Jacob and Monod took the first steps toward understanding genetic functional organization by showing that some genes are organized into functional units called operons. An operon is defined as a set of physiologically related genes that are coregulated and coexpressed as a single mRNA (or polycistronic mRNA). This organization enables the cell to coordinate the expression of physiologically related gene products. Approximately one-half of the E. coli genes are organized in operons. What about the other half? Well, despite their utility, operons have limitations. Some cellular processes require the coordinated expression of tens of genes scattered over the chromosome. However, it is inefficient to organize this number of genes in a single operon. Three years after the operon was defined, Maas and Clark observed that there were operons encoding different parts of the arginine biosynthetic pathway dispersed over the chromosome but that these operons were all controlled by the same regulatory protein, the arginine biosynthesis repressor, or ArgR (Maas & Clark 1964). Thus, they had identified a second level of genetic organization, which they named the regulon. They defined a regulon as a set of operons/genes coregulated by the same specific regulatory protein.
Toward a Systems-Level Understanding of Regulation
Since the discovery of transcriptional regulation, scientists have experimentally detected thousands of regulatory interactions. Most studies of transcription regulation in prokaryotic model organisms have been in E. coli, Bacillus subtilis, and Corynebacterium glutamicum. Scientists learned from these experiments that a regulatory network comprises complex circuits of regulatory interactions, but there seemed to be no evidence of organization (Figure 1).
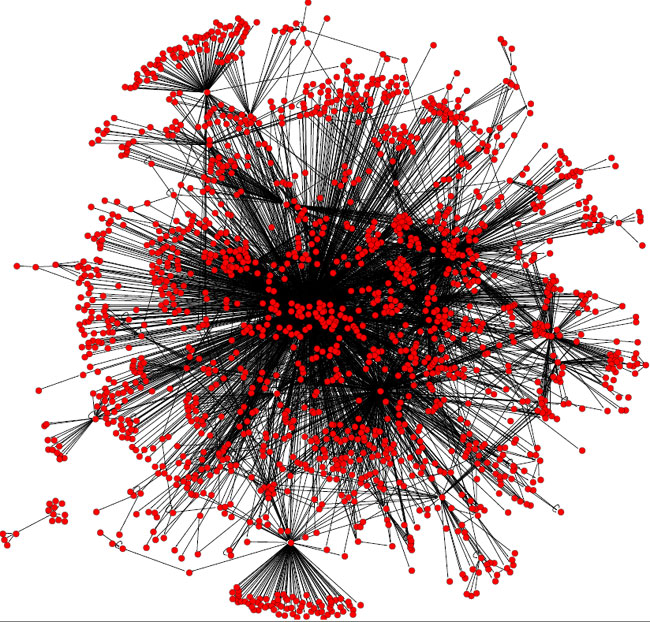
Figure 1: The extreme complexity of the E. coli transcriptional regulatory network.
In this graphical representation, nodes are genes, and edges represent regulatory interactions. The network was reconstructed using data from the RegulonDB (Salgado et al. 2006). This figure highlights the extreme complexity present in regulatory networks. To obtain a deeper understanding of regulatory complexity, scientists must first discover biologically relevant organizational principles to unravel the hidden architecture governing these networks.
© 2010 Nature Education All rights reserved. 
Responding to Particular Physiological Signals
What is a signal? Physiological signals sense the presence or absence of small molecules (e.g., nutrients, salts, and molecular species) or physicochemical states (e.g., temperature, redox potential, and osmolarity). How do signals control the activation of regulatory molecules? The signal induces a steric change in the regulatory molecule, thus activating or inactivating it, through a mechanism known as allosterism. In fact, regulators exhibit a dual (authoritative/dependent) behavior because they can both 1. play an authoritative role in activating or repressing certain genes and 2. depend on environmental cues to be activated or inactivated via allosterism. However, the effect level varies according the signal input (Figure 2).
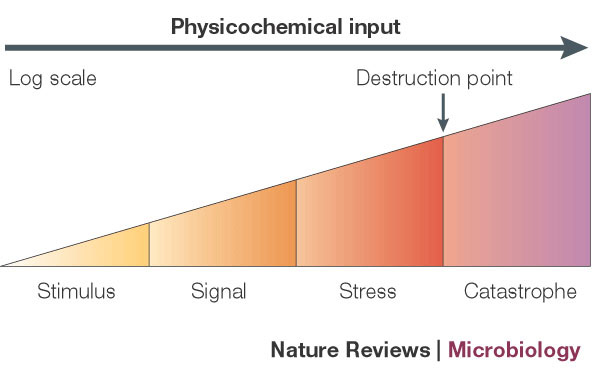
Figure 2: A conceptual diagram of how different levels of effect are triggered by input signals.
The input intensity governs the response level from a stimulus. If the environmental cue exceeds a certain threshold, known in materials science as the "destruction point," then the cell is unable to cope with the environment, and it eventually dies.
© 2005 Nature Publishing Group Cases, I. & de Lorenzo, V. Promoters in the environment: transcriptional regulation in its natural context. Nature Reviews Microbiology 3, 105–118 (2005) doi:10.1038/nrmicro1084. All rights reserved.
The Four Functional Units of Regulation
How can gene expression be organized by the gene's response to environmental signals? As discussed above, scientists learned in the early 1960s that the genes that respond to specific signals are grouped into operons and regulons, which are the first two levels of genetic organization. However, certain complex processes (e.g., flagellar assembly and sporulation) require coordinated expression over time, which cannot occur without a complex regulatory circuit. Therefore, operons and regulons must be embedded into a complex structure called the module that is responsible for well-defined physiological functions. Together, operons, regulons, and modules form a hierarchy (operon < regulon < module) that governs genetic organization. Are there parallels between the definitions of operon, regulon, and module? Certainly, in general terms, both operons and regulons themselves are kinds of modules. This similarity reflects the self-similar nature of genetic organization, in which some modules are nested inside other modules like a set of Russian nesting dolls, or matryoshka.
With these ideas in mind, scientists designed a way to analyze and reveal the complex interrelationships (architecture) of the functional components shaping regulatory networks (Freyre-González et al. 2008). The approach is a form of analysis called "natural decomposition," which refers to the different functional components that are dissected, identified, and classified according to biologically pertinent premises and rules. These scientists based the natural decomposition approach on two biologically relevant premises: (1) A module is a set of genes cooperating to perform a particular physiological function (Hartwell 1999), and (2) given their multiple (pleiotropic) effects, global regulators should not belong to modules, but rather coordinate them in response to general environmental cues (Gottesman 1984). They studied the E. coli regulatory network and identified four key functional components by which to organize the regulatory network: global transcription factors, strictly globally regulated genes, modular genes, and intermodular genes. They chose these functional components because they play important roles in the coordination and integration of physiological responses in a cell.
An analogy between a cell and human business operation can be helpful when conceptualizing the roles of functional components. Cell regulation can be seen as a decision-making process with the following main characteristics. One characteristic is that global transcription factors are analogous to general managers responsible for coordinating specialized cell functions by using wide-scope directives (signals). Another characteristic is that strictly globally regulated genes are cross-functional teams of genes that only respond to broad, nonspecific directives (signals). A third characteristic is that modular genes are composed of departments (modules) devoted to particular cell functions. And the fourth characteristic is that intermodular genes are specialized task forces that integrate directives (signals) coming from different departments (modules) to achieve an integrated response. The organizational chart of a company or a business commonly resembles a pyramid, where a few elements in each layer of the pyramid control a greater number of elements in the layers below. Given this property of hierarchies, feedback is uncommon. In contrast, Freyre-González and his colleagues showed, in fact, that all these functional components in cells form a nonpyramidal, matryoshka-like hierarchy that exhibits feedback (Figure 3).
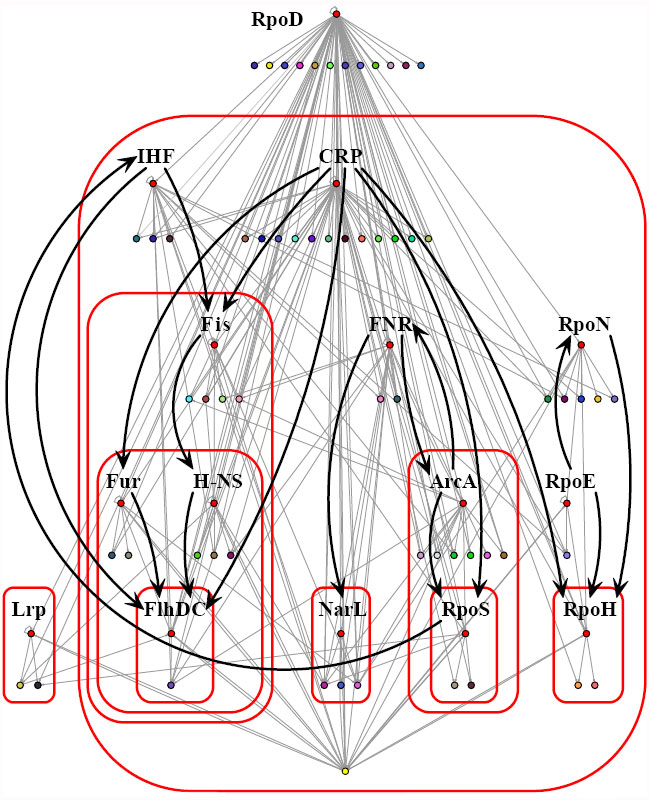
Figure 3: Functional architecture of E. coli genetics as revealed by the natural decomposition approach.
Red-labeled nodes represent global transcription factors. Genes composing modules were shrunk into a single colored node. Black arrows indicate regulatory interactions between global transcription factors. Red rounded-corner rectangles bound hierarchical layers. For the sake of clarity, RpoD (the housekeeping sigma factor) interactions are not shown, and the single yellow node at the bottom represents the megamodule whose submodules are held together only by intermodular genes. This analysis revealed that the functional architecture hierarchy exhibits feedback from well-defined independent modules devoted to particular cellular functions. The functions are globally coordinated by global transcription factors, and the disparate responses are integrated by intermodular genes.
© 2010 Nature Education All rights reserved.
Coordinating Responses to General Signals
How are modules coordinated? Global transcription factors are akin to general managers. They are responsible for coordinating the cell's functional departments (modules) in terms of a common goal and general signals, such as the presence or absence of its main carbon source or various stresses. In a seminal paper, Susan Gottesman defined a global transcription factor as one that 1. regulates many genes, 2. regulates genes that participate in more than one metabolic pathway, and 3. coordinates the expression of gene groups in response to common needs (Gottesman 1984). In addition, scientists have defined two important concepts to study networks: the degree of a node and its clustering coefficient. If we think of nodes in social terms, the degree of a node would tell us how many friends you have, whereas the clustering coefficient gives information about how many of your friends know each other. In different complex networks, ranging from the Internet to molecular networks, scientists have observed that there is an inverse relationship between the degree of the node and its clustering coefficient (Barabási & Oltvai 2004).
This relationship gives rise to an interesting behavior. Although a few nodes have a high degree (hubs with a lot of spokes, or popular people) and a low clustering coefficient (low probability of belonging to a module, or community), many other nodes have the opposite: a low connectivity and a high clustering coefficient. What kind of conclusions could be drawn from these data? Inspired by these definitions and results, Freyre-González and his colleagues reached two conclusions. The first is that given that global transcription factors regulate many genes, they are hubs, and because they exhibit a high degree, they are not modules, but they coordinate them. Their second conclusion was that nonhub nodes must be modules because they show a high clustering coefficient. Therefore, these scientists proposed that the removal of the global transcription factors would naturally reveal the functional modules (Freyre-González et al. 2008). They described an objective mathematical principle, called the k-value, to identify the global transcription factors. This principle is based on the previously mentioned observation that the degree of a node and its clustering coefficient show an inverse relationship. They discovered that it is possible to find an equilibrium point where the change in degree equals the change in clustering coefficient. This equilibrium point separates the nodes with high degrees and low clustering coefficients (the global transcription factors) from the nodes with low degrees and high clustering coefficients (the modular genes) (Freyre-González et al. 2008). Freyre-González and his colleagues observed that all the previously reported E. coli global transcription factors were involved in the response to general signals (e.g., energy levels, redox potential, stress by heat shock, general stresses, and nitrogen metabolism) (Figure 3).
Some genes respond to both specific and general signals. Nevertheless, other gene products are so ubiquitous and important that their expression is only governed by general signals. These strictly globally regulated genes comprise elements for the basal machinery of the cell (e.g., tRNAs and their charging enzymes, DNA and RNA polymerases, ribosomal elements, key enzymes of the tricarboxylic acid cycle and respiratory chain, and DNA methylation enzymes).
Integrating Disparate Physiological Responses
After removing the global transcription factors, Freyre-González and his colleagues observed sixty-two modules and a megamodule. What elements held this megamodule together? Their evidence suggested that the megamodule was held together by non-transcription-factor-encoding genes. Therefore, they defined an intermodular gene as a structural non-transcription-factor-encoding gene whose expression is governed by transcription factors belonging to two or more modules (Freyre-González et al. 2008). Freyre-González and his colleagues showed that this megamodule comprised thirty-nine submodules, which were held together by intermodular genes. Thus, they proposed that the intermodular genes integrated disparate physiological responses at the promoter level.
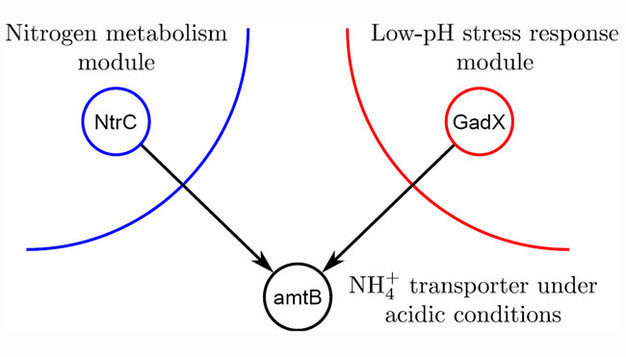
Figure 4: Intermodular genes integrate disparate physiological responses coming from different modules.
NtrC is the general regulator of the nitrogen assimilation pathway. GadX is one of the central regulators of the glutamate-dependent acid resistance system (GAD system). The amtB gene encodes an NH4+ antiporter. Disruption of this gene impaired growth on ammonium only under acidic conditions. Ammonium is precursor of glutamate, which plays a central role in the GAD system.
© 2010 Nature Education All rights reserved.
What are some examples of intermodular genes? One example is the amtB gene, which is coordinated by nitrogen assimilation and acid resistance modules (Figure 4). Other examples include the aceBAK and carAB operons of E. coli. The aceBAK operon encodes the glyoxylate shunt enzymes, which create a metabolic shortcut that enables the biosynthesis of carbohydrates from lipids via acetate generated in fatty acid b-oxidation. The gluconeogenesis and the aerobic fatty acid oxidation pathway modules govern the expression of this operon. Therefore, this operon integrates the responses of these two modules to keep the balance between energy production from fatty acid oxidation and gluconeogenesis activation for the biosynthesis of building blocks. On the other hand, the carAB operon encodes a carbamoyl phosphate synthetase whose product, carbamoyl phosphate, is a common intermediary for the de novo biosynthesis of pyrimidine nucleotides and arginine (an amino acid). The expression of this operon is controlled by three modules: 1. purine and pyrimidine biosynthesis, 2. L-ornithine and L-arginine biosynthesis, and 3. carbamoyl phosphate biosynthesis and regulation of aminopeptidase A/I. In this example, different modules work as coordinators of a shared resource, integrating, at the promoter level, the module's responses to coordinate the expression of an enzyme
Summary
How do scientists try to understand the complex coordination and integration of multiple environmental cues on bacterial gene expression? Four components shape the functional architecture of bacterial regulatory networks: 1. global transcription factors, which are responsible for responding to general signals and for module coordination; 2. strict, globally regulated genes, which are responsible for encoding products important for the basal machinery of the cell and are only governed by global transcription factors; 3. modular genes, which are modules devoted to particular cell functions; and 4. intermodular genes, which are responsible for integrating, at the promoter level, disparate physiological responses coming from different modules to achieve an integrated response. All these functional components form a nonpyramidal, matryoshka-like hierarchy exhibiting feedback. In this functional architecture, well-defined independent modules are globally coordinated by global transcription factors, whose disparate physiological responses are integrated, at the promoter level, by intermodular genes. These conclusions open the door to new questions regarding the evolution of regulatory networks: How conserved is this functional architecture among bacteria? Is it conserved among other domains, such as the archaea? Do bacterial obligate parasites exhibit a similar functional architecture, but with fewer modules? Do ancestral modules exist (i.e., modules appearing in a common ancestor, which are still conserved by its offspring)? What are the evolutionary forces, if any, shaping this functional architecture in bacteria? These questions pose new challenges to our understanding of the inner workings of bacteria and their evolution.
References and Recommended Reading
Barabási, A. L. & Oltvai, Z. N. Network biology: Understanding the cell's functional organization. Nature Reviews Genetics 5, 101–113 (2004) doi:10.1038/nrg1272.
Cases, I. & de Lorenzo, V. Promoters in the environment: Transcriptional regulation in its natural context. Nature Reviews Microbiology 3, 105–118 (2005) doi:10.1038/nrmicro1084.
Freyre-González, J. A. et al. Functional architecture of Escherichia coli: New insights provided by a natural decomposition approach. Genome Biology 9, R154 (2008) doi:10.1186/gb-2008-9-10-r154.
Gottesman, S. Bacterial regulation: global regulatory networks. Annual Review of Genetics 18, 415–441 (1984) doi:10.1146/annurev.ge.18.120184.002215.
Hartwell, L. H. et al. From molecular to modular cell biology. Nature 402, C47–C52 (1999) doi:10.1038/35011540.
Jacob, F. & Monod, J. Genetic regulatory mechanisms in the synthesis of proteins. Journal of Molecular Biology 3, 318–356 (1961) doi:10.1016/S0022-2836(61)80072-7.
Maas, W. K. & Clark, A. J. Studies on the mechanism of repression of arginine biosynthesis in Escherichia coli. II. Dominance of repressibility in diploids. Journal of Molecular Biology 8, 365–370 (1964) doi:10.1016/S0022-2836(64)80200-X.
Salgado, H. et al. RegulonDB (version 5.0): Escherichia coli K-12 transcriptional regulatory network, operon organization, and growth conditions. Nucleic Acids Research 34, D394–D397 (2006) doi:10.1093/nar/gkj156.
Timmis, K. N. & Pieper, D. H. Bacteria designed for bioremediation. Trends in Biotechnology 17, 200–204 (1999) doi:10.1016/S0167-7799(98)01295-5.


