Segmentation in the fruit fly embryo
Keywords
Flag Inappropriate
Delete Content
Segmentation in the fruit fly embryo
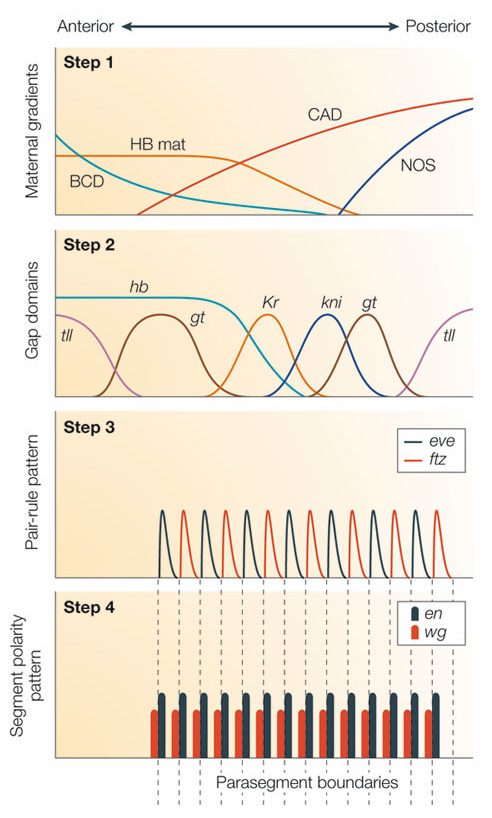
Four graphs show the patterns of gene expression at 4 time points during early drosophila embryo development. The spatial distributions of gene expression are represented in line plots for each time point. The collection of plots represents the on/off pattern and spatial distributions of gene expression over the early developmental time period. The collection of genes represented govern segmentation in the body of a fruit fly.
This image is linked to the following Scitable pages:

You may take for granted the fact that your body isn't the same from head to toe. Have you stopped and wondered why? Controlling gene expression to turn on and off at specific times is no simple feat.


Comments
CloseComments
Please Post Your Comment