


« Prev Next »
May 31, 2015
|
By:
Mark Stokes
What does MEG measure?
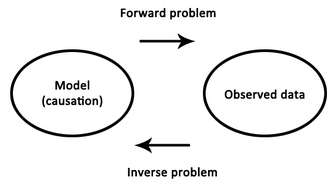 in which one begins with a set of observations (e.g., EEG signals) and has to work backwards to try to calculate what caused them (e.g., neural activity in a specific brain region). A massive obstacle to this approach is the fact that as electrical signals pass from the brain to the scalp they become heavily distorted by the skull. This distortion makes it exceedingly difficult to try to reconstruct the underlying sources in the brain.
 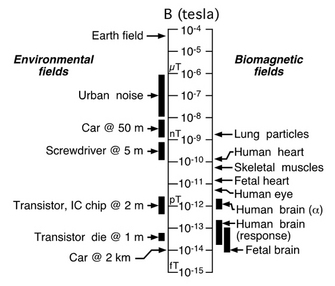 whisper. His shielding technique became central to the advent of magnetoencephalography (MEG), which measures the yet even quieter magnetic fields generated by the brain's electrical activity.
 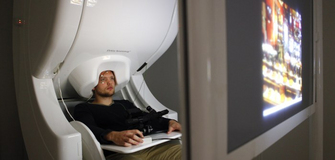 A MEG scanner is a large machine allowing participants to sit upright. As its centrepiece, it contains a helmet populated with many hidden SQUIDs cooled at all times by liquid helium. Typical scanners contain about 300 sensors covering the entirety of the scalp. These sensors include magnetometers, which measure magnetic fields directly, and gradiometers, which are pairs of magnetometers placed at a small distance from each other, measuring the difference in magnetic field between their two locations (hence "gradient" in the name). This difference measure subtracts out large and distant sources of magnetic noise (such as earth's magnetic field), while remaining sensitive to local sources of magnetic fields (such as those emanating from the brain). Due to their positioning, magnetometers and gradiometers also provide complementary information about the direction of magnetic fields.
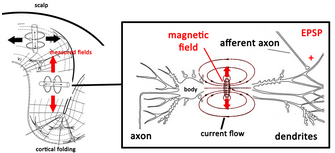 transiently depolarised relative to the body of the neuron. This difference in potential generates a current flow both inside and outside the neuron, which creates a magnetic field. One such event, however, is still insufficient in generating a magnetic field large enough to be detected even by the mightiest of SQUIDs, so it is thought that the fields measured in MEG are the result of at least 50,000 neurons simultaneously experiencing EPSPs or IPSPs within a certain region. Unfortunately, current technology and analysis methods are limited to detecting magnetic fields generated along the cortex, the bit of the brain closest to the scalp. Fields generated in deeper cortical and subcortical areas rapidly dissipate as they travel much longer distances through the brain. To complicate things further, we have to remember that magnetic fields obey Ampère's right-hand rule which states that if a current flows in the direction of the thumb in a "thumbs-up" gesture of the right hand, the generated magnetic field will flow perpendicularly to the thumb, in the direction of the fingers. This means that only neurons oriented tangentially along the skull surface generate magnetic fields which radiate outwards in the direction of the skull to be measured at the surface. Fortunately, mother nature has cut scientists some slack here, as the pervasive folding pattern (gyrification) of the brain's cortex provides us with plenty of neurons arranged in the direction useful for MEG measurement. The cortex alone is enough to keep scientists busy, and findings from fMRI and direct electrophysiological recordings from non-human animals provide complementary information about the world underneath the cortex, and how it may all fit together.
Analysis of MEG data can be done in sensor space, in which one simply looks at how the signals at individual sensors change during different parts of a cognitive task. This provides a rough estimate of the activation patterns along the cortex. The perk of MEG, however, is the ability to project data recorded in the 300 sensors to source space, and effectively estimate where in the brain these signals may originate. Although this is certainly more feasible in MEG than EEG, the inverse problem is actual a fundamental issue to both types of extracranial recordings (we don't have this problem when measuring directly from the brain during intracranial recording). One way to narrow down which possible activation regions in the brain could underlie the observed magnetic fields is to establish certain assumptions about what we expect brain activity to look like in general, and how that activity is translated into the signal measured at the scalp. Such assumptions are more reasonable in MEG than EEG due to the higher fidelity of magnetic fields as they pass from the brain to scalp.
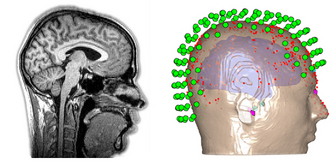 Another assumption is that the fate of the travelling magnetic fields depends on the physical size, shape, and organisation of the brain and scalp. To this end, MEG data across all 300 sensors are registered to an MRI scan of each participant's head and a 3D mapping of their scalp (obtained by literally marking hundreds of points along each participant's scalp using a digital pen), which together provide a high spatial resolution description of the anatomy of the entire head, brain included. These assumptions, among others, are used to mathematically estimate where in the brain the measured magnetic fields may have originated at each point in time.
 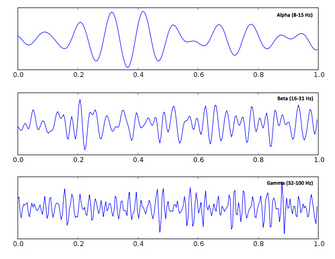 fields changes with respect to an event of interest during a cognitive task (e.g., the appearance of an image). The idea is that although there is a lot of noise in the measurement, if one averages many trials together the noise will cancel out, while the effect of interest, which always occurs in relation to a precisely timed event in the cognitive task, will remain. This follows in the tradition of EEG analysis, in which these evoked responses are called event-related potentials. Alternatively, one can use Fourier transformations to break the data down into frequency components, also known as waves, rhythms, or oscillations, and measure changes in their phase or amplitude in response to cognitive events. This follows in the tradition established by Berger himself, who discovered and named alpha and beta waves. Neural oscillations have recently received a lot of attention as they are suggested to be involved in synchronizing the activity of populations of neurons, and have been associated with a number of cognitive functions such as attentional control and movement preparation, as in the case of alpha and beta oscillations, respectively.
This is a guest post by Lev Tankelevitch, one of my PhD students. He is currently using MEG to explore reward-guided attention at the Oxford Centre for Human Brain activity. This article is also cross-posted at the Brain Box.
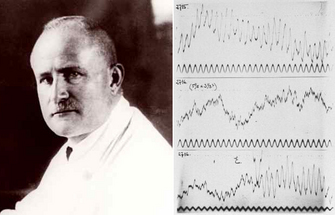
In 1935, Hans Berger writes in one of his seminal reports on the electroencephalogram (EEG), addressing the controversy surrounding the origin of the then unbelievable electrical potentials recorded by him from the human scalp:
"I disagree with the statement of the English investigators that the EEG originates exclusively in the occipital lobe. The EEG originates everywhere in the cerebral cortex...In the EEG a fundamental function of the human cerebrum intimately connected with the psychophysical processes becomes visible manifest." (see here for a history of Hans Berger and the EEG)
Decades later, the correctness of his position is both a blessing and a curse - we now know that the entire brain produces EEG signals, but it has been a struggle to match components of the EEG to their specific sources in the brain, and thus to further our understanding of how exactly the functioning of the brain relates to those psychophysical processes with which Berger was so enthralled. This struggle is best summarised as an inverse problem,
In 1969, the journey to understand the electrical potentials of the brain took an interesting and fruitful detour when David Cohen, a physicist working at MIT, became the first to confidently measure the incredibly tiny magnetic fields produced by the heart's electrical signals (see here for a talk by David Cohen on the origins of MEG). To do this, he constructed a shielded room, blocking interference from the overwhelming magnetic fields generated by earth itself and by other electrical devices in the vicinity, effectively closing the door on a cacophony of voices to carefully listen to a slight
This approach to record the brain's magnetic fields, rather than the electrical potentials themselves, was advanced even further by James Zimmerman and others working at the Ford Motor Company, where they developed the SQUID, a superconducting quantum interference device. A SQUID is an extremely sensitive magnetometer, operating on the principles of quantum physics beyond the scope of this article, which is able to detect precisely those very tiny magnetic fields produced by the brain. To appreciate the contributions of magnetic shielding and SQUIDs to magnetoencephalography, consider that the earth's magnetic field, the one acting on your compass needle, is at least 200 million times the strength of the fields generated by your brain trying to read that very same
compass.
Given that these magnetic fields occur simultaneously with electrical activity, MEG is afforded the same millisecond resolution as EEG, allowing one to examine neural activity at its natural temporal resolution. This is in contrast to functional magnetic resonance imaging, fMRI, which, using magnetic fields as a tool rather than a target of measurement, actually measures changes in blood oxygenation which occur on the order of seconds, making it impossible to effective pinpoint the time of neural activity (see here). Another advantage over fMRI is the fact that electromagnetic signals are more directly related to the underlying neural activity than the haemodynamic response, which may differ across brain regions, clinical populations, or with respect to drug effects, thereby complicating interpretations of observed effects. Unlike the electrical potentials measured in EEG, however, the magnetic fields measured in MEG pass from the brain through the skull in a relatively undisturbed manner, substantially simplifying the inverse problem. In these ways, for a non-invasive technique, MEG best combines high temporal resolution and improves source localisation within the human brain.
What exactly do those tiny magnetic fields reflect about brain activity? When a neuron receives communication from a neighbour, an excitatory or inhibitory postsynaptic potential (EPSP or IPSP) is generated in the neuron's dendrites, causing that local dendritic membrane to become
At the end of a long and arduous MEG scanning session, one is left with about 300 individual time series, typically recorded at 1000 Hz, reflecting tiny changes in magnetic fields driven by neural activity presumably occuring in response to some cognitive task. Although the shielded room blocks out magnetic interference from other electrical devices (and all equipment inside the room works through optical fibres), there is still massive interference from the subject's heart and any other muscle activity around the head. For this reason, participants are typically instructed to limit eye movements and blinking and any remaining artefactual noise in the data (i.e., anything not thought to be brain activity) is taken out at the analysis stage using techniques like independent component analysis.
Analysis of MEG data can be done in sensor space, in which one simply looks at how the signals at individual sensors change during different parts of a cognitive task. This provides a rough estimate of the activation patterns along the cortex. The perk of MEG, however, is the ability to project data recorded in the 300 sensors to source space, and effectively estimate where in the brain these signals may originate. Although this is certainly more feasible in MEG than EEG, the inverse problem is actual a fundamental issue to both types of extracranial recordings (we don't have this problem when measuring directly from the brain during intracranial recording). One way to narrow down which possible activation regions in the brain could underlie the observed magnetic fields is to establish certain assumptions about what we expect brain activity to look like in general, and how that activity is translated into the signal measured at the scalp. Such assumptions are more reasonable in MEG than EEG due to the higher fidelity of magnetic fields as they pass from the brain to scalp.
For example, neural activation in the brain is assumed to be smooth. Imagine all the active neurons in a brain at a single point in time as stars in the sky: smooth activation would mean that the stars would form little clusters, rather than appear completely randomly all over the sky. Indeed, this feature of brain activation is what allows us to detect any magnetic fields using MEG in the first place! Remember that only many neurons within a local region which happen to be simultaneously active generate fields strong enough to be detected at the scalp.
There are two general approaches when analyzing MEG data. Analysis of event-related fields looks at how the timing or the size of the magnetic
Other resources:
For a slightly more in-depth description of MEG, see here.
For a more in-depth description of MEG acquisition, see this video.
And for the kids, see this excellent article at Frontiers for Young Minds
References
Baillet, S., Mosher, J.C., & Leahy, R.M. (2001). Electromagnetic brain mapping. IEEE Signal Processing Magazine..
Fernando H, Lopes da Silva. MEG: an introduction to methods. eds: Hansen, Kringelback & Salmelin. USA: OUP, 2010:1-23, figure 1.3 from p6.
La Vaque, T. J. (1999). The History of EEG Hans Berger: Psychophysiologist. A Historical Vignette. Journal of Neurotherapy.
Proudfoot, M., Woolrich, M.W., Nobre, A.C., & Turner, M. (2014). Magnetoencephalography. Pract Neurol, 0, 1-8.
Schoenfeld, M.A., Hopf, J-M., Merkel, C. Heinz, H-J., & Hillyard, S.A. (2014). Object-based attention involves the sequential activation of feature-specific cortical modules. Nature Neuroscience, 17(4).
Vrba, J. (2002). Magnetencephalography: the art of finding a needle in a haystack. Physica C, 368, 1-9.
The data figures are from papers cited above. All other figures are from Wiki Commons.
May 16, 2015
|
By:
Mark Stokes
What does fMRI measure?
|
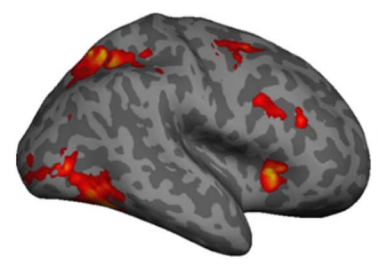
Fig 1. From Kuo, Stokes, Murray & Nobre (2014) |
When you say ‘brain activity', many people first think of activity maps generated by functional magnetic resonance imaging (fMRI; see figure 1). As a non-invasive braining imaging method, fMRI has become the go-to workhorse of cognitive neuroscience. Since the first papers were published in the early 1990s, there has been an explosion of studies using this technique to study brain function, from basic perception to mind-reading for communicating with locked-inpatients or detecting lies in criminal investigations. At its best, fMRI provides unparalleled access to detailed patterns of activity in the healthy human brain; at its worst, fMRI could reduce to an expensive generator of 3-dimensional Rorschach images. To understand the relative strengths and weaknesses of fMRI, it is essential to understand exactly what fMRI measures. Without delving too deeply into the nitty-gritty (see below for further reading), we will cover the basics that are necessary for understanding the potential and limits of this ever popular and powerful tool.
"fMRI does not directly measure brain activity"
First and foremost, electricity is the language of the brain. At any moment, there are millions of tiny electrical impulses (action potentials) whizzing around your brain. At synaptic junctions, these impulses release specific chemicals (i.e., neurotransmitters), which in turn modulate the electrical activity in the next cell. This is the fundamental basis for neural communication. Somehow, these processes underpin every thought/feeling/action you have ever experienced. Our challenge is to understand how these electric events give rise to these phenomena of mind.
However, fMRI does not exactly measure electrical activity (compare EEG, MEG, intracranial neurophysiology); but rather it measures the indirect consequences of neural activity (the haemodynamic response). The pathway from neural activity to the fMRI activity map is schematised in figure 2 below:
|
Fig 2. From Arthurs & Boniface (2002) |
|
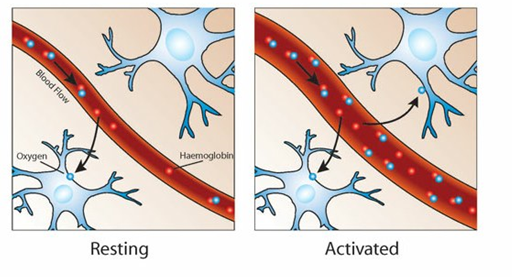
Fig 3. From Oxford Sparks |
To summarise, let's consider three key principles: 1) neural activity is systematically associated with changes in the relative concentration of oxygen in local blood supply (figure 3); 2) oxygenated blood has different magnetic susceptibility relative to deoxygenated blood; 3) changes in the ratio of oxygenated/de-oxygenated blood (haemodynamicresponse function; figure 4) can be inferred with fMRI by measuring the blood-oxygen-leveldependent (BOLD) response.
|
So fMRI only provides an indirect measure of brain activity. This is not necessarily a bad thing. Your classic thermometer does not directly measure ‘temperature', but rather the volume of mercury in a glass tube. Because these two parameters are tightly coupled, a well calibrated thermometer does a nice job of tracking temperature. The problem arises when the coupling is incomplete, noisy or just very complex. For example, the haemodynamic response is probably most tightly coupled to synaptic events rather than action potentials (see here). This means certain types of activity will be effectively invisible to fMRI, resulting in systematic biases (e.g., favouring input (and local processing) to output neural activity). The extent to which coupling depends on unknown (or unknowable) variability also limits the extent to which we can interpret the BOLD signal. Basic neurophysiological research is therefore absolutely essential for understanding exactly what we are measuring when we switch on the big scanner. See here for an authoritative review by Logothetis, a great pioneer in neural basis of fMRI.
"spatial resolution"
Just like your digital camera, a brain scan can be defined by units of spatial resolution. However, because the image is 3D, we call these volumetric pixels, or voxels for short. In a typical scan, each voxel might cover 3mm3 of tissue, a volume that would encompass ~ 630,000 neurons in cortex. However, the exact size of the voxel only defines the theoretically maximal resolution. In practice, the effective resolution in fMRI also depends on the spatial specificity of the hemodynamic response, as well as more practical considerations such as the degree of head movement during scanning. These additional factors can add substantial spatial distortion or blurring. Despite these limits, there are few methods with superior spatial resolution. Intracranial recordings can measure activity with excellent spatial precision (even isolating activity from single cells), but this invasive procedure is limited to animal models or very specific clinical conditions that require this level of precision for diagnostic purposes (see here). Moreover, microscopic resolution isn't everything. If we focus in too closely without seeing the bigger picture, there is always the danger of not seeing the forest for all the trees. fMRI provides a good compromise between precision and coverage. Ultimately, we need to bridge different levels of analysis to capitalise on insights that can only be gained with microscopic precision and macroscopic measures that can track larger-scale network dynamics.
"snapshot is more like a long exposure photograph"
|
Fig 5. Wiki Commons |
Every student in psychology or neuroscience should be able to tell you that fMRI has good spatial resolution (as above), but poor temporal resolution. This is because the haemodynamic response imposes a fundamental limit on the time-precision of the measurement. Firstly, the peak response is delayed by approximately 4-6 seconds. However, this doesn't really matter for offline analysis, because we can simply adjust our recording to correct for this lag. The real problem is that the response is extended over time. Temporal smoothing makes it difficult to pinpoint the precise moment of activity. Therefore, the image actually reflects an average over many seconds. Think of this like a very long long-exposure photograph (see figure 5), rather than a snapshot of brain activity. This makes it very difficult to study highly dynamic mental processes - fast neural processes are simply blurred. Methods that measure electrical activity more directly have inherently higher temporal resolution (EEG, MEG, intracranial neurophysiology).
"too much data to make sense of"
A standard fMRI experiment generates many thousands of measures in one scan. This is a major advantage of fMRI (mass simultaneous recording), but raises a number of statistical challenges. Data mining can be extremely powerful, however the intrepid data explorer will inevitably encounter spurious effects, or false positives (entertain yourself with some fun false positives here).
This is more of an embarrassment of riches, rather than a limit. I don't believe that you can ever have too much data, the important thing is to know how to interpret it properly (see here). Moreover, the same problem applies to other data-rich measures of brain activity. The solution is not to limit our recordings, but to improve our analysis approaches to the multivariate problem that is the brain (e.g., see here).
"too many free parameters"
There are many ways to analyse an fMRI dataset, so which do you choose? Especially when many of the available options make sense and can be easily justified, but different choices generate slightly different results. This dilemma will be familiar to anyone who has ever analysed fMRI. A recent paper identified 6,912 slightly different paths through the analysis pipeline, resulting in 34,560 different sets of results. By fully exploiting this wiggle room, it should be possible to generate almost any kind of result you would like (see here for further consideration). Although this flexibility is not strictly a limit in fMRI (and certainly not unique to fMRI), it is definitely something to keep in mind when interpreting what you read in the fMRI literature. It is important to define the analysis pipeline independently of your research question, rather than try them all and choose the one that gives you the ‘best' result. Otherwise there is a danger that you will only see what you want to see (i.e., circular analysis).
"...correlation, not causation"
It is often pointed out the fMRI can only provide correlational evidence. The same can be said for any other measurement technique. Simply because a certain brain area lights up with a specific mental function, we cannot be sure that the observed activity actually caused the mental event (see here). Only an interference approach can provide such causal evidence. For example, if we ‘knock-out' a specific area (e.g., natural occurring brain damage, TMS, tDCS, animal ablation studies, optogenetics), and observe a specific impairment in behaviour, then we can infer that the targeted area normally plays a causal role. Although this is strictly correct, this does not necessarily imply the causal methods are better. Neural recordings can provide enormously rich insights into how brain activity unfolds during normal behaviour. In contrast, causal methods allow you to test how the system behaves without a specific area. Because there is likely to be redundancy in the brain (multiple brain areas capable of performing the same function), interference approaches are susceptible to missing important contributions. Moreover, perturbing the neural system is likely to have knock-on effects that are difficult to control for, thereby complicating positive effects. These issues probably deserve a dedicated post in the future. But the point for now is simply to note that one approach is not obviously superior to the other. It depends on the nature of the question.
"...the spectre of reverse inference"
A final point worth raising is the spectre of reverse inference making. In an influential review paper, Russ Poldrak outlines the problem:
The usual kind of inference that is drawn from neuroimaging data is of the form ‘if cognitive process X is engaged, then brain area Z is active'. Perusal of the discussion sections of a few fMRI articles will quickly reveal, however, an epidemic of reasoning taking the following form:
- In the present study, when task comparison A was presented, brain area Z was active.
- In other studies, when cognitive process X was putatively engaged, then brain area Z was active.
- Thus, the activity of area Z in the present study demonstrates engagement of cognitive process X by task comparison A.
This is a ‘reverse inference', in that it reasons backwards from the presence of brain activation to the engagement of a particular cognitive function.
Reverse inferences are not a valid from of deductive reasoning, because there might be other cognitive functions that activate the brain area. Nevertheless, the general form of reasoning can provide useful information, especially when the function of the particular brain area is relatively specific and particularly well-understood. Using accumulated knowledge to interpret new findings is necessary for theory building. However, in the asbence of a strict one-to-one mapping between structure and function, reverse inference is best approached from a Bayesian perspective rather than a logical inference.
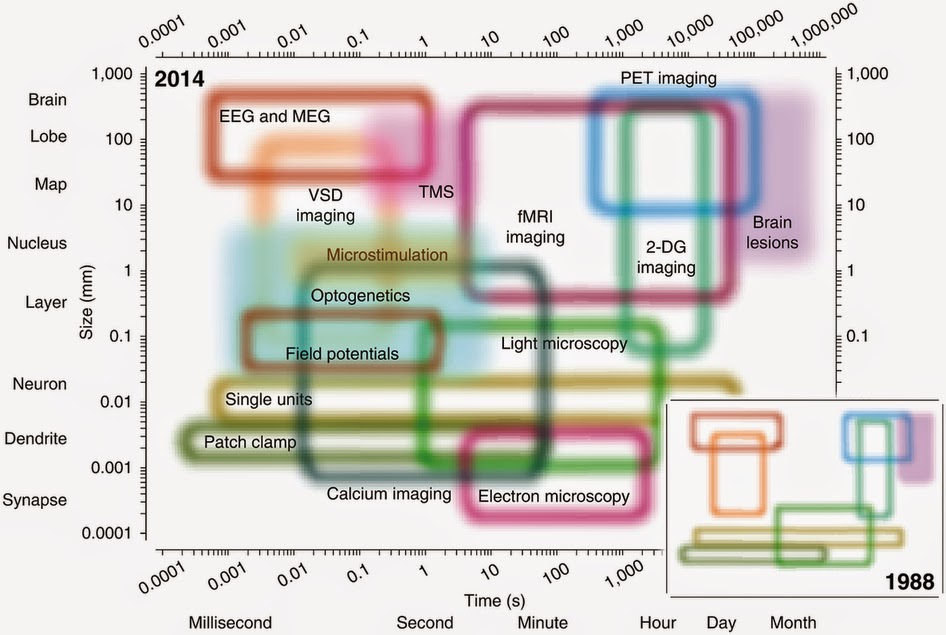
Summary: fMRI is one of the most popular methods in cognitive neuroscience, and certainly the most headline grabbing. fMRI provides unparalleled access to the patterns of brain activity underlying human perception, memory and action; but like any method, there are important limitations. To appreciate these limits, it is important understand some of the basic principles of fMRI. We also need to consider fMRI as part of a broader landscape of available techniques, each with their unique strengths and weakness (figure 6). The question is not so much: is fMRI useful? But rather: is fMRI the right tool for my particular question.
|
Fig 6. from Sejnowski, Churchland and Movshon, 2014, Nature Neuroscience |
[this post is adapted from The Brain Box]
Further reading:
Oxford Sparks (see below for video demo)
Key references:
Arthurs, O. J., & Boniface, S. (2002). How well do we understand the neural origins of the fMRI BOLD signal? Trends Neurosci, 25(1), 27-31. doi: Doi 10.1016/S0166-2236(00)01995-0
Logothetis, N. K. (2008). What we can do and what we cannot do with fMRI. Nature, 453(7197), 869-878. doi: DOI 10.1038/nature06976
Poldrack, R. A. (2006). Can cognitive processes be inferred from neuroimaging data? Trends Cogn Sci, 10(2), 59-63. doi: DOI 10.1016/j.tics.2005.12.004
Sejnowski, T. J., Churchland, P. S., & Movshon, J. A. (2014). Putting big data to good use in neuroscience. Nat Neurosci, 17(11), 1440-1441.
Fun demonstration from Oxford Sparks:
May 01, 2015
|
By:
Mark Stokes
Peering directly into the human brain
 With the rise of non-invasive brain imaging such as functional magnetic resonance imaging (fMRI), researchers have been granted unprecedented access to the inner workings of the brain. It is now relatively straightforward to put your experimental subjects in an fMRI machine and measure activity 'blobs' in the brain. This approach has undoubtedly revolutionised cognitive neuroscience, and looms very large in people's idea of contemporary brain science. But fMRI has it's limitations. As every student in the business should know, fMRI has poor temporal resolution. fMRI is like a very long-exposure photograph: the activity snapshot actually reflects an average over many seconds. Yet the mind operates at the millisecond scale. This is obviously a problem. Neural dynamics are simply blurred with fMRI. However, probably more important is the theoretical limit.
 complex, therefore fMRI can only provide a relatively indirect measure of neural activity. Electroencephalography (EEG) is a classic method for measuring actual electrical activity. It has been around for more than 100 years, but again, as every student should know: EEG has poor spatial resolution. It is difficult to know exactly where the activity is coming from. Magnetoencephalography (MEG) is a close cousin of EEG. Developed more recently, MEG is better at localising the source of brain activity. But the fundamental laws of physics mean that any measure of electromagnetic activity from outside the head will always be spatially ambiguous (the inverse problem). The best solution is to record directly from the surface of the brain. Here we discuss the unique opportunities in that arise in the clinic to measure electrical activity directly from the human brain using electrocorticography (ECoG).
 Epilepsy can be a seriously debilitating neurological condition. Although the symptoms can often be managed with medication, some patients continue to have major seizures despite a cocktail of anti-epileptic drugs. So-called intractable epilepsy affects every aspect of life, and can even be life-threatening. Sometimes the only option is neurosurgery: careful removal of the specific brain area responsible for seizures can dramatically improve quality of life.
During the clinical observation period, patients are typically stuck on the hospital ward with electrodes implanted in their brain literally waiting for a seizure to happen so that the epileptic brain activity can be ‘caught on camera'. This observation period provides a unique opportunity to also explore healthy brain function. If patients are interested, they can perform some simple experiments using computer based tasks to determine how different parts of the brain perform different functions. Previous studies from some of the great pioneers in neuroscience mapped out the motor cortex by stimulating different brain areas during neurosurgery. Current experiments are continuing in this tradition to explore less well charted brain areas involved in high-level thought. For example, in a recent study from Berkeley, researchers used novel brain decoding algorithms to convert brain activity associated with internal speech into actual words (listen to the audio reconstructions here). This research helps us understand the fundamental neural code for the internal dialogue that underlies much of conscious thought, but could also help develop novel tools for providing communication to those otherwise unable to general natural speech.
 understanding of brain function. They have dedicated their valuable time in otherwise adverse circumstances to help neuroscientists explore the very frontiers of the brain. These patients are true pioneers.
Electricity is the language of the brain, but fMRI only measures changes in blood flow that are coupled to these electrical signals. This coupling is
Psychology students should be familiar with the case of Henry Molaison (aka HM). Probably the most famous neuropsychology patient in history, HM suffered intractable epilepsy until the neurosurgeon William Scoville removed two large areas of tissue in the medial temporal lobe, including left and right hippocampus. This pioneering surgery successfully treated his epilepsy, but this is not why the case became so famous in neuropsychology. Unfortunately, the treatment also left HM profoundly amnesic. It turns out that removing both sides of the medial temporal lobe effectively removes the brain circuitry for forming new memories. This lesson in functional neuroanatomy is what made the case of HM so important, but there was also a important lesson for neurosurgery - be careful which parts of the brain you remove!
The best way to plan a neurosurgical resection of epileptic tissue is to identify exactly where the seizure is comping from. The best way to map out the affected region is to record activity directly from the surface of the brain. This typically involves neurosurgical implantation of recording electrodes directly in the brain to be absolutely sure of the exact location of the seizure focus. Activity can then be monitored over a number of days, or even weeks, for seizure related abnormalities. This invasive procedure allows neurosurgeons to monitor activity in specific areas that could be the source of epileptic seizures, but also provides a unique opportunity for neuroscientific research.
During the clinical observation period, patients are typically stuck on the hospital ward with electrodes implanted in their brain literally waiting for a seizure to happen so that the epileptic brain activity can be ‘caught on camera'. This observation period provides a unique opportunity to also explore healthy brain function. If patients are interested, they can perform some simple experiments using computer based tasks to determine how different parts of the brain perform different functions. Previous studies from some of the great pioneers in neuroscience mapped out the motor cortex by stimulating different brain areas during neurosurgery. Current experiments are continuing in this tradition to explore less well charted brain areas involved in high-level thought. For example, in a recent study from Berkeley, researchers used novel brain decoding algorithms to convert brain activity associated with internal speech into actual words (listen to the audio reconstructions here). This research helps us understand the fundamental neural code for the internal dialogue that underlies much of conscious thought, but could also help develop novel tools for providing communication to those otherwise unable to general natural speech.
In Stanford, researchers were recently able to identify a brain area that codes for numbers and quantity estimation (read study here). Critically, they were even able to show that this area is involved in everyday use for numerical cognition, rather than just under their specific experimental conditions. See video below.
The great generosity of these patients vitally contributes to the broader
[this post is adapted from The Brain Box]
Key References
Pasley, B. N., David, S. V., Mesgarani, N., Flinker, A., Shamma, S. A., Crone, N. E., Knight, R. T., & Chang, E. F. (2012). Reconstructing speech from human auditory cortex. PLoS Biol, 10, e1001251.
The two data figures are from the two papers cited above. All other figures are from Wiki Commons.
Video showing the use of a number processing brain area in everyday use:
![]()

Share
Close


