BICCN: The first complete cell census and atlas of a mammalian brain
Generating a complete multimodal cell census and atlas of the mouse brain through collaborative data collection, tool development and analysis.


Over 100 years ago, Ramon y Cajal began to reveal the extraordinary diversity and heterogeneity of the individual cells in the brain. Classifying this diversity into an organized census has been a multi-generational endeavour. Now, as reported in ten articles published in Nature, researchers from the BRAIN Initiative Cell Census Network (BICCN) have used cutting-edge single-cell and spatial genomics technologies to comprehensively define and localize cell types within the brain of the mouse (Mus musculus), the most widely used laboratory model in vertebrate neuroscience. Integration of these datasets has resulted in a comprehensive atlas of neuronal and non-neuronal cell types in the entire adult mouse brain with exceptionally high molecular and spatial resolution.
A comprehensive resource with broad applications


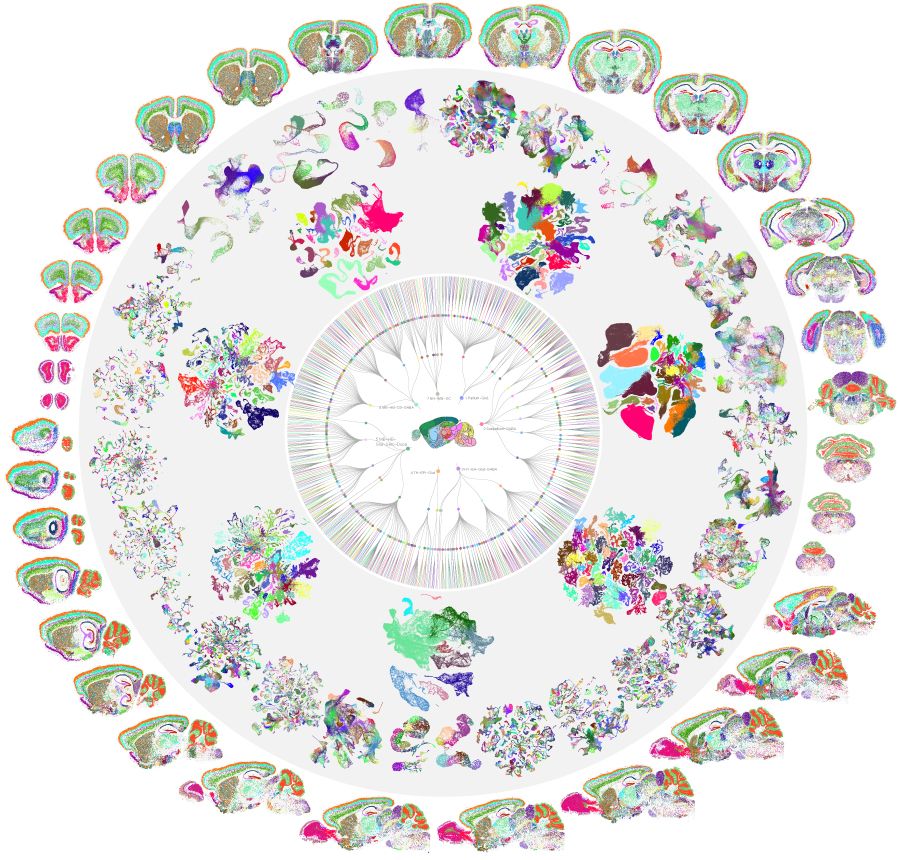
A cell-type atlas of the whole mouse brain with more than 5,300 clusters, shown as a mandala to unfold extraordinary diversity, with a circular dendrogram, 7 large neighborhood UMAPs, 34 cell-class specific UMAPs, and whole-brain MERFISH sections surrounding a mouse brain in the centre. Credit: Cindy van Velthoven, Zizhen Yao and Hongkui Zeng.
This atlas combines single-cell transcriptomic, epigenomic and spatial transcriptomic characterization of more than 32 million cells across all parts of the mouse brain. Additional characterization of their connectivity systematically reveals the molecular-genetic diversity of cell types in the entire brain.
Using single-cell and single-nucleus RNA sequencing (scRNA-seq and snRNA-seq), researchers profiled more than 13 million cells and nuclei, covering hundreds of individually dissected brain regions and providing comprehensive, hierarchically organized transcriptomic cell-type taxonomies with dozens of cell classes, hundreds of subclasses, and more than 5,300 cell clusters throughout the brain. The taxonomies uncovered more than 8,000 cell-type marker genes, with a minimum set of about 2,000 combinatorial marker genes that can distinguish among all identified cell types.
From this work, we now have a more complete, quantitative and definitive understanding of the relative molecular diversity of individual brain regions, the neurotransmitters and neuropeptides used by particular cell types and the covariation of cell types across neuroanatomical structures, as well as a combinatorial transcription factor gene set that delineates the hierarchical relationship among cell types throughout the brain.

A cell-type atlas of the whole mouse brain with more than 5,300 clusters, shown as a mandala to unfold extraordinary diversity, with a circular dendrogram, 7 large neighborhood UMAPs, 34 cell-class specific UMAPs, and whole-brain MERFISH sections surrounding a mouse brain in the centre. Credit: Cindy van Velthoven, Zizhen Yao and Hongkui Zeng.
A cell-type atlas of the whole mouse brain with more than 5,300 clusters, shown as a mandala to unfold extraordinary diversity, with a circular dendrogram, 7 large neighborhood UMAPs, 34 cell-class specific UMAPs, and whole-brain MERFISH sections surrounding a mouse brain in the centre. Credit: Cindy van Velthoven, Zizhen Yao and Hongkui Zeng.
Building the transcriptomic and spatial atlas


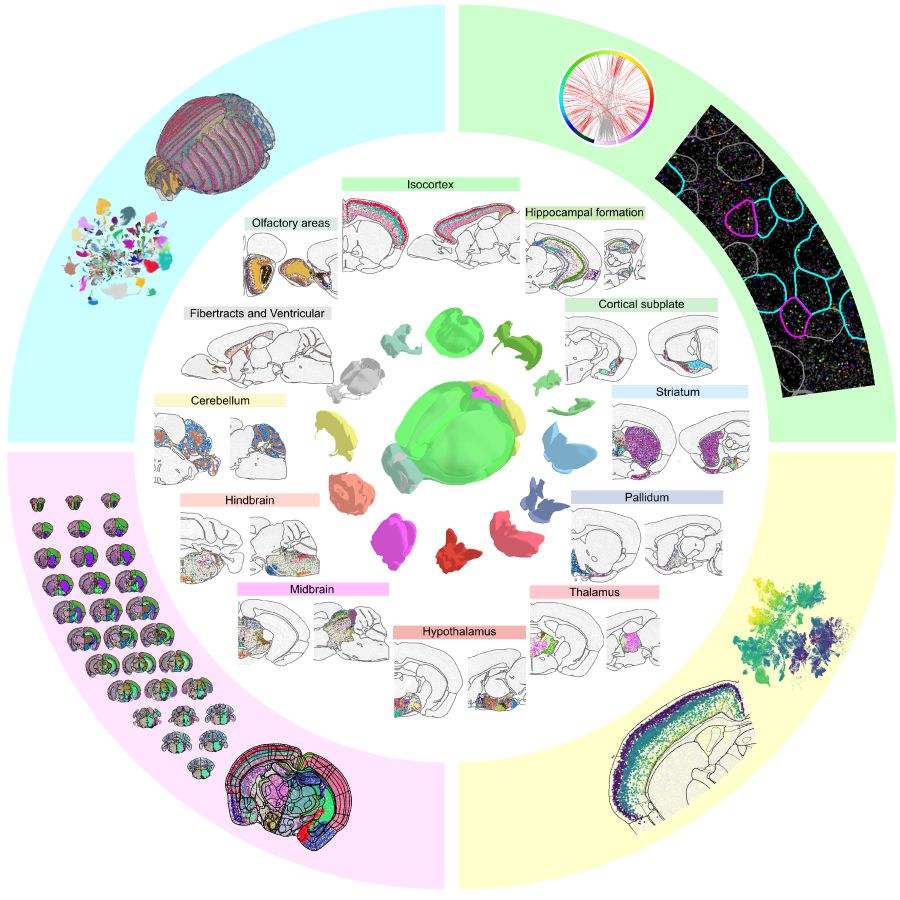
A molecularly defined and spatially resolved cell atlas of the whole mouse brain generated by MERFISH imaging of around 1,100 genes in roughly 10 million cells. Credit: The Zhuang Laboratory, Harvard University and HHMI.
A molecularly defined and spatially resolved cell atlas of the whole mouse brain generated by MERFISH imaging of around 1,100 genes in roughly 10 million cells. Credit: The Zhuang Laboratory, Harvard University and HHMI.
A molecularly defined and spatially resolved cell atlas of the whole mouse brain generated by MERFISH imaging of around 1,100 genes in roughly 10 million cells. Credit: The Zhuang Laboratory, Harvard University and HHMI.
A high-resolution transcriptomic and spatial atlas of cell types in the whole mouse brain
This portion of the atlas was created by combining an scRNA-seq dataset of about 7 million cells profiled (around 4 million of which passed quality control) and a spatial transcriptomic dataset of about 4.3 million cells using MERFISH. The atlas is hierarchically organized into four nested levels of classification: 34 classes, 338 subclasses, 1,201 supertypes and 5,322 clusters. All neuronal and non-neuronal cell types in the atlas were annotated with detailed anatomical locations and their expression of genes for neurotransmitters, neuropeptides, transcription factors and other markers, with a total of 8,460 marker genes identified. The study shows that transcription factors are major determinants of cell-type classification in the adult mouse brain and identifies a combinatorial transcription factor code that defines cell types across all brain regions.
Molecularly defined and spatially resolved cell atlas of the whole mouse brain
Spatially resolved transcriptomic profiling of more than 1,100 genes in about 10 million cells using MERFISH reveals the spatial organization of over 5,000 transcriptionally distinct clusters, belonging to 338 subclasses, across the entire mouse brain. Registration of the MERFISH-derived cell atlas to the Allen Mouse Brain Common Coordinate Framework allows systematic quantification of cell-type composition and organization in every brain region and anatomical structure. The comprehensive spatial distributions of transcriptomic cell types enable the delineation of more than 100 molecularly defined brain regions and the identification of spatial gradients in many brain regions. Integration of the MERFISH and scRNA-seq data further allows the imputation of gene-expression profiles at the whole transcriptomic scale (more than 20,000 genes) for every MERFISH-imaged cell across the entire brain. The high-resolution spatial map of cells, with a transcriptome-wide expression profile associated with each cell, allows inference of cell-type-specific interactions between hundreds of cell-type pairs, as well as prediction of the molecular (ligand–receptor) basis and functional implications of these cell–cell interactions.
The molecular cytoarchitecture of the adult mouse brain
Integration of around 6 million snRNA-seq profiles with a brain-wide Slide-seq dataset that quantifies genome-wide expression at 4.4 million 10-μm pixels enabled the systematic spatial localization of cell types to individual brain areas. The primary finding was the astonishing cell type diversity in more evolutionarily ancient brain areas, specifically in the midbrain, hindbrain and hypothalamus. Indeed, more cell types were identified within the midbrain and hypothalamus than across the entire telencephalon. In examining the distribution of related cell types across structures, the researchers found that projection neurons — which send long-range connections elsewhere in the brain — are more unique to a region than the resident interneurons. To facilitate more research on the functions of relatively understudied cell types, researchers defined minimal gene sets needed to uniquely determine them, enabling the construction of new genetic tools for specific access.
Spatial atlas of the mouse central nervous system at molecular resolution
A spatial atlas of the mouse central nervous system with molecular resolution was generated using the in situ spatial transcriptomics method STARmap PLUS. The atlas comprises 1.09 million high-quality single cells profiled with their expression of 1,022 genes and recombinant adeno-associated viral transduction at a resolution of 194 × 194 × 345 nm3. Integration of these data with scRNA-seq datasets allowed the imputation of around 12,000 genes in spatially mapped single cells, and clustering of single-cell gene expression resulted in spatial maps of 230 molecular cell types. The authors defined 106 molecular tissue regions by clustering spatial niche gene expression constructed from spatially resolved single cells and refining tissue architectures in previously established anatomical definitions, such as the differences in molecular tissue region composition between the anatomical anterior and posterior retrosplenial cortex, dorsal–ventral segregation of dentate gyrus granular layers, and spatial expression gradients in the granule layer among cerebellar lobules.
Dissecting the epigenetic landscape and gene regulatory elements
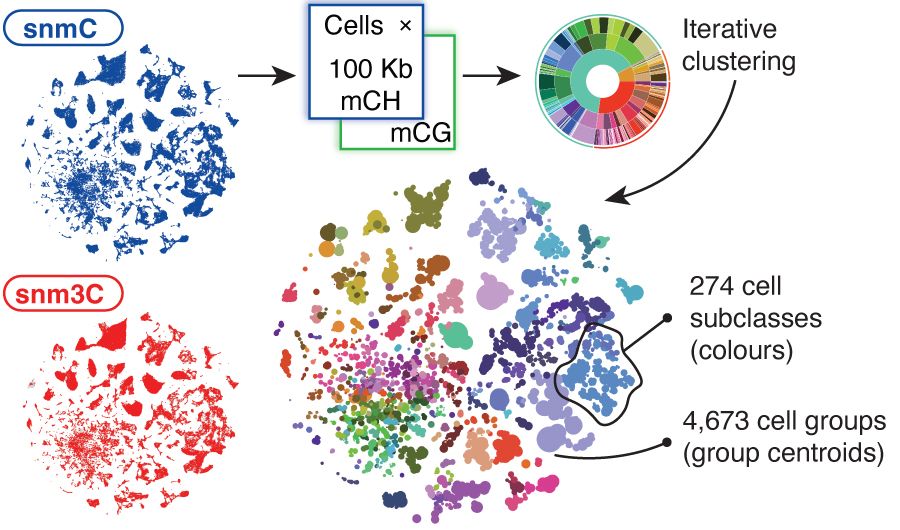
Cell and genome-based atlases across the whole mouse brain and the integration of molecular features such as DNA methylation, gene expression and chromatin accessibility. Credit: Hanqing Liu, Jingtian Zhou and Joseph Ecker.
Single-cell DNA methylome and 3D multi-omic atlas of the adult mouse brain
Single-nucleus methylome and multi-omic sequencing technologies are used to generate 301,626 methylomes and 176,003 chromatin conformation–methylome joint profiles from 117 dissected regions throughout the adult mouse brain. Using iterative clustering and integrating with companion whole-brain transcriptome and chromatin accessibility datasets, researchers constructed a methylation-based cell taxonomy with 4,673 cell groups and 274 cross-modality-annotated subclasses. The study identified 2.6 million differentially methylated regions, which represent potential gene regulation elements, across the genome. Brain-wide cell-type comparisons made it possible to build regulatory networks that incorporate transcription factors, regulatory elements and their potential downstream gene targets. Finally, intragenic DNA methylation and chromatin conformation patterns predicted alternative gene isoform expression that was observed in a whole-brain SMART-seq dataset.
Single-cell analysis of chromatin accessibility in adult mouse brain
A comprehensive atlas of candidate cis-regulatory DNA elements (cCREs) in the adult mouse brain was generated through examination of chromatin accessibility in 2.3 million individual brain cells from 117 anatomical dissections. The atlas includes approximately 1 million cCREs and their chromatin accessibility across 1,482 distinct brain cell populations, adding more than 446,000 new cCREs to the most recent annotation in the mouse genome. The authors infer the gene regulatory networks of more than 260 subclasses of mouse brain cells and develop deep learning models to predict the activities of gene regulatory elements in different brain cell types from the DNA sequence alone.
Brain-wide correspondence of neuronal epigenomics and distant projections
Epi-retro-seq links single-cell epigenomes and cell types to long-distance projections for 33,034 neurons dissected from 32 different regions and projecting to 24 different targets (225 source–target combinations) across the whole mouse brain. The dataset enables the quantification of genetic differences between neurons that project to different target brain regions, annotation of molecular cell types with their projection targets, and construction of gene regulatory networks in projection-enriched cell types.
Conserved and divergent gene regulatory programs of the mammalian neocortex
Gene regulatory programs in the primary motor cortex of human, macaque, marmoset and mouse were investigated with single-cell multiomics assays, generating gene expression, chromatin accessibility, DNA methylome and chromosomal conformation profiles for more than 200,000 cells. The data revealed that conserved and divergent gene regulatory features are reflected in the evolution of the 3D genome. Divergence of transcription factor expression corresponds to species-specific epigenome landscapes. Remarkably, transposable elements contribute to nearly 80% of human-specific cCREs in cortical cells. Sequence-based predictors of cCREs developed using machine learning approaches demonstrate that the genomic regulatory syntax is highly preserved from rodents to primates. Epigenetic conservation combined with sequence similarity helps to identify functional cis-regulatory elements and enhances our ability to interpret genetic variants that contribute to neurological disease and traits.

Cell and genome-based atlases across the whole mouse brain and the integration of molecular features such as DNA methylation, gene expression and chromatin accessibility. Credit: Hanqing Liu, Jingtian Zhou and Joseph Ecker.
Cell and genome-based atlases across the whole mouse brain and the integration of molecular features such as DNA methylation, gene expression and chromatin accessibility. Credit: Hanqing Liu, Jingtian Zhou and Joseph Ecker.
Additional insights offered by the study of spinal projections and the retina


Comparative transcriptomic analysis across 17 vertebrate species reveals deep evolutionary conservation of the retinal cell types that dominate visual processing in primates, pinpointing their counterparts in other species. Credit: Joshua Hahn, Aboozar Monavarfeshani, Joshua R. Sanes and Karthik Shekhar.
Comparative transcriptomic analysis across 17 vertebrate species reveals deep evolutionary conservation of the retinal cell types that dominate visual processing in primates, pinpointing their counterparts in other species. Credit: Joshua Hahn, Aboozar Monavarfeshani, Joshua R. Sanes and Karthik Shekhar.
A transcriptomic taxonomy of mouse brain-wide spinal projecting neurons
Virus-mediated retrograde labelling and snRNA-seq are leveraged to generate a unified anatomical and transcriptomic atlas of spinal projecting neurons (SPNs), the neurons that connect the brain with downstream spinal circuits by direct axonal connections. The SPN taxonomy consists of 3 divisions, 13 subclasses, and 76 types across the cortex, hypothalamus, midbrain, dorsal pontine tegmentum, pontomedullary reticular formation and deep cerebellar nuclei. The 76 SPN types are mapped to their anatomical locations via integration with the whole-brain MERFISH dataset generated at the Allen Institute. This taxonomy shows that the spinal projecting system comprises three distinct yet complementary components (or ‘divisions’) with unique transcriptomic and anatomical properties. The first division is composed of corticospinal, rubrospinal and cerebellospinal neurons, which are exclusively excitatory and relatively transcriptionally homogeneous. The second division corresponds to highly heterogeneous excitatory and inhibitory reticulospinal neurons of the reticular formation. The third division corresponds to modulatory SPNs, which express slow-acting neurotransmitters and/or neuropeptides and are distributed throughout the hypothalamus, midbrain and brainstem.
Evolution of neuronal cell classes and types in the vertebrate retina
Brain structure varies greatly among vertebrates, but the basic plan of the retina is nearly invariant. This shared plan allowed a comparison of cell types among 17 vertebrate species, revealing numerous orthologous cell types that are shared across phylogeny. Numerous transcription factors that have been implicated in retinal cell-type specification in mice are highly conserved, suggesting that these developmental mechanisms are evolutionarily ancient. Another discovery illuminated the origins of ‘midget’ retinal ganglion cell (RGC) types, which comprise 90% of human RGCs. These were thought to be a primate innovation, which had limited the ability to analyse them in, for example, mouse models of retinal disease. However, this evolutionary comparison revealed mouse orthologues called α-RGCs. Remarkably, these cells are large and comprise only 2% of mouse RGCs; tracing their evolution suggests that they might became smaller and more numerous in parallel to the enlargement of the visual cortex, which is the predominant centre of visual processing in humans. This correspondence suggests that the retina and cortex evolved in parallel to provide primates with high-acuity vision.
How will this resource be useful?
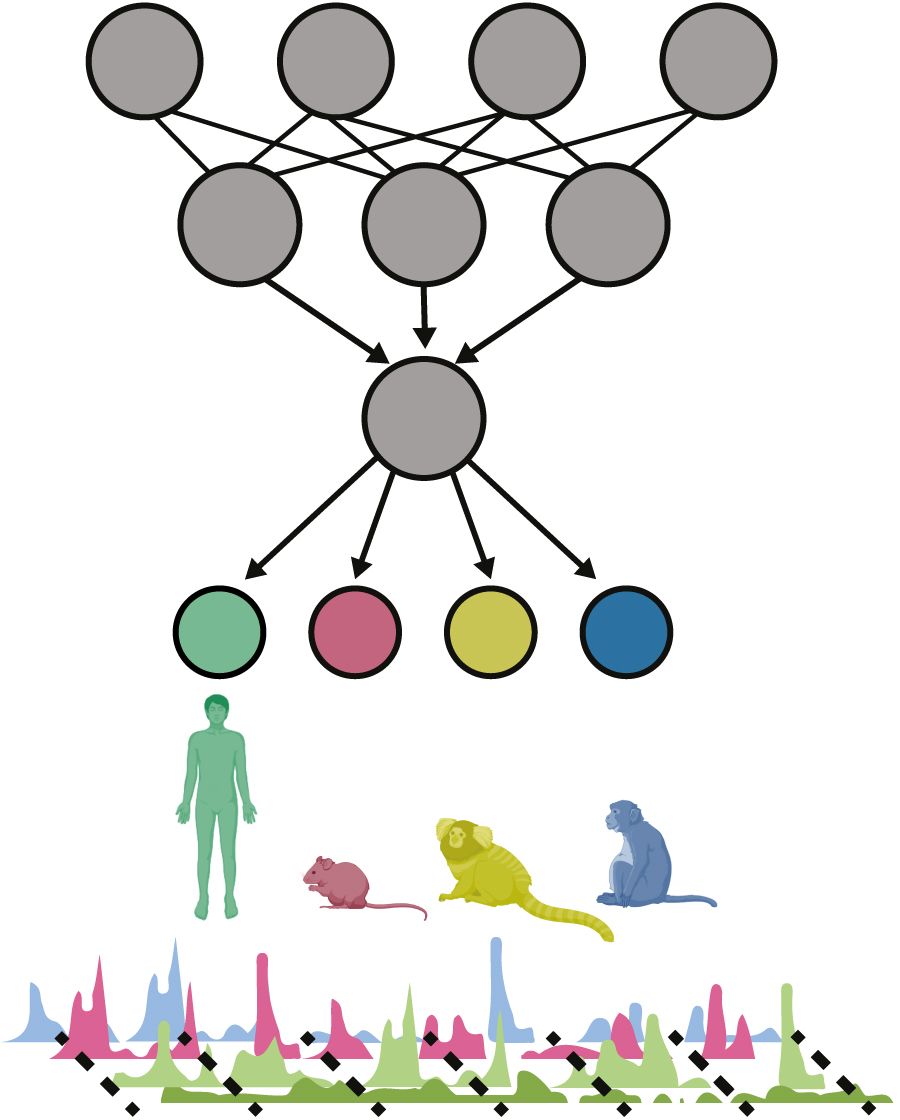
Single-cell profiling of four molecular modalities that span the motor cortex of four species enables comparative analysis of gene regulatory programs and powers sequence-based epigenome deep learning predictors. Credit: Bing Ren Laboratory, University of California, San Diego, School of Medicine.
The field has not yet settled on a consensus definition of cell types, given the extraordinary diversity of cellular properties that still need to be systematically characterized. Yet the high degree of correspondence among the transcriptomic, epigenomic and spatial properties of the individual cell types described in this package of studies provides a strong framework for defining a cell-type organization in the brain. As other cellular properties are explored and definitively characterized, they may be layered onto this framework, increasing confidence in our evolving definitions of ‘cell types’. However, in most cases we still know little about how transcriptomic properties map to physiological, morphological, connectivity and functional properties. Further investigations that link these distinct properties, enabled by the initial molecular and spatial framework of cell types described in these studies, will lead to a more unified definition of cell types.
The whole-brain transcriptomic, epigenomic, and spatial cell type atlases establish a foundation for organizing and integrating the vast existing knowledge and for driving deeper investigations of the brain’s cellular and circuit function, development and evolution, akin to the reference genomes for studying gene function and genomic evolution. These atlases of healthy adult brains also provide a baseline for investigating dynamic changes in molecular properties and cellular functions in different physiological (such as developmental) and diseased conditions. The molecular and spatial properties of cell types will facilitate the creation of cell-type-targeting tools for labelling and manipulating specific cell types to probe and control their functions in vivo. These efforts will lead to mechanistic insights into the genesis and function of cell types and circuits in the mammalian brain and their dysfunction in diseases.
The mouse brain cell atlas also provides a starting point for generating similarly comprehensive and detailed cell-type atlases for other species and across developmental times. As the human brain contains around 200 billion cells compared to the mouse brain’s roughly 100–150 million, substantial resources will be needed to keep building upon this foundation. But once we have the data, comparative studies that show the conservation and divergence of cell types between humans and model organisms will have profound implications for studying human brain function and diseases.

Single-cell profiling of four molecular modalities that span the motor cortex of four species enables comparative analysis of gene regulatory programs and powers sequence-based epigenome deep learning predictors. Credit: Bing Ren Laboratory, University of California, San Diego, School of Medicine.
Single-cell profiling of four molecular modalities that span the motor cortex of four species enables comparative analysis of gene regulatory programs and powers sequence-based epigenome deep learning predictors. Credit: Bing Ren Laboratory, University of California, San Diego, School of Medicine.
Online resources for the cell type atlas


In situ spatial transcriptomic analysis of more than 1 million cells creates a 200-nm-resolution spatial molecular atlas of the adult mouse central nervous system, identifies previously unknown tissue architectures and reports viral tropisms. Credit: Hailing Shi, Yichun He, Jia Liu and Xiao Wang.
In situ spatial transcriptomic analysis of more than 1 million cells creates a 200-nm-resolution spatial molecular atlas of the adult mouse central nervous system, identifies previously unknown tissue architectures and reports viral tropisms. Credit: Hailing Shi, Yichun He, Jia Liu and Xiao Wang.
Multiple online visualization platforms have been developed to display the various datasets:
- Allen Brain Cell (ABC) Atlas – Mouse Whole Brain
- CZ CELLxGENE Discover
- Macosko lab Brain Cell Data Viewer
- Ecker lab online platform: Whole Mouse Brain Cell & Genome Atlas
- Ren lab webportal for chromatin accessibility
- Epi-Retro-Seq web application
- Wang lab online platform
- WashU comparative epigenome browser of the mammalian motor cortex
Browse the collection


View the BICCN collection page which includes all research articles, an editorial, feature article and News & Views.