
Abstract
Scope of the present work is to infer the migratory ability of leukocytes by stochastic processes in order to distinguish the spontaneous organization of immune cells against an insult (namely cancer). For this purpose, spleen cells from immunodeficient mice, selectively lacking the transcription factor IRF-8 (IRF-8 knockout; IRF-8 KO), or from immunocompetent animals (wild-type; WT), were allowed to interact, alternatively, with murine B16.F10 melanoma cells in an ad hoc microfluidic environment developed on a LabOnChip technology. In this setting, only WT spleen cells were able to establish physical interactions with melanoma cells. Conversely, IRF-8 KO immune cells exhibited poor dynamical reactivity towards the neoplastic cells. In the present study, we collected data on the motility of these two types of spleen cells and built a complete set of observables that recapitulate the biological complexity of the system in these experiments. With remarkable accuracy, we concluded that the IRF-8 KO cells performed pure uncorrelated random walks, while WT splenocytes were able to make singular drifted random walks that collapsed on a straight ballistic motion for the system as a whole, hence giving rise to a highly coordinate response. These results may provide a useful system to quantitatively analyse the real time cell-cell interactions and to foresee the behavior of immune cells with tumor cells at the tissue level.
Introduction
The development of theoretical frames able to describe complex biological systems has been a leitmotif in the work of many physicists and mathematicians and it is deeply linked with the possibility to obtain measurements of the parameters and variables describing the systems under observation.
The immune system is a striking example of an integrated information system, engaged in coordinated host-protective activities. Quoting Kim and coworkers, the immune system operates according to a diverse, interconnected network of interactions and the complexity of the network makes it difficult to understand experimentally. On one hand, in vitro experiments that examine a few or several cell types at a time often provide useful information about isolated immune interactions. However, these experiments also separate immune cells from the natural context of a larger biological network, potentially leading to non-physiological behavior. On the other hand, in vivo experiments observe phenomena in a physiological context, but are usually incapable of resolving the contributions of individual regulatory components1.
In this regard, the reconstitution of cellular microenvironments exploiting microfluidic chips and cell co-cultures has emerged as valid and innovative approach to address limitations of in vitro static end-point measurements and in vivo experiments. Highly controllable and engineered microenvironments have been realized to mimic in vivo-like situations at different scales while maintaining compatibility with advanced modern imaging techniques and molecular biology methods2,3. This has provided a new window to finely investigate on the real-time imaging of processes involving motility and cellular interactions in highly relevant context (normal or disease).
From the theoretical counterpart, models coming from mathematics or theoretical physics, such as maximum entropy principle4, disordered statistical mechanics5,6, complex optimization7, graph theory8, stochastic processes9 and dynamical systems10 are being adapted to biological systems, allowing a more complete picture of cellular behavior from advanced imaging studies. In parallel, the development of methods aimed at considering the system as a whole, hence with all its constituents mutually interacting, have become a major topic, involved as a necessary step beyond reductionism limitations6,11,12,13. For example, cancer progression involves multiple events and is the result of the interactions with cells of the immune system within the tumor micro-environment14,15,16,17,18,19,20,21.
Previous studies on the tumor microenvironment, performed mainly by using animal models22,23, have suggested that immune cells, infiltrating the growing tumor mass, play a crucial role in the control of cancer expansion and of the spread of metastasis. Indeed, immune cells enter the cancer site by means of angiogenesis-induced blood vessels and by the generation of a large network of chemokines and cytokines24. After their entry, immune cells actively interact with cancer cells and other components of the extracellular matrix, thus dictating the fate of the cancer tissue, namely expansion or eradication. In this complex scenario, the migratory capability of both immune cells and cancer cells plays an important role for tumor eradication or expansion, both inside the tumor microenvironment and at systemic level for metastatic spread. In addition, chemokines and their receptors finely orchestrate the destination of cancer cells and immune cells, thus meaning that the generation of multiple chemotactic gradients is pivotal for the initiation and sustainment of the interactions between cancer and immune cells. Despite the growing knowledge in this field, the mechanisms driving the mutual crosstalk between cancer and immune cells are poorly defined due to the difficulty in visualizing the physical interactions at the tumor site.
In this context, we recently exploited microfluidic devices to investigate in real time on the mutual interactions between cancer and immune cells25. We co-cultured mouse melanoma cells with competent or deficient immune cells and compared several mutual migratory parameters: this Cell-On-Chip approach has the great advantage of creating realistic models of in vivo microenvironments onto substrate perfectly compatible to modern microscopy tools and molecular biology methods and it may constitute the lacking bridge between biology and theoretical models.
Results
Making up the experiment for data-drive
The data analyzed in this paper were gathered from an experiment whose biologic characteristics have been described in detail elsewhere25. The results of such experiment are summarized hereafter for reader convenience. The basic idea was to reproduce on chip the interactions between cells of the immune system with the tumor, mimicking as much as possible those occurring in vivo. To do so, we realized a microfluidic chip, shown in Figs. 1, 2, which was basically divided in two different zones, one for the culture of immune cells (marked in red) and one for the tumor (green chamber), which consisted of the murine metastatic melanoma cell line B16.F10.

Micro-fluidic co-culture immune-cancer system: design and fabrication.

Experimental design and methodologies: melanoma vs WT/KO immune cell interactions.
The two zones were connected by an array of microchannels (section 10 × 10 mm2) which allowed the migration of cells. We used for the immune system a mouse spleen homogenate, which contains the whole pool of mature immune cell populations, ranging from T and B lymphocytes to phagocytes. The experiments were carried out taking advantage of two different sets of splenocytes, the first was from a wild type (WT) mouse, namely a healthy immune system, the second was from a mouse deficient for the transcription factor IRF-8, essential for the induction of competent immune responses26,27,30,31,32,33.
In this experimental setting, both melanoma and immune cells could mutually migrate through the whole microfluidic system. The two systems were monitored by means of fluorescence microscopy up to 144 h and time-lapse recordings of the first 48 h of culture, chosen as the most representative ones (as we observed the major cell motility in that temporal gap). For the B16-WT system we observed a clear migration of the immune cells towards the melanoma and the formation of immune cell clusters around the B16 cells (see Fig. 3). In the case of the B16-KO system, on the contrary, nor the KO cells show any response to the melanoma neither their trajectories were focused toward the insult (see Fig. 4).

Differential migratory behavior of KO and WT cells toward melanoma cells.
B16 melanoma cells (green-labeled) and spleen cells (red-labeled) from either WT or KO mice at 24 h (A) and 48 h (B) after loading onto the microfluidic device. (C) Detail of splenocytes interacting with B16 cells.

Upper panel shows examples of real trajectories performed by WT cells, while lower panel depicts the same for KO cells.
WT, but not KO, splenocytes migrate from top-right through bottom-left following a chemokine gradient.
Furthermore, the findings illustrated in Fig. 5 suggest that WT splenocytes seem to be endowed with a certain ability in limiting the B16 liveliness in comparison to KO splenocytes cells loaded with melanoma cells. Indeed, the perturbation factor is significantly increased for B16 cells when loaded with KO rather than WT immune cells. The perturbation factor, measuring the B16 cell area fluctuation at each timepoint, may presumably be correlated to the vitality and thus aggressiveness of melanoma cells. This hypothesis is in agreement with previous findings showing how shape factor may be helpful for investigations in cell viability28,29.

Prospect of the perturbation of B16 cells in microfluidic devices loaded with WT or IRF8 KO immune cells.
(A) Perturbation factor has been calculated for three representative B16 cells (Mel1, Mel2, Mel3) taken in each device by depicting the area fraction of that cell in each timepoint respect to the preceding timepoint. This allowed to obtain the percentage area variation for each given timepoint for the 24–42 h time interval. The examined B16 cells were located in the melanoma compartment of the microfluidic devices. (B) Multiple comparison between B16 cells showed in panel A by Mann-Whitney U test. Each of three B16 cells from device loaded with WT immune cells (WT-Mel1, WT-Mel2, WT-Mel3) was combined with each of three B16 cells from device loaded with IRF8 KO immune cells (KO-Mel1, KO-Mel2, KO-Mel3).
The experimental data resulting from microscopy analisys give information about the cell dynamics, so the starting data set of our mathematical analysis consists in the measurements of cell positions during time. We followed the trajectory of N distinct migrating splenocytes and for each of them we collected time series of their position. Data were acquired at a constant rate τ = 4 min (due to the experimental setting) and measured with precision ~0.1 μm (corresponding to 1 pixel). A total of T = 350 measurements were performed, in such a way that, for each splenocyte, we have a walk labelled as j, with j ∈ (1, …, N) and characterized by the set of consecutive positions ( ,
,  ), with i ∈ (1, …, T). As a result, being Δxi = xi+ 1 − xi and Δyi = yi+ 1 − yi, we can also derive the series of steps lengt hs Δxi(i = 1,…,T) and Δyi(i = 1,…,T) taken by cells along the time intervals of length τ.
A vocabulary for a quantitative treatment
In what follows, we introduce the parameters (observables) that we candidate to suitably describe splenocyte behavior into a quantitative frame. We give here a simplified definition of them, in order to allow the full understanding of the analysis described in the following. Rigorous mathematical definitions and descriptions can be found in the appendix (Suppl.Mat.).
The splenocytes under investigation perform paths which can, in principle, exhibit some degree of bias (e.g. due to chemical gradients) and some degree of stochasticity (randomness, e.g. due to noise). Hence, we propose to model such paths by means of random walks characterized by (synchronized) discrete time steps and moving on a continuous two-dimensional space (xy). This kind of random walks can be described in terms of a probability distribution, giving the probability that the walker has covered a distance r in a time t.
We will call ψ(r − r′, t) the probability that at time t a step from r′ to r is performed (see the appendix for details). This probability qualitatively controls the resulting random walk. Indeed, according to its mathematical expression, it possibly gives rise to deterministic walks (corresponding to a ballistic motion), to correlated walks (corresponding to a motion with a preferred direction), to completely stochastic walks (corresponding to an isotropic motion where steps have fixed length).
In Euclidean structures, like the two-dimensional substrate considered here, we can decompose r into its normal coordinates, i.e. r = (x, y), and, analogously r − r′ = (x − x′, y − y′) ≡ (Δx, Δy). Moreover, assuming that Δx and Δy are independent, ψ(Δx, Δy) can be factorized as ψ(Δx, Δy) = ψx(Δx)ψy(Δy).
The knowledge of the specific distribution ψ(Δx, Δy) possibly allows to get important information about the resulting random walk. For instance, one can show that, when diffusion is isotropic, i.e. it is equal in the x and y directions, any distribution ψ(Δx, Δy) fulfilling the central limit theorem asymptotically leads to the well-known diffusive limit characterized by the normal distribution34.
Hence, asymptotically, whenever noise is prevailing, we expect to observe a Brownian motion, i.e.  , while, whenever there is a real presence of a drift (signal), we expect a ballistic motion, i.e. r ∝ t.
Hereafter, we summarize the observables that we are going to analyze, stressing on the kind of information which can be conveyed via their investigation.
Observable one: Step length
Step lengths are measured in micrometers to quantify the distance covered by the cells during the time-interval among two different (adiacent) frames, i.e. τ = 4 min. The distributions of step lengths immediately provide fundamental information:
-
Direction dependency. By means of specific correlation coefficient (Pearson's coefficient) ρΔxΔy we can highlight possible correlations between the time series {Δxi} and {Δyi} for a given walk. This analysis also allows to check whether propagations along the two dimensions are independent, namely if ψ(Δx, Δy) can be (at least approximately) factorized into ψx(Δx)ψy(Δy).
-
Distribution of step lengths. If the distributions display a finite mean μ and a finite variance σ2, one can apply the central limit theorem (CLT) to get that
 (where n is the number of considered steps) has average value converging to nμ with standard deviation scaling like
  , (and analogously along the y direction). In this case the walk displays a characteristic length scale given by μ.
 (where n is the number of considered steps) has average value converging to nμ with standard deviation scaling like
  , (and analogously along the y direction). In this case the walk displays a characteristic length scale given by μ.
 If a distribution respects CLT, roughly speaking, no Levy flights for its variable are expected: this means that if, for instance, ψx(Δx) is the probability distribution of the jumps Δx performed by the cells among two adjacent frames and it respects CLT, then the probability to observe a huge jump (whose length is by far larger than the characteristic average amplitude of jumps μ) is for practical purposes negligible.
In turn, when CLT convergence is forbidden (as for Scale Free distributions) or strongly slowed (as in log-normal ones), a much more broad ensemble of step lengths is expected: as a result, we can infer the degree of homogeneity of a process (i.e. the way cells move toward a direction) directly by checking the CLT convergence of the probability distribution of its related variable(s). This is important because we will show that as far as KO spenocytes are concerned, their step length distributions strongly respect CLT (hence their movements are highly homogeneous, i.e. share a characteristic step length), while when WT are analyzed, their step length distributions are found to converge to log-normal shapes thus suggesting the presence of broaden steps which, in turn, possibly reveals a hidden heterogeneity at the cellular level.
However this observable alone is not able to distinguish among purely diffusive motion and ballistic one, thus further observables are required to properly frame the system's behavior.
Observable Two: Time Correlations
To this task, another key observable is the distribution of time correlations: the latter indeed has the capability to detect the presence of a bias (and to discover the presence of ballistic motion as a consequence of the bias itself): the underlying idea is that if a drift is present (e.g. driven by a chemical gradient), then step by step the jumps of the cells will no longer be uncorrelated as, on average, cells will point to the source of the gradient. Thus, analyzing the correlation among two (temporally-adjacent) jumps would reveal the presence of the drift itself. In absence of any drift, clearly, no angular correlation is expected among the direction of motions of cells collected between two closer frames.
It may be worth stressing that, beyond the scope of the present analysis, its knowledge may however contribute to the experimental detection of chemical gradients and of chemotactic phenomena.
We distinguish among
-
Angular correlation. Due to the presence of a forcing field (i.e. a chemical gradient), a diffusive particle may exhibit a preferred direction, which can be measured in terms of the angle θ between two consequent steps; in particular, to highlight the existence of a short-term memory we consider the temporal angular correlations C(τ) defined as

where the average
 is performed over t and the average 〈·〉 is performed over the set of random walks. Hence, C ~ 0 implies isotropy, which, in turn, implies that migrating white cells are not pointing to any specific target; conversely, C ≠ 0 is a necessary requisite in order to keep a coordinate motion toward the target (melanoma cells in the present case).
 -
Acceleration phenomena. In order to figure out the possible existence of slowing down and/or speeding up phenomena one can consider the step length
 of a single random walk at each time step k and calculate
which is the average of the steps taken up to the n-th time step by the single cell. A (at least approximately) constant behavior of the average
 ensures that, independently of the instant of time and of the place where the cell is currently located, the length of the step taken tends to remain the same. On the contrary, in the case of an acceleration/deceleration, an increasing/decreasing behavior of
  is expected.

 is performed over t and the average 〈·〉 is performed over the set of random walks. Hence, C ~ 0 implies isotropy, which, in turn, implies that migrating white cells are not pointing to any specific target; conversely, C ≠ 0 is a necessary requisite in order to keep a coordinate motion toward the target (melanoma cells in the present case).
  of a single random walk at each time step k and calculate
 ensures that, independently of the instant of time and of the place where the cell is currently located, the length of the step taken tends to remain the same. On the contrary, in the case of an acceleration/deceleration, an increasing/decreasing behavior of
  is expected.
 The quantities described so far focus on “microscopic” features of a walk as they imply a fine zoom on the walk itself. From such a description one is usually able to derive the “macroscopic” behavior, typically measured in terms of the mean displacement 〈r(t)〉 as a function of time, whose following observables are due to.
Observable Three: Mean displacement
In a nutshell we now deal with the stochastic version of the equation of motion in classical dynamics (that is the trajectory). While, at the microscopic level, temporal determinism coded by the Newton's law is lost and each single cell has its own unpredictability regarding its dynamics (thus focusing on single particle trajectory becomes meaningless), the ensemble average of the whole cells, however, still obeys a deterministic evolution such that inferring the parameter ruling such an averaged dynamics may allow quantitative prediction for future movements.
To this task one can consider both the displacements x(t) and y(t) along the x and y axes and the overall (absolute) displacement

Notice that x(t) and y(t) are calculated with respect to the initial point in order to get the effective displacement (the rigorous notation for r(t) should be  in order to account for the effective displacement with respect to the original position; however, the notation has been lightened throughout the paper). All these quantities can be computed for every cell at each time and, then, they are averaged over the ensemble of cells, obtaining 〈x(t)〉, 〈y(t)〉 and 〈r(t)〉. In fact, the latter quantities represent the mean displacements of the system as a whole.
Now, the scaling of the mean squared displacement 〈r2(t)〉 with respect to t is often used to qualitatively define the kind of diffusion. For instance 〈r2(t)〉 ~ t2 (i.e.  ) is typical of simple diffusion, 〈r2(t)〉 ~ t2 (i.e. 〈r(t)〉 ~ t) is typical of drifted motion, while a power law 〈r2(t)〉 ~ tα, with 0 < α < 1 or 1 < α < 2, is referred to as anomalous diffusion emerging, for instance, in the presence of crowded environment and/or fractal substrates34.
Observable Four: Tortuosity
When dealing with the movement of a biological particle one is often interested in the tortuosity of its path, namely in how twisted the path is in a given space or time36. Clearly, this is related to the mean displacement: highly tortuous paths will spread out in space slowly, while straight paths will spread out in space quickly. Hence, it can be useful to measure and study the tortuosity of observed paths in order to understand the processes involved, estimate the area spanned by a cell and predict spatial dispersal.
It is worth noticing that this observable quantifies the degree of straightness shared by the motion under analysis and, coupled with the angular correlations (see Time Correlations), it may help quantifying the presence (or lacking) of chemical gradients.
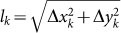
Tortuosity can be quantified by comparing the overall net displacement of a path with the total path length. For example, if a random walk starts at location (0, 0) and, after n steps with lengths lj (j = 1, …, n), ends at (x(n), y(n)), then we can measure the so-called straightness index S as35

which ranges in 0 and 1, where 1 corresponds to movement in a straight line (the shortest distance between two points in the two dimensional Euclidean space the LabOnChip has built on) and 0 corresponds to a returning (thus tortuous) path.
Observable Five: Ergodicity
In the context of stochastic processes, we define ergodic a system where time and ensemble averages converge37, namely the time average of a sequence of events is equivalent to the average over all the possible states of the system at a fixed time. So in an ergodic system the evolution of a single element is representative of the whole system as an average on all possible states of it. Simple Brownian motion owns this property. Hence, the possible non ergodicity of the system is a measure of how large is the deviation of the process examined from a normal diffusion. A convenient way to check ergodicity is the comparison between the mean squared displacement (MSD) of diffusing particles and the time-averaged MSD defined as:

where T is the total measurement time and τ is the lag time which separates the trajectory points.
In the case of Brownian motion in two dimensions, we have that, over long measurement times,

This is essentially the same as the MSD averaged over a large ensemble of particles,

This equivalence quantitatively confirms that in the Brownian motion the ergodicity is preserved. In particular, in this process, a measurement of  and, therefore, D in the time interval (0, t) will be identical to a measurement in the interval (t, 2t) for large t. Therefore, if a system shows the ergodicity property, it surely respects the time-translational invariance, which, instead, is not applicable in many kinds of anomalous diffusion, such as subdiffusion processes38.
From a practical perspective, the introduction of the concept of ergodic motion in biological dynamics may significantly contribute in the experiment's management because, still roughly speaking, ergodicity allows to exchange temporal averages with ensemble averages (i.e. average over the cells). If we image an experiment whose temporal length should be, for example, 10 days, but we are allowed to use the laboratory for 5 days only, then, if the motion under study is ergodic (to be verified separately), it is possible to use a (twice) larger system (keeping fixed the cell's density obviously) for 5 days only in order to collect the same data available in the 10-days experiment with the original (smaller) system.
Analysis of differential immune cell dynamics
Knock-out splenocytes: a simple random walk
Once defined the observables of interest, we analysed the experimental data to verify if it was possible to identify a clear trend in their distribution that would describe their dynamic behavior. In the following we will call “Spl compartment” (the central one in Fig. 2) the channel where the splenocytes were at the beginning of the experiment and “B16 compartment” the channel in which melanoma cell were cultivated. We started analysing the KO splenocytes behavior. During the experiment, they were poorly reactive to melanoma cells, almost no cell was able to get into the micro-channels. Thus, the motion of these cells was studied only in the Spl compartment.
The available data were filtered with the compromise of obtaining the positions of splenocytes monitored from the same instant of time t0 (and not to include splenocytes initially too close to the channel wall, in order to avoid collisions with it, which could distort results) and, at the same time, of getting a reasonable statistics with the minimum number of analyzed cells. From this selection procedure we outlined N = 30 splenocytes for our analysis. It is remarkable that with such a small number of elements the statistics were already very significant (as shown below). Implication on collective capabilities of leukocytes will be discussed at the end of the paper.
As anticipated, our analysis begins with the determination of microscopic quantities.
First, we notice that there is no manifest spatial correlation between Δx and Δy along a single walk. Also, the histogram of the Pearson correlation coefficient ρΔxΔy for each walk peaks at zero (not shown). As for the distribution of step lengths ψx(Δx) and ψy(Δy), we find that, at each time step, splenocytes perform a jump whose width is stochastic and exponentially distributed, as shown in Fig. 6. In particular, for both directions (displacements along x and along y) and for both branches (negative and positive displacements) the best fit is given by

best fit coefficients, summarized in Tab. I, are consistent with the experimental average values and highlight overall, within the error, a good symmetry. This suggests that KO cells are not pointing to any target.

Logarithm of the probability distribution for the step length along the x direction (upper panel) and along the y direction (lower panel).
Experimental data (symbols) with standard errors are fitted by the exponential distribution (solid line) given by Eq. 8. All fits display R2 ≈ 0.99. The best fit coefficients are reported in Tab. I, where a comparison between average values from experiments and theoretical description is also provided.
Moreover, the exponential distribution clearly satisfies the central limit theorem and this rules out the existence of Lévy flights among KO splenocytes. In other words, these splenocytes proceed smoothly and with rather regular steps.
Let us now consider the turning angle θ between two consecutive steps. The distribution of θ over the whole set of walks and the related time correlation CKO(τ), (see Eq. 1) are shown in Fig. 7. The turn amplitude has zero mean, implying again that every choice of direction is not correlated with the previous one and the motion is isotropic.

Inset: polar histogram of the turning angle.
The distribution has zero mean, hence, no angular correlation is observed. Main plot: angular correlation function CKO(τ) of the turning angle θ. This correlation function shows more statistical noise at large τ.
Moreover, CKO(τ) has zero average, confirming that there is no connection between the direction of a step with that of the following one so that one can exclude the presence of memory or collective organization in the process.
Finally, we do not find any significant temporal correlation among steps since, for each cell, the step  (see Eq. 2) converges to a constant value; as shown in Fig. 8, no acceleration is observed in the process and the instantaneous speed 〈v(t)〉 is stable. More precisely, it fluctuates around 1.5 ± 0.1 μm/min in agreement with the results of other in vitro experiments, showing that, in the absence of external gradient guiding the KO splenocytes, these move with an average speed 1 ~ 4 μm/min39.

Inset: binned data ( ) with standard errors of mean instantaneous speed and related best fit (solid line).
KO splenocytes do not slow down over the observation time of 350 frames. Thus, for practical purposes, we can consider them as being in a time-independent state. Main plot: mean step length  for each KO cell (thin curve) and mean step length averaged over all splenocytes (thick curve) at each time, which is essentially constant.
Thus, from this microscopic analysis we can confidently derive that KO splenocytes move rather uniformly and isotropically, with no manifest bias, consistently with the expected lack of collective organization.
As for the macroscopic analysis, we show the time evolution of the mean displacement 〈r(t)〉 and of the mean-square displacement 〈r2(t)〉 (see Fig. 9), which are proportional to  and to t, respectively. This is the typical behavior of pure diffusion (see Eq. 3), in agreement with the results above.

Mean displacement 〈r(t)〉 (upper panel) and mean squared displacement 〈r2(t)〉 (lower panel) for KO splenocytes.
Experimental (binned) data ( ) with standard errors are compared with best fits (solid line) whose coefficients are properly shown.
From the whole set of results described so far we can consistently derive that KO cells perform a simple random motion (at least as for their free path) and that any anomalous diffusion can be excluded in this context. This can be further corroborated by the straightness index S (see Eq. 4), which, as shown in Fig. 10, decreases rapidly over time, approaching to zero. Indeed, in a normal diffusion process, the tortuosity of the path is high, because the particles do not move in a specific direction, but tend to explore the space rather compactly. For this reason, a simple Brownian motion spreads more slowly than a random walk with bias (as described in the next sub-section).

Left panel: straightness index SKO for each KO splenocyte (thin curves) and straightness index averaged over all splenocytes (thick curve) at each time.
Right panel: binned data for  (
( ) with standard errors for KO splenocytes and best linear fit (solid line).
Finally we consider the ergodicity problem. We measure for each trajectory the time average  (see Eq. 5), which is then averaged over all trajectories to get
  .
.
More precisely,  and 〈r2(t)〉 have the same linear shape with comparable slope within the error (see Tab. II).
 and 〈r2(t)〉. From this table we can see that, within the experimental error,
  : coupled with Fig. 9 (lower panel) and Fig. 10 (right panel) this is a proof that the motion is ergodic (with all the implications that follow, see Observable Five tools) because, from those pictures we see that both
  and 〈r2(t)〉 grow linearly with time, while from this table we see that their angular coefficients (the growth's slope) do coincide too, thus the two averages return the same values
Thus,  → 4D
→ 4D and there is equivalence of time and ensemble average, which is the hallmark of ergodicity. In particular, both procedures agree on the estimate of the diffusion coefficient, which turns out to be approximately D ≈ 9 μm2/min.
In conclusion, the behavior of KO splenocytes can be characterized by a simple random walk, hence with a manifest lack of collective organization despite the presence of an insult (melanoma cells). In this respect, this result confirms the important role played by IRF-8 as a central regulator of immune response and anticancer immunosurveillance22.
Wild type splenocytes: a biased random walk
Since WT splenocytes express IRF-8, they are expected to have a competent response to the tumor. Indeed, as we will see, WT splenocytes migrate towards B16 melanoma cells, in the attempt to contain their expansion22,23,25.
Point-by-point tracking, between 24 and 48 hours from the beginning of the experiment, showed that WT splenocytes are endowed with the potential ability to cross the microchannels connecting the Spl compartment with the B16 compartment (see Fig. 2). Thereafter, the performances of WT splenocytes in the Spl compartment, i.e., before passing the microchannels (WT-PRE) and of WT splenocytes in the B16 compartment, i.e., after passing the microchannels (WT-POST), are treated separately.
First, we consider the probability distributions of step lengths ψx(Δx) and ψy(Δy). Interestingly, a qualitative difference with respect to the case of KO splenocytes emerges: along the direction pointing to melanoma cells (i.e. along negative x and positive y directions) distributions are broadened and best-fits are now provided by log-normal distributions (see Fig. 11 and Fig. 12, lower panels), namely

where the parameters μ and σ are related to the expected value  as
as  .
.

ψx(Δx) of WT-PRE splenocytes along the positive direction (upper panel, notice the semilogarithmic scale) and along the negative direction (lower panel, notice the logarithmic scale).
Analogous plots are obtained for the y direction (not shown). Experimental data of the distributions ( ) with standard errors are compared with best fits (solid line). Note that the distribution is broadened along the negative x direction (and, analogously, along the positive y direction).

ψx(Δx) of WT-POST splenocytes along the positive direction (upper panel, notice the semilogarithmic scale) and along the negative direction (lower panel, notice the logarithmic scale).
Analogous plots are obtained for the y direction (not shown). Experimental data of the distributions ( ) with standard errors are compared with best fits (solid line). Note that the distribution is broadened along the negative x direction (and, analogously, along the positive y direction).
On the other hand, along the opposite direction (i.e. along positive x and negative y directions) distributions are still exponential (see Fig. 11 and Fig. 12, upper panels), namely

This kind of distribution is compatible with the ability of the cells to perceive a chemotactic gradient along negative x and positive y directions which, on the cartesian xy plane, corresponds to a drift towards the second quadrant, where the source of melanoma cells resides. This kind of behavior is evidenced for both WT-PRE and WT-POST; related fitting coefficient are reported in Tabs. III,IV,V,VI: notice that for WT-PRE the effect is stronger.
 with the average over all values for positive Δx with overall good numerical agreement (within the experimental error). Information extractable from this table mirrors that of Tab. I
 of negative Δx obtained by the log-normal fit with the experimental average and the standard deviation σx with the experimental value
 of positive Δy obtained by the log-normal fit with the experimental average and the standard deviation σy with the experimental value
 with the average over all values for negative Δy
This may be due to the fact that WT-POST splenocytes, after the migration to the B16 compartment, are at least partially surrounded by tumor cells in such a way that the resulting signaling is less focussed and, consequently, this drift becomes weaker.
The data described so far suggest that WT splenocytes can be modeled by biased random walks. This is indeed corroborated by the analysis of the turning angle θ and by the related angular correlation CWT(τ) (see Fig. 13). Also in this case, the bias is especially stronger for WT-PRE. Indeed, as mentioned above, in the B16 compartment, splenocytes tend to change direction slightly more frequently because of a broadened presence of melanoma cells.

Left panels: angular correlation function CWT(τ) of the turning angle θ of WT-PRE splenocytes (upper panel) and of WT-POST splenocytes (lower panel).
Each turn occours every 4 minutes. In both cases the correlation is mostly positive, meaning that the process has memory. In the inset we show the polar histogram of the angle measured with respect to the horizontal axis. Right panels: distribution of the turning angle for WT-PRE splenocytes (upper panel) and of WT-POST splenocytes (lower panel). The experimental distribution is fitted by a Gaussian peaked at 0 rad, since splenocytes tend to maintain the same direction. Note that the resulting Gaussian shape is in full agreement with the mathematical description of the motion in terms of a (biased and uncorrelated) stochastic process (further an analysis of its variance will be successfully exploited in the last section due to numerical simulations).
However, no significant temporal correlation among steps is evidenced since, for each splenocyte, the mean step  (see Eq. 2) turns out to be (approximately) constant in time for both WT-PRE and WT-POST splenocytes. Thus, no acceleration is observed in the process and the instantaneous speed is stable (see Fig. 14 and 15). Of note, the speed of the splenocytes decreases, once they have crossed the microchannels: while in the Spl compartment it is 3.7 ± 0.1 μm/min, in the B16 compartment it decreases down to 2.4 ± 0.1 μm/min. Again, we can notice how the behavior of the splenocytes changes according to their proximity with the tumor.

Mean step length  versus time for WT-PRE and WT-POST splenocytes (left and right panel, respectively).
Results for each splenocyte (thin curves) are compared with the resulting average over all splenocytes (thick curve). In both cases,  appears constant in time.

Mean instantaneous speed of WT-PRE splenocytes (upper panel) and of WT-POST splenocytes (lower panel).
Binned data ( ) with standard errors are best fitted by a constant line (solid curve). In both cases, no evident acceleration is observed, but, in the latter case, speed is lower.
Focusing on the analysis of the macroscopic process, the most remarkable point is that the mean displacement grows linearly with time (see Fig. 16), for both WT-PRE and WT-POST splenocytes, as expected for a biased random walk, strongly supporting the evidence of a highly coordinate motion for the system as a whole. Notably, also in this case, it appears evident that WT-PRE splenocytes are faster than the WT-POST, since they have a greater mean displacement over time (see angular coefficients of the linear fit of 〈r(t)〉 in Tab. VII).

〈r(t)〉 versus t for WT-PRE splenocytes (upper panel) and for WT-POST splenocytes (lower panel).
As expected, the mean displacement grows linearly with time. Binned data ( ) with standard errors are compared with best fit (solid line), whose coefficients are also reported.
Moreover, we checked that the linear behavior is also observed along both x and y directions of motion (of course, 〈x(t)〉 decreases and 〈y(t)〉 increases over time because the drift is directed along the negative x and the positive y axis).
In contrast to the isotropic unbiased random walk of KO splenocytes, here the mean squared displacement is proportional to t2 for large t (see Fig. 17), so the signal propagates as a wave, as expected for a ballistic motion.

 (◊) and 〈r2(t)〉 (○) vs t for WT-PRE splenocytes (upper panel) and for WT-POST splenocytes (lower panel).
Symbols represent experimental data with standard errors, while the solid lines represent the best fits. Notice that, for both sets of splenocytes,  and 〈r2(t)〉 are nicely overlapped, both growing with the square of time.
This picture of random walk with bias is also confirmed by the straightness index (see Fig. 18) whose mean value, for WT-PRE splenocytes, ranges between 0.9 and 1.0, while for WT-POST, ranges between 0.7 and 0.8; this means that for WT-POST the motion is less straight, consistently with results discussed above.

Straightness index S for WT-PRE splenocytes (left panel) and for WT-POST splenocytes (right panel); the thick lines represent the related averages over all splenocytes at each time 〈S〉.
As expected for a random walk with bias, it takes values close to 1.
Finally, we successfully checked ergodicity also in WT splenocytes: as shown in Fig. 17, experimental data for  and for 〈r2(t)〉 are nicely overlapped and best-fitted by a power law with exponent approximately equal to 2. Fit coefficient, reported in Tab. VIII, provide us with further important information: the mean displacement of splenocytes (both in time and on the ensamble) shows a value that is one order of magnitude higher in case of WT-PRE compared with WT-POST. This result expresses in a clearly measurable way the role of melanoma cells on the motion of splenocytes. This observation is further in line with the concept that spleen cells motion is driven by a chemotactic gradient: as they approach to the target, namely the tumor cell, these cells tend to slow down in order to establish a physical contact. Moreover, the importance of the performed data analysis consists in providing quantitative values describing the cell dynamics which is fundamental to compare data acquired in different experimental conditions.
 and 〈r2(t)〉 for WT-PRE and WT-POST splenocytes
Comparison with Numerical Simulations
In this Section we further check the robustness of our model, via numerical simulations: in particular we simulated random walks with step lengths drawn from Eq. 8 and Eqs. 9 and 10 and we measured the resulting displacement 〈r(t)〉. Such values are then compared with those obtained from real data of splenocyte displacement and previously shown in Figs. 9 and 16, respectively.
As shown in Fig. 19, the comparison is, in general, very good. In the simulations meant to recover the behavior of KO splenocytes we realized N = 30 random walks made of T = 350 steps; in the simulations meant to recover the behavior of WT-PRE splenocytes we realized N = 31 random walks made of T = 20 steps, while in the simulations meant to recover the behavior of WT-POST splenocytes we realized N = 14 random walks made of T = 71 steps, consistently with raw data available (see Results).

Comparison between experimental data ( ), their best fit (solid line) and data from numerical simulation (the area highlighted is centered on the average value, where the average is performed over N independent realizations and spans over its standard deviation).
The KO case (left panel), the WT-PRE case (central panel) and the WT-POST case (right panel) are all considered. Notice that experimental data and best fits are those previously reported in Figs. 9 and 16, respectively.
Moreover, the parameters λx and λy for the KO case and of the parameters p1x, p1y,  , σx,
, σx,  , σy for the WT case are those given in Tabs. I, III,IV,V,VI, according to the case considered. In addition, for the WT case, a bias has been introduced in such a way that the correlation among successive steps is consistent with the experimental data depicted in Fig. 13.
Conclusion
In this work, we report a data analysis on the motility of immune cells towards tumor cells by exploiting splenocytes deficient for the transcription factor IRF-8, in comparison to WT cells during co-culture with melanoma cells in a microfluidic device.
We framed their dynamics within the stochastic process theory and built a library of suitable observables to tackle their motion complexity. Through this analysis, we could show that every single IRF-8 KO cell performs pure uncorrelated random walks without pointing to the target, represented by the melanoma cell. Conversely, WT splenocytes, singly, are able to perform drifted random walks, which, collectively, collapse onto a straight ballistic motion for the system as a whole, giving rise to an effectively high coordinate motion towards melanoma cells. At a more detailed level of investigation, IRF-8 KO cells move rather uniformly since their step lengths are exponentially distributed with a characteristic step length λ in agreement with literature, e.g. λ ~ 4.5 μm. On the contrary, WT cells display a qualitatively broader motion, due to their step lengths along the direction of the melanoma log-normally distributed. The resulting dynamics are in good agreement with models of in vivo behavior of immune cells, showing poor ability of IRF-8 KO immune cells to migrate towards the tumor site, in mice inoculated with B16 melanoma22,23.
In conclusion, our analysis clearly evidences the value of an integrated approach of Cell-on-Chip devices and high-data driving theoretical scaffolds, such as those derived from the stochastic theory, for quantifying experiment's outcomes. In fact, Cell-on-chip devices allow to fully exploit the modern microscopy tools and, through image data extraction, give access to the exploitation of the suitable mathematical tools able to quantify information.
Future progress in combining nano-engineering, cell biology, live microscopy and computational sciences will promote a new level of insight to studies of host immune system-pathogen interplay.
References
Kim, P. S., Levy, D. & Lee, P. P. Modeling and simulation of the immune system as a self-regulating network. Method. enzymol. 144, 79–109 (2009).
Wlodkowic, D., Faley, S., Zagnoni, M., Wikswo, J. P. & Cooper, J. M. Microfluidic single-cell array cytometry for the analysis of tumor apoptosis. Anal. Chem. 81, 5517–5523 (2009).
Chung, S., Sudo, R., Vickerman, V., Zervantonakis, I. K. & Kamm, R. D. Microfluidic platforms for studies of angiogenesis, cell migration and cell–cell interactions. Ann. Biomed. Eng. 38, 1164–1177 (2010).
Mora, T. et al. Maximum entropy models for antibody diversity. Proc. Natl. Acad. Sci. USA 107, 5405–5410 (2010).
Agliari, E., Annibale, A., Barra, A., Coolen, A. C. C. & Tantari, D. Immune networks: Multitasking capabilities at medium load. J. Phys. A 46, 335101s (2013).
Agliari, E., Annibale, A., Barra, A., Coolen, A. C. C. & Tantari, D. Immune networks: Multitasking capabilities near saturation. J. Phys. A 46, 415003 (2013).
Martelli, C. et al. Identifying essential genes in Escherichia coli from a metabolic optimization principle. Proc. Natl. Acad. Sci. USA 106, 2607–2611 (2009).
Annibale, A. & Coolen, A. C. C. Protein Networks Reveal Detection Bias and Species Consistency When Analysed by Information-Theoretic Methods. PLoS-One e12083 (2010).
Agliari, E., Asti, L., Barra, A., Scrivo, R., Valesini, G. & Wallis, R. S. Application of a stochastic modeling to assess the evolution of tuberculous and non-tuberculous mycobacterial infection in patients treated with tumor necrosis factor inhibitors. PLoS One e55017 (2012).
Perelson, A. S. & Weisbuch, G. Immunology for physicists. Rev. Mod. Phys. 69, 1219 (1997).
Galper, T., Marre, O., Amodei, D., Schneidman, E., Bialek, W., Berry, I. I. & Michael, J. Searching for collective behavior in a network of real neurons. preprint arXiv 1306–3061 (2013).
Agliari, E., Barra, A., Moauro, F. & Guerra, F. A thermodynamic perspective of immune capabilities. J. Theor. Biol. 287, 48–63 (2011).
Vedel, S. et al. Migration of cells in a social context. Proc. Natl. Acad. Sci. USA 110, 129–134 (2013).
Boral, D. & Nie, D. Cancer stem cells and niche mircoenvironments. Biomed. microdevices 4, 2502–2514 (2012).
Dvorak, H. F., Weaver, V. M., Tlsty, T. D. & Bergers, G. Tumor microenvironment and progression. J. Surg. Oncol. 103, 468–474 (2012).
Hodi, F. S. & Dranoff, G. The biologic importance of tumor-infiltrating lymphocytes. J. Cutan. Pathol. 37, 48–53 (2010).
Kerkar, S. P. & Restifo, N. P. Cellular constituents of immune escape within the tumor microenvironment. Cancer Res. 72, 3125–3130 (2012).
Lu, T. & Gabrilovich, D. I. Molecular pathways: tumor-infiltrating myeloid cells and reactive oxygen species in regulation of tumor microenvironment. Clin Cancer Res. 18, 4877–4882 (2012).
Ma, Y., Aymeric, L., Locher, C., Kroemer, G. & Zitvogel, L. The dendritic cell-tumor cross-talk in cancer. Curr. Opin. Immunol. 38, 47–52 (2012).
Schiavoni, G., Gabriele, L. & Mattei, F. The tumor microenvironment: a pitch for multiple players. Front. Oncol. 3, 74–92 (2013).
Toh, B., Chew, V., Dai, X., Khoo, K., Tham, M., Wai, L. E., Hubert, S., Velumani, S., Zhi, L. & Huang, C. Immune predictors of cancer progression. Immunol. Res. 53, 229–234 (2012).
Mattei, F., Schiavoni, G., Sestili, P., Spadaro, F., Fragale, A., Sistigu, A., Lucarini, V., Spada, M., Sanchez, M., Scala, S., Battistini, A., Belardelli, F. & Gabriele, L. IRF-8 controls melanoma progression by regulating the cross talk between cancer and immune cells within the tumor microenvironment. Neoplasia 14, 1223–1235 (2012).
Mattei, F. et al. A multidisciplinary study using in vivo tumor models and microfluidic cell-on-chip approach to explore the cross-talk between cancer and immune cells. J. Immunotoxic. 3, 42354 (2014).
Hanahan, D. & Weinberg, R. A. The hallmarks of cancer. Cell 100, 57–70 (2000).
Businaro, L., Ninno, A. D., Schiavoni, G., Lucarini, V., Ciasca, G., Gerardino, A., Belardelli, F., Gabriele, L. & Mattei, F. Cross talk between cancer and immune cells: exploring complex dynamics in a microfluidic environment. Lab Chip 13, 229–239 (2013).
Giese, N. A., Gabriele, L., Doherty, T. M., Klinman, D. M., Tadesse-Heath, L., Contursi, C., Epstein, S. L. & Morse, H. C. Interferon (IFN) consensus sequence-binding protein, a transcription factor of the IFN regulatory factor family, regulates immune responses in vivo through control of interleukin 12 expression. J. Exp. Med. 186, 1535–1546 (1997).
Schiavoni, G., Mattei, F., Sestili, P., Borghi, P., Venditti, M., Morse, H. C., Belardelli, F. & Gabriele, L. ICSBP is essential for the development of mouse type I interferon-producing cells and for the generation and activation of CD8a+ dendritic cells. J. Exp. Med. 196, 1415–1425 (2002).
Clement, M. et al. Expression of sialyl-Tn epitopes on β1 integrin alters epithelial cell phenotype, proliferation and haptotaxis. J Cell Sci 117 (2004).
Yao, E. et al. Suppression of HER2/HER3-Mediated Growth of Breast Cancer Cells with Combinations of GDC-0941 PI3K Inhibitor, Trastuzumab and Pertuzumab. Clin Cancer Res 15, 4147 (2009).
Aliberti, J., Schulz, O., Pennington, D. J., Tsujimura, H., Reis e Sousa, C., Ozato, K. & Sher, A. Essential role for ICSBP in the in vivo development of murine CD8α+ dendritic cells. Blood 101, 305–310 (2003).
Mattei, F., Schiavoni, G., Borghi, P., Venditti, M., Canini, I., Sestili, P., Pietraforte, I., Morse, H. C., Ramoni, C. & Belardelli, F. ICSBP/IRF-8 differentially regulates antigen uptake during dendritic-cell development and affects antigen presentation to CD4+ T cells. Blood 108, 609–617 (2006).
Schiavoni, G., Gabriele, L. & Mattei, F. The dual role of IRF8 in cancer immunosurveillance. Oncoimmunology e25476 (2013).
Schiavoni, G., Mattei, F., Borghi, P., Sestili, P., Venditti, M., Morse, H. C., Belardelli, F. & Gabriele, L. ICSBP is critically involved in the normal development and trafficking of Langerhans cells and dermal dendritic cells. Blood 6, 2221–2228 (2004).
Weiss, G. H. Aspects and applications of random walks, (North-Holl. Press, Amsterdam, 1994).
Batschelet, E. Circular statistics in biology, (Academic Press Inc., London, 1981).
Almeida, P. J. A. L., Vieira, M. V., Kajin, M., Forero-Medina, G. & Cerqueira, R. Indices of movement behavior: conceptual background, effects of scale and location errors. Zoologia 5, 674–680 (2010).
Klafter, J. & Sokolov, I. M. First Steps in Random Walks: From Tools to Applications, (Oxford Univ. Press, Oxford, 2011).
Barkai, E., Garini, Y. & Metzler, R. Strange kinetics of single molecules in living cells. Phys. Today 65, 29–35 (2012).
Yang, T. D., Park, J., Choi, Y., Choi, W., Ko, T. & Lee, K. J. Zigzag turning preference of freely crawling cells. PLoS-One e20255 (2011).
Acknowledgements
Italian Minister of University and Research through the grant FIRB-RBFR08EKEV and through INdAM-GNFM (Progetto Giovani Agliari2014) support, Italian Ministry of Health through grant RF-2011-02347120 to FM and through ”Programma Integrato Oncologia„ 2006, Italian Association for Cancer Research (AIRC) through projects no. 14297 to GS, no. 11610 to LG and no. 10720 to Dr. Filippo Belardelli are acknowledged. The authors are grateful to Giorgio Parisi for useful discussions.
Author information
Authors and Affiliations
Contributions
G.S., L.G. and F.M. handled all the pure-biological procedures required to set up the experiment, while A.D.N., A.G. and L.B. built the LabOnChip where the experiment was hosted and all of them carried out the experiment and produced data. E.A., E.B. and A.B. analyzed them via theoretical physics glasses and framed them within the theory of stochastic processes. The general guidelines of investigations have been decided in constant mutual collaboration among all the researchers. L.B., F.M. and A.B. share equal credit for senior authorship.
Ethics declarations
Competing interests
The authors declare no competing financial interests.
Electronic supplementary material
Supplementary Information
Appendix
Rights and permissions
This work is licensed under a Creative Commons Attribution-NonCommercial-NoDerivs 4.0 International License. The images or other third party material in this article are included in the article's Creative Commons license, unless indicated otherwise in the credit line; if the material is not included under the Creative Commons license, users will need to obtain permission from the license holder in order to reproduce the material. To view a copy of this license, visit http://creativecommons.org/licenses/by-nc-nd/4.0/
About this article

Cite this article
Agliari, E., Biselli, E., De Ninno, A. et al. Cancer-driven dynamics of immune cells in a microfluidic environment. Sci Rep 4, 6639 (2014). https://doi.org/10.1038/srep06639
Received:
Accepted:
Published:
DOI: https://doi.org/10.1038/srep06639
This article is cited by
-
The Applications and Challenges of the Development of In Vitro Tumor Microenvironment Chips
Cellular and Molecular Bioengineering (2023)
-
Multi-scale generative adversarial network for improved evaluation of cell–cell interactions observed in organ-on-chip experiments
Neural Computing and Applications (2021)
-
Discovering the hidden messages within cell trajectories using a deep learning approach for in vitro evaluation of cancer drug treatments
Scientific Reports (2020)
-
Evaluation of cytotoxic T lymphocyte-mediated anticancer response against tumor interstitium-simulating physical barriers
Scientific Reports (2020)
-
Organoid models of gastrointestinal cancers in basic and translational research
Nature Reviews Gastroenterology & Hepatology (2020)
Comments
By submitting a comment you agree to abide by our Terms and Community Guidelines. If you find something abusive or that does not comply with our terms or guidelines please flag it as inappropriate.
