
Abstract
Most Li-O2 batteries suffer from sluggish kinetics during oxygen evolution reactions (OERs). To overcome this drawback, we take the lesson from other catalysis researches that showed improved catalytic activities by employing metal alloy catalysts. Such research effort has led us to find Pt3Co nanoparticles as an effective OER catalyst in Li-O2 batteries. The superior catalytic activity was reflected in the substantially decreased overpotentials and improved cycling/rate performance compared to those of other catalysts. Density functional theory calculations suggested that the low OER overpotentials are associated with the reduced adsorption strength of LiO2 on the outermost Pt catalytic sites. Also, the alloy catalyst generates amorphous Li2O2 conformally coated around the catalyst and thus facilitates easier decomposition and higher reversibility. This investigation conveys an important message that understanding elementary reactions and surface charge engineering of air-catalysts are one of the most effective approaches in resolving the chronic sluggish charging kinetics in Li-O2 batteries.
Introduction
Li-ion batteries (LIBs) have penetrated deeply into our everyday lives. They are power sources of various mobile electronics and have also begun to support future green transportation. However, the current LIBs rely on the intercalation mechanism for reversible reactions of Li ions with active materials on both cathode and anode sides, so their practical energy densities are usually limited below 250 Wh kg−11,2. This limitation imposes a significant hurdle for future LIB applications, especially all-electric vehicles (EVs) that require the battery energy density substantially larger than the current values. The energy density of the EV battery is directly related to driving distance per each charge and its driving mileage will be inevitably assessed in comparison against those of today's combustion engine-based counterparts: ~550 km per each refuel1,2,3.
With such increasing demand for the high energy density LIBs, recently, significant research effort has been invested to battery systems based on new chemistry, such as Li-O21,2,3 and Li-S batteries4,5,6,7. In particular, Li-O2 batteries have received a great deal of attention because they can afford to deliver 3 ~ 5 times higher energy densities than those of the conventional LIBs by employing gas-phase oxygen as an active material on the cathode side1,3,8,9. However, Li-O2 batteries are still under their infancy stage, as they need to address various fundamental issues before their practical application: short cycle life (about 100 cycles), low round trip efficiency and poor rate capability9,10,11,12,13,14. All of these issues are indeed linked to each other and are originated largely from irreversible characteristic of the reaction at the air cathode. In the cathode reaction, 2Li+ + O2 + 2e− [lrhar2 ] Li2O2, the reverse oxygen evolution reaction (OER) is required to overcome higher energetic barrier than that of the forward oxygen reduction reaction (ORR), leading to more sluggish OER kinetics (or larger OER overpotentials) and subsequently poor round trip efficiency3,12,15,16,17. Hence, the overpotential during the charging process is an indicator of the OER efficiency and minimization of its value can be a meaningful research direction.
In an effort to improve the sluggish OER kinetics, so far various catalysts including metal oxides (α-MnO2, λ-MnO2, Co3O4, RuO2, etc.)18,19,20,21, noble metals (Pt, Au, Ru, Pd)10,15,22,23,24 and their alloys (PtNi, PtCo, PtAu, etc.)25,26,27 have been interrogated. However, in the initial period of the catalysis investigation, the overall cathode reaction was not fully clarified. The series of successive research revealed that beside the aforementioned reaction involving Li2O2, other side reactions could take place simultaneously. In particular, the most commonly used carbonate-based electrolytes are vulnerable to superoxide attack and, as a result, generate highly irreversible Li2CO3 and other parasitic products (C3H8(OCO2Li)2, HCO2Li and CH3CO2Li, etc.)28. Such poorly defined systems resulted in improper interpretation on the roles of the given catalysts and have driven the community to revisit the problem by developing the cells in which Li2O2 is mainly produced as a discharge product at least in the beginning of cycles. For example, McCloskey et al. tested α-MnO2, Au and Pt catalysts in the electrolyte containing dimethylether (DME) because the DME-based cells had been found to generate Li2O2 exclusively as a discharge product. However, their measurements were conducted only under the limited capacity condition (~110 mAh g−1carbon) and therefore buried distinctive catalytic effects22,29. Harding et al. also demonstrated improved performance by engaging Pt, Au and Ru in the DME electrolyte as compared with that of the bare carbon electrode22. However, the underlying mechanism on the improved performance was not clarified and the overall performance left a significant room to be improved perhaps due to the use of the commercially available such catalysts yet to be further optimized.
While seeing the sluggish OER kinetics as an origin of the unsatisfactory electrochemical properties in Li-O2 batteries, we have also noted that surface charge modulation has been the most general approach in improving the activities of the catalysts in various other conventional systems. In particular, inspired by the improved catalytic activities of alloyed metal catalysts in fuel cells with similar triple-phase interfaces, we have paid attention to the alloying effects of metal catalysts. Moreover, a recent theoretical investigation suggested the feasibility of low charging overpotentials when certain sites on the given Li2O2 facets are involved as main reaction spots, indicating that effective catalysts can reduce charging overpotentials substantially30. As a result of such an effort, we found that highly dispersed Pt3Co alloy nanoparticles (NPs) as small as ~3 nm can be a very effective OER catalyst in Li-O2 batteries with the ether-based electrolyte. Remarkably, the Pt3Co NPs catalyst exhibited unprecedentedly low charging overpotentials as compared to those of any other catalysts to date investigated at the same current densities12,15,19,20,23,24,31,32, resulting in excellent rate performance and cycle life. Moreover, density functional theory (DFT) calculations suggested that the reduced adsorption strength of intermediate reaction product (LiO2) may play a critical role for the significantly improved charging kinetics of Pt3Co NPs and the neighboring Co atoms contribute to such improvement via surface charge modulation of the outer Pt atoms.
Results
Synthesis and characterization of Pt3Co NPs
The Pt3Co NPs with 3 ~ 5 nm in sizes were synthesized through a well-established hydrothermal process engaging hexadecyltrimethylammonium bromide (CTAB) as a capping agent. In actual experiment, Ketjen black (KB) particles with diameters around 50 nm were first functionalized with CTAB and Pt3Co NPs were then grown on the KB surfaces by simultaneously adding two precursor solutions (K2PtCl4 and Co(NO3)2·6H2O both in DI water) with designated concentrations. Detailed synthetic procedures are described in the Methods section. Transmission electron microscopy (TEM) characterization (Figures 1a and b) showed that Pt3Co NPs were well-dispersed on the KB particles utilizing the steric repulsion of CTAB tails (Supplementary Fig. S1 for the case without a CTAB treatment)33,34. A fast Fourier transformed (FFT) pattern obtained for two Pt3Co NPs (Figure 1b inset) exhibited the spots corresponding to the (1-11), (200) and (11-1) planes of Pt3Co under the face-centered cubic (fcc) crystal structure, thus confirming the valid crystal structure of the synthesized NPs35. Also, the scanning transmission electron microscopy (STEM) image of the Pt3Co/KB composite and its corresponding energy-dispersive X-ray spectroscopy (EDAX) elemental mapping (Figure 1c) verify the uniformly distributed Pt3Co NPs. In addition, while the X-ray diffraction (XRD) spectrum (Supplementary Fig. S2) of Pt3Co/KB reconfirmed the given crystal structure, it was observed that the peak locations of Pt3Co/KB were shifted to the larger 2θ values by ~0.7° compared to those of Pt/KB, indicating the decreased lattice distances of Pt3Co upon Co incorporation. For example, for the (111) lattice orientation, the lattice distances of Pt3Co/KB and Pt/KB were 3.86 Å and 3.92 Å, respectively. The smaller lattice distance of Pt3Co reflects the smaller atom size of Co compared with that of Pt36,37. The Scherrer equation based on the (111) peak suggests the size of the crystalline domain of Pt3Co/KB to be around 2.2 nm, which is indeed very close to the NP sizes observed during the TEM characterization. Also, an inductively coupled plasma (ICP) analysis verifies the correct atomic ratio of the Pt3Co NPs (Pt:Co = 3:1).

Characterization of catalytic Pt3Co NPs supported on the KB carbon.
TEM images of the highly dispersed Pt3Co NPs at (a) low and (b) high magnifications. (b, inset) FFT patterns obtained from the white box in (b). (c) An STEM image of the same sample (top left) alongside EDAX elemental mappings with regard to carbon, platinum and cobalt.
Battery performance and surface analyses of air cathodes
In order to assess the catalytic effect of Pt3Co NPs on the electrochemical performance of the catalyst-carbon composite electrode, coin-type cells were prepared by employing Li metal disks as the counter/reference electrodes. 1 M lithium bis(trifluoromethanesulfonyl)imide (LiTFSI) dissolved in tetraethylene glycol dimethyl ether (TEGDME) was used as the electrolyte because this electrolyte has been found to be more stable from superoxide attack and also generate Li2O2 as a major discharge product11,19,38,39,40. The potential range of most galvanostatic measurements was set to 2.0 ~ 4.5 V vs. Li/Li+ because 4.5 V has been known to be effective in oxidizing the products formed during the discharge and thus increasing the reversibility in each cycle while irreversible anodic electrolyte decomposition does not take place to a serious level41. Our control experiment with the given electrolyte also indicates that severe electrolyte decomposition starts around 4.7 V (Supplementary Fig. S3), consistent with the values reported in literature38,39.
Figure 2a displays the first voltage profiles of the cells containing the air cathodes based on various catalysts: KB alone, KBs with α-MnO2, Pt and Pt3Co attached on the KB surfaces (denoted as KB, α-MnO2/KB, Pt/KB, Pt3Co/KB). The Pt/KB was synthesized via the same hydrothermal process as the Pt3Co/KB except using only the Pt precursor. α-MnO2 was also synthesized through a hydrothermal process and showed nanorod morphology (Supplementary Fig. S4). See the Methods section for synthetic procedures of all of the cathode materials investigated herein. While all of these four samples showed almost same discharging profiles with characteristic plateaus at 2.7 V, they showed charging profiles with remarkably distinctive overpotentials. Notably, Pt3Co/KB exhibited far smaller charging overpotentials compared to those of the other control cases including Pt/KB. At the same current density of 100 mA g−1carbon, Pt3Co/KB, Pt/KB, α-MnO2/KB and KB showed 135, 635, 1150 and 1085 mV as charging overpotentials. In the present investigation, the charging overpotential is defined as the gap between observed charging potential and thermodynamic potential at the point of 600 mAh g−1carbon. All of these samples were also measured at higher current densities and the corresponding profiles are presented in Figure 2b and Supplementary Fig. S5. As in the results at 100 mA g−1carbon, Pt3Co/KB exhibited substantially smaller charging overpotentials compared to those of the other controls in the entire range of the current density (Figure 2c), implying that the superior catalytic activity of Pt3Co/KB holds true regardless of the current density applied. The higher overpotential of α-MnO2/KB compared to that of pure KB can be interpreted that the moderate electronic conductivity of α-MnO2 increases the cell resistance, making the overall performance worse than that of the catalyst-free case. Such buried catalytic effect of α-MnO2 due to its limited conductivity was observed in other report29. The superior catalytic effect of Pt3Co was further verified by galvanostatic intermittent titration technique (GITT) results (Figure 2d). While both Pt/KB and Pt3Co/KB showed equilibrium potentials near 2.96 V that is consistent with the thermodynamic value for the governing reaction (2Li+ + O2 + 2e− [lrhar2 ] Li2O2), the charging overpotential in each interval was clearly smaller for Pt3Co/KB than for Pt/KB, reconfirming the improved catalytic effect of Pt3Co NPs toward OER kinetics. The control experiments testing CTAB alone (denoted as CTAB/KB, Supplementary Fig. S6) and Pt3Co in a closed cell configuration (oxygen not accessible) (Supplementary Fig. S7) exhibited no tangible side reactions, thus supporting that the observed different overpotentials are mainly from the catalytic effects involving oxygen (Supplementary Fig. S8 for cyclic voltammograms (CVs) of the other samples).

(a) The first voltage profiles of the Li-O2 batteries containing KB, α-MnO2/KB, Pt/KB and Pt3Co/KB as air cathode materials when measured at a current density of 200 mA g−1carbon. The dashed line indicates the thermodynamic potential of 2Li+ + O2 + 2e− [lrhar2 ] Li2O2. (b) The voltage profiles of Pt3Co/KB at different current densities in the voltage range of 2.0 ~ 4.5 V. (c) The summarized charge overpotentials (ηOER) of various catalysts at different current densities. (d) GITT data of the Pt/KB and Pt3Co/KB air electrodes. All of the data in this figure were measured at a fixed capacity of 1,000 mAh g−1carbon.
The reversibility of the cell containing the Pt3Co/KB air electrode was investigated using various analytical tools and the following results are noteworthy.
-
1
The Raman spectra obtained at different states of a full cycle are comparatively displayed in Figure 3a. When measured with a constant capacity of 1,000 mAh g−1carbon, the Raman spectrum of Pt3Co/KB showed a newly appearing peak at 780 cm−1 indicative of Li2O2 formation42. However, this peak disappeared upon charging, suggesting reversible nature of the given electrode.
Figure 3 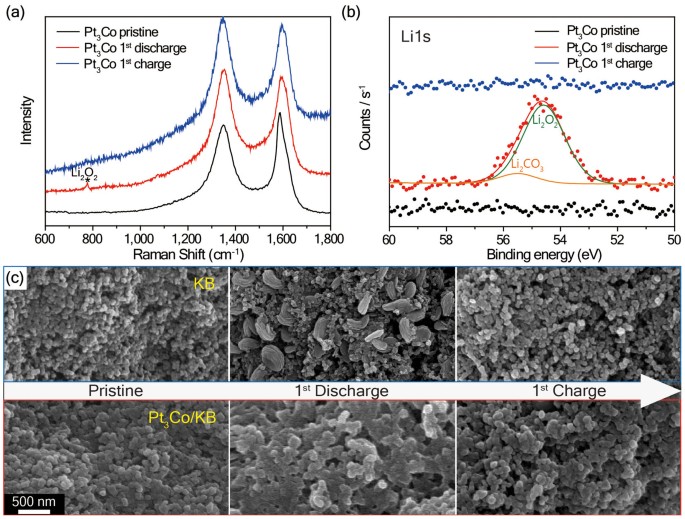
(a) Raman spectra, (b) Li1s XPS spectra and (c) SEM images of the KB and Pt3Co/KB air electrodes at the pristine, first discharged and first charged states.
The galvanostatic scan rate and limited capacity conditions were 200 mA g−1carbon and 1,000 mAh g−1carbon, respectively. In (c), all of the SEM images were taken at the same magnification.
-
2
The Li1s X-ray photoelectron spectroscopy (XPS) spectra are commensurate with the Raman results. When tested for the sample scanned at the same electrochemical condition, a Li2O2 peak (54.7 eV) together with a minor Li2CO3 peak (55.5 eV) was observed43. The Li2CO3 formation must originate from decomposition of the electrolyte and carbon38,44,45.
-
3
Scanning electron microscopy (SEM) images were also obtained for KB and Pt3Co/KB to elucidate the morphological changes at the same three stages of a full cycle (Figure 3c and Supplementary Fig. S9). Pt3Co/KB showed amorphous Li2O2 conformally coated along the surfaces of Pt3Co/KB NPs, whereas KB showed Li2O2 with distinctive morphology close to toroid. The amorphous character of Li2O2 on the Pt3Co/KB was verified by XRD characterization. Although, in the case of Pt3Co/KB, the formation of Li2O2 was confirmed by the Raman and XPS results after discharge, the Li2O2 peaks were not observed in the XRD spectrum, indicating a lower degree of Li2O2 crystallinity. However, in the case of KB, the peaks indicative of the crystalline Li2O2 appeared at 32.9°, 35.0° and 58.7° (Supplementary Fig. S10)39. These results imply that the Pt3Co catalyst affects both morphology and crystallinity simultaneously toward increasing the reversibility in each cycle through increased contact area between Li2O2 and the catalyst.

The cycle lives of all of the four samples were measured under a limited specific capacity of 1,000 mAh g−1carbon (Figure 4a). All of the capacities were calculated based on the mass of KB. First, as in the case of overpotential measurements, KB and α-MnO2/KB exhibited almost the same cycling performance, indicating that the α-MnO2 catalyst is not effective in improving the cycle life29. The consistent trend between these measurements, in turn, suggests that the increased overpotentials (or slow OER kinetics) are directly related to the inferior cycling performance and efficient Li2O2 decomposition is critical in both cycle life and kinetics. Again consistent with the overpotential results, Pt3Co/KB exhibited superior cycling performance compared to that of Pt/KB as well as those of the other two controls. This improved cycling performance is also attributed to the further improved OER kinetics that facilitate more efficient decomposition of Li2O2, supporting the coherent view that accumulation of Li2O2 during cycling is one of the most critical origins for capacity fading due to its insulating character44. In spite of superior OER kinetics of the catalyst (Figure 4b and Supplementary Fig. S11), Pt3Co/KB still showed capacity fading after 35 cycles. The corrosion of Li anode from oxygen crossover23 could be a reason for this fading. However, this scenario is unlikely to be our case according to a control experiment where the Li metal run for the 35 cycles in Figure 4a exhibited robust cycling when retested in a fresh cell (Supplementary Fig. S12). Thus, in the current investigation, we paid our main attention to accumulation of the reaction products, which diminishes the catalytic activity and surface area of Pt3Co.

(a) The cycling performances of the air electrodes based on various catalysts and carbon supports in the potential range of 2.0 ~ 4.5 V. (b) Voltage profiles of Pt3Co/KB during the first five cycles. (a) and (b) were measured at a current density of 200 mA g−1carbon with a fixed capacity of 1,000 mAh g−1carbon. EDAX line mappings across the Pt3Co catalyst after (c) the first and (d) 30th cycles with regard to carbon, oxygen, platinum and cobalt.
To elucidate the catalyst contamination during the course of repeated cycles, the line-scanned elemental mapping on the catalysts was conducted using EDAX after the first and 30th cycles (Figure 4c and d). The profiles clearly exhibited significantly increased carbon and oxygen content, which can be interpreted that unwanted decomposition products such as Li2CO3 are successively accumulated over cycling, resulting in eventual capacity fading. Once again, the formation of such products must originate as a combined outcome from decomposition of TEGDME by reaction with Li2O2 or KB especially at its defects38,44 as well as corrosion of carbon supports45. Besides the increased carbon content in the line profile, the increased side products (such as Li2CO3) were reflected in the increased overpotentials of the voltage profiles as well as Raman, FT-IR and SEM results (Supplementary Fig. S13) and must play a critical role in the capacity fading during cycling. In addition, TEM images of Pt3Co/KB taken after 30 cycles (Supplementary Fig. S14) showed a similar density of Pt3Co NPs to that in the pristine sample (Figure 1a and b) without noticeable agglomeration, suggesting that the composite structure is robust during cycling and capacity fading is mainly from accumulation of the reaction products.
To improve the cycling performance even further by decreasing catalyst contamination, we replaced KB with carbon nanotubes (CNTs) as a catalyst support (denoted as Pt3Co/CNT) as displayed in the TEM images (Supplementary Fig. S15). In the cycling tests, as shown in Figure 4a, Pt3Co/KB exhibited a significant capacity fading around the 35th cycle, whereas Pt3Co/CNT showed much better capacity retention such as no capacity fading at all for 70 cycles (Supplementary Fig. S16 for the cycling performance of bare CNTs). Such substantially improved cycling performance can be explained by different carbon structures between both samples. In the case of Pt3Co/KB, the discharge and side reaction products are accumulated through large inner pores of KB or at its inevitable defects23,44. Furthermore, such accumulation could penetrate into the internal pores and inter-particle space of the KB particles46,47, accelerating isolation of the KB particles from the current collectors and other neighboring KB particles and thus impairing electronic/ionic diffusion within the electrode film. By contrast, such problem would be much less significant for the CNTs that are interconnected through 1D networks41,48. Furthermore, once properly treated, CNTs have been found to hold relatively cleaner surfaces compared to those of other carbons and are thus more suitable for preventing unwanted side reactions with electrolyte23,44. However, Pt3Co/CNT also showed capacity fading after 70 cycles, which is ascribed to degradation of both air-catalyst and Li metal. In the case of Li metal, phase transformation from Li (lithium color) to LiOH (white color) appears to play a role in such decay (Supplementary Fig. S17). The formation of LiOH has been found to originate from water content generated by ether-based electrolyte decomposition38 or dehydrofluorination of PVDF binder40. We have also performed a scan until reaching the maximum capacity of ~5,600 mAh g−1carbon (Supplementary Fig. S18 for Pt3Co/KB and Supplementary Fig. 19 for the other electrodes). All of the samples showed increased OER overpotentials compared to those of the aforementioned fixed capacity cases, again due to more accumulation of insulating discharge products on the air cathode surface.
Discussion
Theoretical investigation
To elucidate the influence of alloying Pt and Co on the improved electrochemical performance of Li-O2 batteries at the atomic level, we examined the adsorption of various lithium oxide intermediates on Pt and Co single-crystalline surfaces as well as their alloyed surface by means of first-principles calculations using DFT. Various adsorption configurations of LixO2 (x = 1, 2 and 4) along with the relative energies are presented in the Supplementary Fig. S20. Our DFT calculations observed the decreased lattice constants (3.98 Å → 3.87 Å) of Pt3Co upon Co incorporation, in a good agreement with the XRD results (Supplementary Fig. S2). While the overpotential of Li-O2 battery is determined by various parameters such as electrochemical reactions at the catalyst surface, internal resistances within the cell and reactant mass transport, we have paid attention to the adsorption strength because the charge transfer at the catalyst interface is the main parameter that gives rise to the distinctive catalytic activities among the systems investigated in the current study. Detailed computational procedures are described in the Methods section.
Figure 5a shows the energy diagram of ORR and OER on the Pt(111) surface, which illustrates the LixO2 (x = 1, 2 and 4) adsorption/desorption steps along the ORR and OER pathways. The energies of O2 and (Li+ + e−) in these diagrams are referenced to the DFT energies of the isolated O2 molecule and the Li bulk, respectively. Here, three elementary reaction steps were considered: i) Li + O2 → LiO2, ii) LiO2 + Li → Li2O2 and iii) Li2O2 + 2Li → (Li2O)249,50,51. The three reaction products adsorbed on the catalyst surfaces represent the intermediates along the reaction coordinate and the adsorption strength of each intermediate product could give a clue on the experimentally observed distinct charging overpotentials. It is worth noting that LiO2 + Li → Li2O2 and Li + O2 → LiO2 are the elementary reaction steps for determining ηORR and ηOER, respectively, in Figure 5. Thus, LiO2 adsorption strength strongly correlates with the calculated charging (or OER) overpotentials (denoted as ηOER) for all the metal surfaces (vide infra) in a way that as the LiO2 adsorption strength decreases, the catalytic activity of the metal surface increases. Based on this correlation, the catalytic activity turned out to increase in the order of Co(0001) < Pt(111) < Pt3Co(111) (Table 1).

Calculated energy diagrams for Li-ORR/OER on (a) Pt(111), (b) Co(0001) and (c) Pt3Co(111), along with the optimized structures of LixO2 (x = 1, 2 and 4) adsorbed on the surfaces.
The gray, blue, yellow and red balls denote the Pt, Co, Li and O atoms, respectively.
The Pt(111) surface has a lower LiO2 adsorption strength, 3.65 eV, than that (6.95 eV) of the Co(0001) surface, leading to the stronger catalytic activity and thus the smaller overpotentials of the pure Pt surface. By contrast, the pure Co surface exhibiting much larger overpotentials seems catalytically inappropriate for the OER processes due to its strong LiO2 adsorption (Figure 5b). As the Pauling electronegativity of Co (1.88) is lower than that of Pt (2.28), a large electron transfer from the Co surface atoms to LiO2 would increase the energy gain in comparison with the Pt surface atoms. These indicate that, in the case of the Pt3Co alloy, the surface Pt atoms are the active catalytic sites for the LixO2 (x = 1, 2 and 4) adsorptions. It is worth noting that the Pt-skin Pt3Co (111) surface provides even lower ηOER by 0.49 V than that of the pure Pt surface and its energy diagram and intermediate compounds are presented in Figure 5c (see the Pt3Co structures in Supplementary Fig. S21). On the contrary, consistent with the experimental results, the ηORR difference between the Pt3Co and Pt surfaces was not detected, which is attributed to the counterbalance between the adsorption strengths of LiO2 and Li2O2, as shown in Supplementary Fig. S22.
To explain the positive role of Co elements in enhancing the catalytic reactivity of the Pt3Co surface compared to the pure Pt counterpart, we evaluated the electron distribution of LiO2 (QLiO2) and top-layer surface (Qsurface) using the Bader charge analysis52 and the bonding distances R between the surfaces and LiO2. Note that LiO2 adsorption strength and QsurfaceQLiO2/R are proportional to each other (Table 2), indicating that the electrostatic interaction between LiO2 and the top-layer of the metal surface is a crucial factor for the catalytic activity of the given metal surfaces. The top-layer Pt atoms in Pt3Co are less positively charged, Pt 0.78 → Pt3Co 0.48, upon LiO2 adsorption due to the electron transfer from the Co atoms in the second layer, resulting in the weak electrostatic interactions with LiO2, which provides a clue for the experimentally observed smaller ηOER values of these surfaces than the pure Pt surface.
In summary, utilizing the superior catalytic activity of highly dispersed Pt3Co NPs, Pt3Co/KB exhibited substantially smaller charging overpotentials compared to other catalysts considered in operations of Li-O2 batteries. The enhanced catalytic activity of Pt3Co/KB facilitates more efficient decomposition of the discharging reaction products represented by Li2O2, which was reflected in the ultra-low charging overpotentials. Such low overpotentials are directly related to the increased round-trip efficiency and the improved cycle life. The increased reversibility of the Li-O2 battery, once again, a direct outcome of the enhanced catalytic effect of Pt3Co and the conformal morphology of amorphous Li2O2, was also confirmed by the results in both spectroscopic and electron microscope analyses. A theoretical investigation suggested that ηORR and ηOER are determined by the elementary reaction steps LiO2 + Li → Li2O2 and Li + O2 → LiO2, respectively. Thus, LiO2 adsorption strength strongly correlates with the calculated charging overpotentials for all the metal surfaces in a way that as the LiO2 adsorption strength decreases, the catalytic activity of the metal surface increases. The present investigation delivers an important message that the sluggish charging kinetics that causes unsatisfactory performances in various electrochemical aspects in Li-O2 battery operations can be overcome by understanding key elementary reactions and surface charge engineering of catalysts that tunes the interactions with the problematic intermediate reaction products.
Methods
Preparation of catalyst-loaded KB carbon
CTAB-functionalized KB was prepared by adding 1 g of CTAB (Aldrich, USA) into a solution where 8 mg of KB (EC600JD, AkzoNobel, Netherlands) was dispersed in 60 mL ethylene glycol (EG, Junsei, Japan). EG functions as both a reducing and dispersing agent34. The mixture was dispersed by sonication for 30 min and then refluxed for 2 h at room temperature. Next, the pH of the solution was adjusted to 13 by adding 1 g of sodium hydroxide (NaOH, Aldrich, USA) as a reducing agent. In order to synthesize the Pt3Co-loaded KB with 40 wt% loading, the calculated amount of Pt precursor (K2PtCl4, Aldrich, USA) and Co precursor (Co(NO3)2·6H2O, Aldrich, USA) dispersed in DI water was added into the KB solution and the solution was refluxed at 150°C for 6 h to reduce the both precursors. After the reduction reaction was completed, the solution was filtered by centrifugation at 9000 rpm for 20 min, which was repeated 5 times. The final product was dried in a vacuum oven at 25°C overnight and CTAB-functionalized 40 wt% Pt3Co-loaded KB (Pt3Co/KB) was then obtained. Pt/KB as a control sample was synthesized based on the same procedure but the Co precursor was not added. Pt3Co/CNT was also synthesized based on the same procedure except for replacing KB with CNTs (CNT Co., Ltd., Korea) for catalyst supports. The CTAB-free Pt3Co/KB for TEM analysis was also synthesized as another control sample based on the same procedure but without addition of CTAB. In addition, α-MnO2 was synthesized through a hydrothermal process at 160°C for 12 h starting from an aqueous precursor solution containing 2 M KMnO4 and 3 M MnSO4·H2O as reported previously53.
Li-O2 battery assembly and electrochemical tests
For preparation of the air electrodes, catalysts-loaded KB samples were dispersed uniformly with poly(vinylidene fluoride) (PVDF, Aldrich, USA) binder in a weight ratio of 8:2 in N-methyl-2-pyrrolidone (NMP, Aldrich, USA) and the slurries were then cast onto gas diffusion layers (GDL, TGPH-090 carbon paper, Torray, Japan) serving as current collectors. The carbon loading density of the used carbon paper was 0.6 mgcarbon cm−2. For the KB and α-MnO2/KB electrodes, the electrodes were prepared by the same procedure but the weight ratios were KB/PVDF = 80:20 and KB/α-MnO2/PVDF = 48:32:20, respectively. After the casting, the air electrodes were dried at 70°C for 12 h under vacuum to remove residual solvent.
The electrochemical tests of Li-O2 batteries were carried out using 2032-type coin cells whose top covers have 20 holes with diameters of 1 mm to facilitate sufficient oxygen flow (Supplementary Fig. S23). Each cell was composed of Li foil anode (thickness = 600 μm, Honjo, Japan), the air electrode and a glass fiber membrane (GF/D, Whatman, USA). The electrolyte was prepared by dissolving 1 M LiTFSI (Aldrich, USA) in TEGDME (Aldrich, USA). The Li-O2 batteries were electrochemically tested under CV and galvanostatic modes using a WBCS 3000 battery cycler (WonAtech, Korea). CV was conducted at a scan rate of 0.1 mV s−1 in the range of 2.0 to 4.5 V vs. Li/Li+. The galvanostatic charge/discharge tests were carried out at current densities of 100, 200, 400, 500 and 700 mA g−1carbon. GITT tests were performed at a current density of 20 mA g−1carbon for charging processes. For these tests, a 3 h rest step was given after 2 h of each charging step. Before the charging processes, the samples underwent discharging processes at 200 mA g−1carbon. The cycling performance of rebuilt cell consisted of used Li metal anode after 35 cycles. All of the electrochemical tests were conducted under 1 atm of pure O2 (99.999%) in an oxygen chamber.
Characterization of air cathodes
The morphologies and crystal structures of Pt3Co/KB and Pt3Co/CNT were characterized using field emission TEM (Tecnai FE-TEM, FEI, USA) and FFT pattern, respectively. The elemental analyses and mapping of the samples were conducted using an EDAX. In order to identify the atomic ratio of Pt/Co and the weight portion of the catalyst in Pt3Co/KB, ICP (Spectro, Germany) and thermogravimetric analyses (TGA, Netzsch, Germany) were performed, respectively. During the TGA analyses, the heating rate was 10°C min−1 under an air flow (Supplementary Fig. S24).
For analyses of the air electrodes after cycling, the cells were disassembled in an Ar filled glove box and the air electrodes were washed with acetonitrile (CH3CN, Aldrich, USA) and dried. XRD patterns of Pt3Co/KB at different states of battery cycling and Li metal at different cycle numbers were attained using an X-ray diffractometer (micro XRD, Rigaku, Japan) with Cu Kα (λ = 0.15406 nm). In order to avoid any air and moisture exposure during the XRD characterization, we tightly covered the Li metal with imide tape in a glovebox. Field emission SEM (Sirion FE-SEM, FEI, USA) was employed to investigate the morphologies of Pt3Co/KB at different states of battery cycling. The chemical compositions and bonding characteristics of the air electrodes were analyzed using a high-resolution dispersive Raman microscope (Dispersive-Raman, Horiba Jobin Yvon, France) and Fourier transform infrared spectroscopy (FT-IR, Bruker, USA). The chemical compositions of the air cathodes were analyzed by XPS (Sigma probe, Thermo VG scientific, England) with a Mg Kα line as X-ray source. For all characterizations, the moisture and air contamination were avoided by using airtight box during a sample transfer.
Computational details
First-principles calculations were performed using the DFT with the projector augmented wave pseudopotentials as implemented in the Vienna ab initio simulation package (VASP)54,55. The electron exchange-correlation was treated within the spin-polarized generalized gradient approximation of the Perdew−Burke−Ernzerhof type56. The cutoff energy for the plane wave-basis expansion was chosen to be 400 eV and the atomic relaxation was continued until Helmann−Feynman forces acting on atoms were less than 0.02 eV Å−1. Pt and Pt3Co have the fcc crystal structures and their lattice constants obtained by DFT calculation were 3.97 Å and 3.87 Å, respectively, which are in good agreement with the XRD data (Supplementary Fig. S2). Hexagonal close-packed (hcp) Co was calculated to have lattice constants a = 2.43 Å and c = 3.96 Å. The surfaces of Pt and Pt3Co were all modeled by the thermodynamically most stable (111) facets with (4 × 4) and (2 × 2) surface unit cells, respectively and the surface of hcp crystal Co was modeled by (0001) facet with (2 × 2) surface unit cells. All the surfaces were simulated with the slabs of four atomic layers separated by vacuum of 13 Å and the bottommost layers were fixed to maintain their bulk atomic distances during the structure relaxation. The Brillouin zone was sampled using Γ-centered 3 × 3 × 1 k-point mesh and the electronic states were smeared using the Methfessel−Paxton scheme with a broadening width of 0.1 eV. Adsorption/desorption of LixO2 (x = 1, 2 and 4) clusters on the Pt, Co and Pt3Co alloy surfaces were calculated as the intermediates of ORR and OER processes as addressed in the literature57,58.
The overpotentials (η) of ORR and OER were calculated as ηORR = U0 − UDC and ηOER = UC − U0, where U0, UDC and UC are equilibrium, discharging and charging potentials, respectively. UDC is the highest potential for which discharge is energetically downhill for all steps and UC is the lowest potential where charging is energetically downhill for all steps. Such calculation procedure of η in theory was employed in the literature58.
Pt3Co structure
Experimental and theoretical studies have shown that Pt atoms segregate on the surface of Pt3Co alloy by annealing and this enrichment of Pt is counterbalanced by depletion of Pt in the subsurface layer, resulting in the Co-compensated layer beneath the Pt-rich surface and this structure has been termed ‘Pt-skin’59,60. For Pt3Co(111) surface, we considered the Pt-skin structure, where Pt atoms segregate to the topmost surface layer and the sub-surface layer is enriched by Co atoms and this Pt-skin Pt3Co(111) surface was more stable than the Co-exposed pristine Pt3Co(111) surface with the energy of 0.53 eV per Pt3Co surface unit cell. Top views of the pristine Pt3Co(111) surface and Pt-skin Pt3Co(111) surface are displayed in Supplementary Fig. S21.
References
Bruce, P. G., Freunberger, S. A., Hardwick, L. J. & Tarascon, J.-M. Li-O2 and Li-S batteries with high energy storage. Nat. Mater. 11, 19–29 (2012).
Lee, J.-S. et al. Metal–Air Batteries with High Energy Density: Li–Air versus Zn–Air. Adv. Energy Mater. 1, 34–50 (2011).
Lu, Y.-C. et al. Lithium-oxygen batteries: bridging mechanistic understanding and battery performance. Energy Environ. Sci. 6, 750–768 (2013).
Wei Seh, Z. et al. Sulphur–TiO2 yolk–shell nanoarchitecture with internal void space for long-cycle lithium–sulphur batteries. Nat. Commun. 4, 1331 (2013).
Moon, S. et al. Encapsulated Monoclinic Sulfur for Stable Cycling of Li–S Rechargeable Batteries. Adv. Mater. 25, 6547–6553 (2013).
Su, Y.-S. & Manthiram, A. Lithium–sulphur batteries with a microporous carbon paper as a bifunctional interlayer. Nat. Commun. 3, 1166 (2012).
Hwang, T. H., Jung, D. S., Kim, J.-S., Kim, B. G. & Choi, J. W. One-Dimensional Carbon–Sulfur Composite Fibers for Na–S Rechargeable Batteries Operating at Room Temperature. Nano Lett. 13, 4532–4538 (2013).
Abraham, K. M. & Jiang, Z. A Polymer Electrolyte-Based Rechargeable Lithium/Oxygen Battery. J. Electrochem. Soc. 143, 1–5 (1996).
Wang, H. et al. Rechargeable Li-O2 batteries with a covalently coupled MnCo2O4-graphene hybrid as an oxygen cathode catalyst. Energy Environ. Sci. 5, 7931–7935 (2012).
Peng, Z., Freunberger, S. A., Chen, Y. & Bruce, P. G. A Reversible and Higher-Rate Li-O2 Battery. Science 337, 563–566 (2012).
Jung, H.-G., Hassoun, J., Park, J.-B., Sun, Y.-K. & Scrosati, B. An improved high-performance lithium–air battery. Nat. Chem. 4, 579–585 (2012).
Xu, J.-J. et al. Synthesis of Perovskite-Based Porous La0.75Sr0.25MnO3 Nanotubes as a Highly Efficient Electrocatalyst for Rechargeable Lithium–Oxygen Batteries. Angew. Chem. Int. Ed. 52, 3887–3890 (2013).
Kim, B. G., Lee, J.-N., Lee, D. J., Park, J.-K. & Choi, J. W. Robust Cycling of Li–O2 Batteries through the Synergistic Effect of Blended Electrolytes. ChemSusChem 6, 443–448 (2013).
Zhang, T. & Zhou, H. A reversible long-life lithium–air battery in ambient air. Nat. Commun. 4, 1817 (2013).
Sun, B., Munroe, P. & Wang, G. X. Ruthenium nanocrystals as cathode catalysts for lithium-oxygen batteries with a superior performance. Sci. Rep. 3, 2247; 10.1038/srep02247 (2013).
Chen, J. et al. The role of transition metal interfaces on the electronic transport in lithium–air batteries. Catal. Today 165, 2–9 (2011).
Zhang, T. et al. A novel high energy density rechargeable lithium/air battery. Chem. Commun. 46, 1661–1663 (2010).
Débart, A., Paterson, A. J., Bao, J. & Bruce, P. G. α-MnO2 Nanowires: A Catalyst for the O2 Electrode in Rechargeable Lithium Batteries. Angew. Chem. Int. Ed. 47, 4521–4524 (2008).
Black, R., Lee, J.-H., Adams, B., Mims, C. A. & Nazar, L. F. The Role of Catalysts and Peroxide Oxidation in Lithium–Oxygen Batteries. Angew. Chem. Int. Ed. 52, 392–396 (2013).
Jung, H.-G. et al. Ruthenium-Based Electrocatalysts Supported on Reduced Graphene Oxide for Lithium-Air Batteries. ACS Nano 7, 3532–3539 (2013).
Li, J., Wang, N., Zhao, Y., Ding, Y. & Guan, L. MnO2 nanoflakes coated on multi-walled carbon nanotubes for rechargeable lithium-air batteries. Electrochem. Commun. 13, 698–700 (2011).
Harding, J. R., Lu, Y.-C., Tsukada, Y. & Shao-Horn, Y. Evidence of catalyzed oxidation of Li2O2 for rechargeable Li-air battery applications. Phys. Chem. Chem. Phys. 14, 10540–10546 (2012).
Lu, J. et al. A nanostructured cathode architecture for low charge overpotential in lithium-oxygen batteries. Nat. Commun. 4, 2383 (2013).
Xu, J.-J., Wang, Z.-L., Xu, D., Zhang, L.-L. & Zhang, X.-B. Tailoring deposition and morphology of discharge products towards high-rate and long-life lithium-oxygen batteries. Nat. Commun. 4, 2438 (2013).
Kim, J., Lee, S. W., Carlton, C. & Shao-Horn, Y. Oxygen Reduction Activity of PtxNi1-x Alloy Nanoparticles on Multiwall Carbon Nanotubes. Electrochem. Solid St. 14, B110–B113 (2011).
Su, D., Kim, H.-S., Kim, W.-S. & Wang, G. A study of PtxCoy alloy nanoparticles as cathode catalysts for lithium-air batteries with improved catalytic activity. J. Power Sources 244, 488–493 (2013).
Lu, Y.-C. et al. Platinum−Gold Nanoparticles: A Highly Active Bifunctional Electrocatalyst for Rechargeable Lithium−Air Batteries. J. Am. Chem. Soc. 132, 12170–12171 (2010).
Freunberger, S. A. et al. Reactions in the Rechargeable Lithium–O2 Battery with Alkyl Carbonate Electrolytes. J. Am. Chem. Soc. 133, 8040–8047 (2011).
McCloskey, B. D. et al. On the Efficacy of Electrocatalysis in Nonaqueous Li–O2 Batteries. J. Am. Chem. Soc. 133, 18038–18041 (2011).
Hummelshoj, J. S., Luntz, A. C. & Norskov, J. K. Theoretical evidence for low kinetic overpotentials in Li-O2 electrochemistry. J. Chem. Phys. 138, 034703–034712 (2013).
Oh, S. H., Black, R., Pomerantseva, E., Lee, J.-H. & Nazar, L. F. Synthesis of a metallic mesoporous pyrochlore as a catalyst for lithium–O2 batteries. Nat. Chem. 4, 1004–1010 (2012).
Ottakam Thotiyl, M. M. et al. A stable cathode for the aprotic Li–O2 battery. Nat. Mater. 12, 1050–1056 (2013).
Xia, B. Y., Ng, W. T., Wu, H. B., Wang, X. & Lou, X. W. Self-Supported Interconnected Pt Nanoassemblies as Highly Stable Electrocatalysts for Low-Temperature Fuel Cells. Angew. Chem. Int. Ed. 51, 7213–7216 (2012).
Nam, K.-W. et al. Monodispersed PtCo nanoparticles on hexadecyltrimethylammonium bromide treated graphene as an effective oxygen reduction reaction catalyst for proton exchange membrane fuel cells. Carbon 50, 3739–3747 (2012).
Paulus, U. A. et al. Oxygen Reduction on Carbon-Supported Pt−Ni and Pt−Co Alloy Catalysts. J. Phys. Chem. B 106, 4181–4191 (2002).
Xu, Y., Ruban, A. V. & Mavrikakis, M. Adsorption and Dissociation of O2 on Pt−Co and Pt−Fe Alloys. J. Am. Chem. Soc. 126, 4717–4725 (2004).
Antolini, E. Formation of carbon-supported PtM alloys for low temperature fuel cells: a review. Mater. Chem. Phys. 78, 563–573 (2003).
Freunberger, S. A. et al. The Lithium–Oxygen Battery with Ether-Based Electrolytes. Angew. Chem. Int. Ed. 50, 8609–8613 (2011).
Adams, B. D. et al. Current density dependence of peroxide formation in the Li-O2 battery and its effect on charge. Energy Environ. Sci. 6, 1772–1778 (2013).
Black, R. et al. Screening for Superoxide Reactivity in Li-O2 Batteries: Effect on Li2O2/LiOH Crystallization. J. Am. Chem. Soc. 134, 2902–2905 (2012).
Guo, X. & Zhao, N. The Role of Charge Reactions in Cyclability of Lithium–Oxygen Batteries. Adv. Energy Mater. 3, 1413–1416 (2013).
Mizuno, F. et al. Cathode reaction mechanism of non-aqueous Li–O2 batteries with highly oxygen radical stable electrolyte solvent. J. Power Sources 228, 47–56 (2013).
Lu, Y. et al. In Situ Ambient Pressure X-ray Photoelectron Spectroscopy Studies of Lithium-Oxygen Redox Reactions. Sci. Rep. 2, 715; 10.1038/srep00715 (2012).
McCloskey, B. D. et al. Twin Problems of Interfacial Carbonate Formation in Nonaqueous Li–O2 Batteries. J. Phys. Chem. Lett. 3, 997–1001 (2012).
Ottakam Thotiyl, M. M., Freunberger, S. A., Peng, Z. & Bruce, P. G. The Carbon Electrode in Nonaqueous Li–O2 Cells. J. Am. Chem. Soc. 135, 494–500 (2012).
Zhang, Y. et al. The use of mixed carbon materials with improved oxygen transport in a lithium-air battery. J. Power Sources 240, 390–396 (2013).
Yang, X.-h., He, P. & Xia, Y.-y. Preparation of mesocellular carbon foam and its application for lithium/oxygen battery. Electrochem. Commun. 11, 1127–1130 (2009).
Lim, H.-D. et al. Enhanced Power and Rechargeability of a Li−O2 Battery Based on a Hierarchical-Fibril CNT Electrode. Adv. Mater. 25, 1348–1352 (2013).
Laoire, C. O., Mukerjee, S., Abraham, K. M., Plichta, E. J. & Hendrickson, M. A. Elucidating the Mechanism of Oxygen Reduction for Lithium-Air Battery Applications. J. Phys. Chem. C 113, 20127–20134 (2009).
Lu, Y.-C., Gasteiger, H. A., Crumlin, E., McGuire, R. & Shao-Horn, Y. Electrocatalytic Activity Studies of Select Metal Surfaces and Implications in Li-Air Batteries. J. Electrochem. Soc. 157, A1016–A1025 (2010).
Laoire, C. O., Mukerjee, S., Abraham, K. M., Plichta, E. J. & Hendrickson, M. A. Influence of Nonaqueous Solvents on the Electrochemistry of Oxygen in the Rechargeable Lithium−Air Battery. J. Phys. Chem. C 114, 9178–9186 (2010).
Tang, W., Sanville, E. & Henkelman, G. A grid-based Bader analysis algorithm without lattice bias. J. Phys.: Condens. Mat. 21 (2009).
Wang, X. & Li, Y. Synthesis and Formation Mechanism of Manganese Dioxide Nanowires/Nanorods. Chem. Euro. J. 9, 300–306 (2003).
Kresse, G. & Furthmüller, J. Efficient iterative schemes for ab initio total-energy calculations using a plane-wave basis set. Phys. Rev. B 54, 11169–11186 (1996).
Kresse, G. & Joubert, D. From ultrasoft pseudopotentials to the projector augmented-wave method. Phys. Rev. B 59, 1758–1775 (1999).
Perdew, J. P., Burke, K. & Ernzerhof, M. Generalized Gradient Approximation Made Simple. Phys. Rev. Lett. 77, 3865–3868 (1996).
Xu, Y. & Shelton, W. A. O2 reduction by lithium on Au(111) and Pt(111). J. Chem. Phys. 133, 024703 (2010).
Hummelshoj, J. S. et al. Communications: Elementary oxygen electrode reactions in the aprotic Li-air battery. J. Chem. Phys. 132, 071101 (2010).
Stamenkovic, V. R., Mun, B. S., Mayrhofer, K. J. J., Ross, P. N. & Markovic, N. M. Effect of Surface Composition on Electronic Structure, Stability and Electrocatalytic Properties of Pt-Transition Metal Alloys: Pt-Skin versus Pt-Skeleton Surfaces. J. Am. Chem. Soc. 128, 8813–8819 (2006).
Chen, S. et al. Enhanced Activity for Oxygen Reduction Reaction on “Pt3Co” Nanoparticles: Direct Evidence of Percolated and Sandwich-Segregation Structures. J. Am. Chem. Soc. 130, 13818–13819 (2008).
Acknowledgements
This work was supported by the National Research Foundation of Korea Grant funded by the Korean Government (MEST, NRF-2010-C1AAA001-0029018 and NRF-2010-C1AAA001-0029031). B.G.K. acknowledges NRF-2013-Global PhD Fellowship Program.
Author information
Authors and Affiliations
Contributions
B.G.K. and H.-J.K. contributed equally to this work. B.G.K., K.W.N. and J.W.C. designed the experiments. B.G.K. performed the experiments and collected the data. H.-J.K., S.B., Y.J. and Y.-K.H. performed the DFT calculations. B.G.K., H.-J.K., Y.-K.H. and J.W.C. wrote the manuscript. All authors discussed the results on the manuscript.
Ethics declarations
Competing interests
The authors declare no competing financial interests.
Electronic supplementary material
Supplementary Information
Supplementary Information
Rights and permissions
This work is licensed under a Creative Commons Attribution-NonCommercial-NoDerivs 3.0 Unported License. To view a copy of this license, visit http://creativecommons.org/licenses/by-nc-nd/3.0/
About this article
Cite this article
Kim, B., Kim, HJ., Back, S. et al. Improved reversibility in lithium-oxygen battery: Understanding elementary reactions and surface charge engineering of metal alloy catalyst. Sci Rep 4, 4225 (2014). https://doi.org/10.1038/srep04225
Received:
Accepted:
Published:
DOI: https://doi.org/10.1038/srep04225
This article is cited by
-
α-Fe2O3 Urchins Synthesized by a Facile Hydrothermal Route as an Anode for an Fe-Air Battery
Journal of Materials Engineering and Performance (2020)
-
Multistaged discharge constructing heterostructure with enhanced solid-solution behavior for long-life lithium-oxygen batteries
Nature Communications (2019)
-
Promise and reality of post-lithium-ion batteries with high energy densities
Nature Reviews Materials (2016)
-
Carbon/titanium oxide supported bimetallic platinum/iridium nanocomposites as bifunctional electrocatalysts for lithium-air batteries
Journal of Solid State Electrochemistry (2016)
-
Development of carbon-based cathodes for Li-air batteries: Present and future
Electronic Materials Letters (2016)
Comments
By submitting a comment you agree to abide by our Terms and Community Guidelines. If you find something abusive or that does not comply with our terms or guidelines please flag it as inappropriate.
