
Abstract
Recognition is increasing globally that urban planning interventions to improve neighbourhood liveability enable healthy sustainable lifestyles and assist in the prevention and management of chronic disease. We present the spatial urban liveability index (ULI) as a tool to inform localised interventions that would create healthier, more sustainable cities and examine its associations with cardiometabolic and wellbeing-related health outcomes. The ULI and associated indicators were calculated for Melbourne address points and spatially linked with health outcomes for participants from the 2014 Victorian Population Health Survey. Residing in higher liveability areas was found to be positively associated with a more physically active lifestyle and negatively associated with BMI—more so than for a comparable walkability index. Although walkable neighbourhoods underpin a liveable city, areas with diverse ‘community, culture and leisure’ destinations displayed strongest beneficial associations with cardiometabolic health outcomes, suggesting that access to diverse local destinations may encourage more active sustainable living.
Introduction
Awareness of the relationship between urban liveability and its impact on our health and wellbeing has grown in recent decades1,2,3,4, with recognition of the need for multi-sector interventions including urban planning to foster healthy active lifestyles that prevent and control chronic disease5. Defined through a social determinants of health lens, urban liveability is a multi-dimensional construct which refers to neighbourhoods that are ‘safe, attractive, socially cohesive and inclusive, and environmentally sustainable; with affordable and diverse housing linked by convenient public transport, walking and cycling infrastructure to employment, education, public open space, local shops, health and community services, and leisure and cultural opportunities’6.
A growing body of evidence supports the hypothesis that the development of liveable neighbourhoods will lead to reductions in key modifiable risk factors for cardiometabolic disease, in part, by increasing opportunities for physical activity principally through walking, leading to downstream impacts of reduced population levels of overweight and obesity, high blood pressure and high blood plasma glucose7. A 2016 systematic review of evidence for associations between the built environment and cardiovascular disease outcomes from 18 studies found that neighbourhoods with greater walkability were associated with increased physical activity and lower prevalence of cardiometabolic health risks8. These findings were supported by those of a 2019 systematic review and meta-analysis of 36 longitudinal studies published between 2000 and 20169, which found evidence that walkable, low sprawl urban areas were associated with meaningful improvements in cardiometabolic health; and an earlier 2011 systematic review of evidence of environment characteristics and cardiometabolic risk factors involving 131 studies published between 1985 and 200910 that the second-most consistent finding after a positive relationship between socio-economic deprivation and poor cardiometabolic health was that highly walkable neighbourhoods (high street connectivity, residential density and access to amenities, including parks) were associated with lower risk of obesity.
Aspirations for the creation of liveable cities that encourage healthy active lifestyles as a means of fostering sustainable development have been formulated in white papers, policies and performance frameworks across diverse contexts and levels of government in Australia and internationally11,12,13. Yet, despite increased availability and opportunities of rich open geographical and government data sets that may be used to measure implementation of liveability targets for urban areas4,14,15,16, evidence of the impact of such policy for delivering equitable health and wellbeing outcomes remains nascent17 and mixed18,19,20,21,22. To move beyond aspirations towards the equitable delivery of services and amenities that would create sustainable cities that are supportive of health and wellbeing requires the purposive measurement and analysis of their spatial distribution23.
In our previous study examining associations between a pilot urban liveability index (ULI) and active transportation behaviours in Melbourne, Australia, we found that a one-unit increase in local neighbourhood liveability was associated with estimated increased odds ratios (OR) for walking, cycling or public transport of >10% and a decreased OR for driving of approximately 15%, with adjustment for individual socio-demographic characteristics24. Our findings were in line with a growing body of evidence suggesting that the way we design cities influences behaviours around transportation mode choice and physical activity, with downstream impacts on health and wellbeing25,26,27,28.
Following the development of the pilot ULI, the need for some refinements was noted24: (1) the disaggregation of the walkability and social infrastructure access composite indicators, in order to both make the construction more transparent, and implicitly add more weight to the importance of access to proximate destinations to a well serviced neighbourhood; and (2) omitting the air pollution indicator, due to its positive collinearity with walkability. Although air quality is an important downstream outcome of city planning decisions, it was determined appropriate to be excluded from the ULI as an index of upstream determinants of city planning. This reformulation corresponded to our theoretical liveability framework, which posited a mutually dependent relationship between environmental sustainability and healthy liveable neighbourhoods6.
In this cross-sectional study, we outline the refinement of our spatial ULI as a tool to inform localised urban planning interventions and examine its adjusted associations with cardiometabolic and wellbeing-related health outcomes in an Australian adult sample.
Results and discussion
ULI calculation and linkage
The ULI was calculated for 1,550,641 residential address proxy sample points across the urban portion of Greater Melbourne (Fig. 1). The final ULI-linked analytical data set comprised of 8691 Victorian Population Health Survey 2014 (VPHS) geocoded respondents with complete data on socio-demographic covariates (Supplementary Fig. 1). Sample size for each analysis after restriction to complete outcome data and exclusions is further reported in Supplementary Table 1.
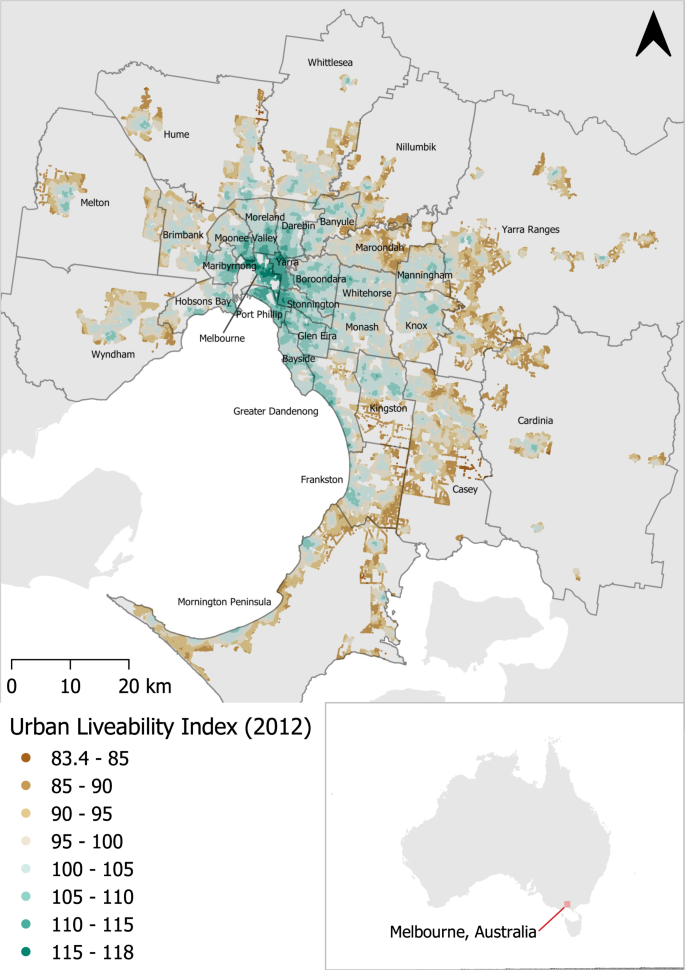
The spatial distribution of the urban liveability index for Melbourne, Australia, with a target time point of 2011–2012 (data sources dated from 2011 to 2014, as per Table 5); local government area and Australian continent boundaries displayed for reference purposes, sourced from the Australian Bureau of Statistics under CC BY 4.0 licence as per the data availability statement.
Participant characteristics
Participant socio-demographic characteristics are summarised in Table 1 and cardiometabolic outcomes of interest in Table 2. Both tables include the associated liveability (ULI) distribution summary for each item. The sample was largely comprised of an older cohort (3.9% aged 18–30 years and 69.9% aged 50+ years), the majority of whom either owned or were purchasing their own home (86.3%); renting was strongly associated with living in more liveable areas, whether privately or through social housing.
While 46.4% of participants reported undertaking ≥10 min of walking for transport and slightly fewer (39.3%) met physical activity requirements by walking, achieving these respective outcomes was strongly associated with living in a more liveable neighbourhood. Most participants (53.4%) had a body mass index (BMI) >25 kg/m2, with 1.5% recording a BMI <18.5 kg/m2. Diagnosis of hypertension was reported in 38.0% of participants, while 8.5% reported a diagnosis of type 2 diabetes mellitus (T2DM). Excellent or very good health status was reported by 41.6% of participants, while 14.4% had Kessler 10 results indicative of psychological distress, and fewer still (6.3%) reported not being satisfied with life as a whole.
Multilevel regression analyses
Fully adjusted models examining the association between the health and wellbeing outcomes of interest with both the ULI and its component indicators are reported in Table 3 (physical activity and health outcomes) and Table 4 (wellbeing outcomes). To facilitate comparison of the ULI with previously used measures, Tables 3 and 4 also include results for the pilot ULI and the walkability index.
Results for each exposure were scaled according to its interquartile range (IQR), as observed in the VPHS sample. For each analysis, this represents the difference in living in an area with high exposure value (e.g. highest quartile of ULI), compared with an area with low exposure value (e.g. lowest ULI quartile). Defined in this way, after adjusting for socio-demographic characteristics and geographic clustering, living in a higher liveability area was associated with increased odds of walking at least 10 min per week for transport between 48% and 78%, increased odds of meeting physical activity requirements by walking between 8% and 25% and having a lower BMI between 0.16 and 0.55 kg/m2. The point estimate for odds of T2DM diagnosis was estimated to be 10% lower in high- compared with low-liveable areas although the broad credible interval (CI) indicated broad uncertainty of magnitude and direction of this effect in the population, consistent with a 21% reduction, up to a 1% increase in odds of diagnosis. There was no clear evidence of adjusted associations between urban liveability and hypertension or the mental wellbeing outcomes of self-rated health, psychological distress and life satisfaction.
Associations between ULI sub-indicators and cardiometabolic outcomes
All ULI component indicators with the exception of housing affordability and living and working in the same area were associated with walking for transport and to a lesser extent achieving recommended levels physical activity. Notably, those who lived in areas with greater local employment were estimated to have 8% increased odds of achieving recommended levels of physical activity through walking (adjusted OR (AOR) 95% CI 1.01, 1.16). Overall, indicators with larger estimated effect sizes for physical activity (ULI; ‘Community, culture and leisure’ access; supermarket access; convenience access; street connectivity) were also associated with larger reductions in BMI, with point estimates ranging from −0.24 kg/m2 (street connectivity) to −0.59 kg/m2 (Community, culture and leisure) per IQR change in exposure. In particular, models employing the ‘Community, culture and leisure access’ indicator often resulted in the best fit and largest estimated effect sizes. This was also the only indicator where the posterior CIs for association with hypertension (AOR 0.89; 95% CI 0.82, 0.97) and T2DM (AOR 0.82; 95% CI 0.71, 0.94) diagnosis were not ambiguous with regard to the direction of estimated association.
To aid visualisation of the spatial distribution of distinct regions across the Melbourne metropolitan region with address points within recommended distance of community, culture and leisure destinations, a further spatial analysis was conducted on these points generating the convex hull of those clustered within 400 m of each other, where the resulting geometry collection consisted of ≥10 points (Fig. 2). Labels were annotated through concatenation of the names of 2011 suburb geometries29 with either a >10% intersection with the convex hull polygon or an absolute area of intersection of at least 3 km2. In contrast to the ULI, for which the highest scoring addresses (scores of ≥110; 42,666 address points or 2.8%) were clustered in the inner city region (Fig. 2), clusters of address points with access to community, culture and leisure destinations all within recommended distance (54,389 address points or 3.5%) were also identified in some middle and outer suburbs. Correlation of sub-indicators with composite measures is further reported in a supplementary correlation analysis (Supplementary Table 2).
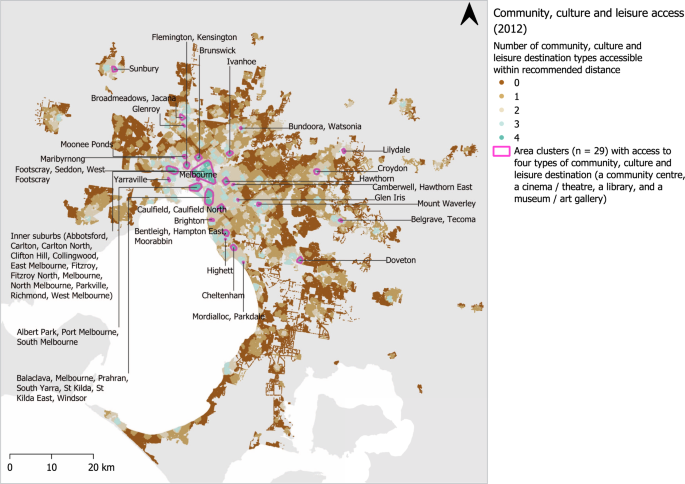
Spatial distribution of community, culture and leisure access, with annotated convex hull clusters of address points with full access to community, culture and leisure destination types within recommended distances. The Australian continental digital boundary for 2011 was sourced from the Australian Bureau of Statistics under CC BY 4.0 licence as per the data availability statement.
Comparison of the ULI with the pilot-ULI
Compared with its pilot version, the ULI was found to have a broader IQR and in turn stronger magnitudes of associations with cardiometabolic outcomes. Unlike the ULI, the pilot ULI was not found to be associated with BMI after adjustment. Nevertheless, the walkability index was associated with lower BMI (AOR −0.29; 95% CI −0.44, −0.12); however, the magnitude per change in IQR was lower than that of the ULI.
Main findings
Residing in higher liveability neighbourhoods was found to be positively associated with undertaking at least 10 min of weekly walking for transport, meeting physical activity recommendations by walking, negatively associated with BMI, and although not statistically significant, lower levels of T2DM diagnosis. Living in more walkable neighbourhoods and those with greater access to local destinations was associated with higher odds of walking and achieving recommended levels of physical activity but no other cardiometabolic risk factor. Living in areas with access to diverse community, culture and leisure destinations was associated with lower odds of diagnosis for both hypertension and T2DM. The associations observed for the ULI were of greater magnitude than for the pilot liveability index and walkability index.
The combined role of community, culture and leisure
Notably, more so than street connectivity, dwelling density or other types of destination, we found that living in a neighbourhood with access to a mix of community, culture and leisure destinations (i.e. a community centre, a cinema or theatre, a library and a museum or art gallery) was uniquely predictive of reduced odds of both hypertension and T2DM, following adjustment for socio-demographic characteristics. The geographic particularity of a residential location with proximal access to each of these distinct amenities may serve as a marker for a vibrant, well-provisioned activity centre offering a broad range of services and amenities supporting local, walkable living; and this requires further investigation.
Liveability and the social determinants of health
Meaningful associations with the ULI or the other spatial indicator exposures considered were not observed for self-rated health, psychological distress or life satisfaction outcomes. However, the observed pattern in associations between the ULI and its constituent indicators is consistent with the theoretical social determinants of health pathways and outcomes. Considered through this framework, it is expected that associations with built environment exposures will be strongest upstream for behavioural and lifestyle factors such as meeting physical activity recommendations, rather than more distal outcomes such as subjective wellbeing, which develop over longer periods with complex pathways; yet, it is broadly accepted that interventions which target behaviours as underlying causes contributing to downstream conditions can improve overall population health and reduce health system burdens30,31.
Generalisability
The findings from this study were based on a spatially representative cohort of adults in Melbourne. The general pattern of the spatial distribution of amenities observed in this study has been observed in other Australian cities4; however, extension of the ULI methods to other contexts should consider applicability to local environmental and social contexts: cultures and customs, climate and topography, histories of built environment development and equity and regional economic integration are important factors to consider when translating liveability32. The goal of absolute or relative ‘liveability’, and the equity of its spatial distribution for a city’s population, is arguably an inherent human response to the challenges of urbanism, which is a global phenomenon; formulas for liveability are not necessarily new or culturally specific. The usage of the term, in a pamphlet comparing London unfavourably with Paris, by John Storer in 1870 presents a definition of liveability resonant with that used in this study 150 years later, with appeal not only to the health impacts of urban form but also the importance of cultural and social life for population wellbeing: ‘When we speak of a city being liveable, we mean that there is in it room and space for all; that the blessings of fresh air and sunlight are accessible to the poor and rich alike; that life is not robbed of all its grace and beauty by everlasting confinement in close alleys, or in noisy damp dark streets; that the atmosphere is unpolluted by smoke; and beyond this we mean a city which wise rulers have adorned, and beautified with noble intellectual works of art; so that the people lifting up their eyes, and beholding what is beautiful and refining, may themselves become beautiful and refined in mind and body, and worthy of the high place man fills upon this planet. A high ideal is indicated by this word liveable, if we use it rightly’33.
The Economist Intelligence Unit measures ‘liveability’ globally as a basis for remuneration of expatriates34. However, the ULI measured in this study reflects the aspirations for liveability for all of a city’s residents, shared by communities, stakeholders and researchers from diverse contexts32,35,36,37. It is noted that if approached uncritically, and without an equity perspective, the application of liveability in policy may at times be fraught18,19. Our ULI method provides a flexible framework for calculating the spatial distribution of liveability for distinct residential address points across a study region, allowing for identification of local inequities with high precision, or, as in this study, for linkage with geocoded health survey data to investigate implications of variation in local liveability for cardiometabolic health and wellbeing. Critical application of this method in diverse contexts with adaptations aligns with comparative urbanism, which respects difference and variation38. A universally applicable definition of liveability allowing for generalised statements on sustainable health outcomes across diverse contexts is perhaps apocryphal; however, adaptation of the ULI method to local contexts can support both within-city and between-city comparisons, as long as the variations and contingencies in these contexts are acknowledged.
Study design
The impact of local neighbourhood urban liveability on downstream health outcomes such as hypertension and T2DM may not be immediate but instead may involve sustained exposure to more or less ‘liveable’ built environments across an individual’s life course22,39. The present cross-sectional study did not account for participants’ residential histories; however, a meta-analysis of longitudinal studies by Chandrabose et al., mostly conducted in urban settings in developed countries, concluded that there is strong evidence that more walkable environments are associated with improved hypertension—and T2DM—related outcomes9. Walkable neighbourhoods underpin a liveable city, providing opportunities for healthy sustainable lifestyles40. However, liveable communities offer more than simply being walkable. The ULI incorporates access to a wide range of destinations and was more strongly associated with walking behaviour than the walkability index alone. Assuming there is a unidimensional property, i.e. a single factor of liveability, then ULI and walkability can both be seen as imperfect measures of this quantity. They are strongly correlated with one another and both predict walking behaviour in this cross-sectional study. If ULI’s improved performance can indeed be attributed to being a more precise measure of liveability, then it shall also perform better in longitudinal studies. Such studies have higher power to detect effects on downstream cardiometabolic outcomes (hypertension, T2DM) as the preventative effect of healthy lifestyles improves with sustained activity over multiple years. Due to their correlation, walkability and ULI are both susceptible to the same sources of confounding, but the magnitude of such biases need not be identical in this study. Natural experiments are particularly suitable to overcome bias and changes in at least one ULI component are, by definition, at least as likely as changes in walkability. This provides more opportunities for research. The key contribution of our study has been the development of an enhanced address-level built environment exposure variable associated with healthy, sustainable lifestyles.
Temporality
Both the ULI and its pilot predecessor were constructed using spatial data sources targeting 2012. However, the VPHS survey was conducted between 2012 and 2014. While the temporal sequence of ‘exposure precedes outcome’ may be assumed to be broadly correct, given that ‘real-world’ features will have pre-dated their representation in data, some degree of information bias arising from mismatch of data sources to some participants’ responses is acknowledged. It was not possible to acquire all data sources at perfectly coincident time points. Despite best efforts towards achieving data contemporaneity, it is understood that the time when a data representation of a location could be considered ‘true’ may have expired by the time the data were published or retrieved by us. It is also possible that some participants moved into an area after spatial data recorded for that area had become obsolete, and thus their lived experience of a neighbourhood may differ from that which we have estimated. While we note this limitation, it is assumed that such instances would be either random, meaning that associations observed are likely to have been somewhat attenuated41, or specifically impacting urban fringe areas with more dynamic development. Overall, given the large sample size and variety of data sources considered, the impact on any location or individual from potential mismatch is considered limited.
Liveability and individual activity space
The ULI has been constructed using the walkable area surrounding individual residences. However, there is an emerging body of research that considers the health impacts on individuals of their broader activity space exposures, with consideration beyond the residential neighbourhood and home life, to also encompass work and recreation locations that may be more important at different life stages42. Future research needs to consider the expansion of the spatial ULI to encompass individuals’ broader activity spaces43.
Quality of amenities
A number of the indicators included in the ULI measure access within a walkable distance to an amenity; however, the quality of that amenity—beyond proximity, or size in the case of public open space—was not considered due to data limitations. The consideration of quality is an added complexity, which in principle could be further accommodated in the ULI by calculating indicators using data sources with additional covariates. For example, our public transport indicators measure proximity to public transport stops, which is one dimension of transport service known to influence walking behaviour44. However, other dimensions of public transport service not considered in the present study include: frequency of service; accessibility with regard to individual abilities or overcrowding; and overall utility given cost, comfort and travel time for getting to a specific destination of interest. Not accounting for these dimensions may impact the estimation of effect sizes and the attribution of effects to different components of the built environment. The advent of broadly available General Transit Feed Specification data (in 2015, for Melbourne) means that some of these aspects of public transport may be more readily measurable for major urban centres at the time of writing than was the case in 201445. Future studies should aim to make use of quality measures to more deeply understand associations between liveability and health and wellbeing.
Future directions for urban liveability research to inform urban planning interventions
Through linkage of a spatial ULI with a population health survey, we found that more liveable areas were associated with increased walking for transport behaviour and physical activity levels achieved through walking, and lower BMI. Creating more liveable cities therefore has the potential to foster both health and sustainable lifestyles. The ULI displayed stronger health-beneficial associations than a previous pilot version, and the walkability index is commonly used in built environment and active transport studies. Examination of the index sub-components found that access to a mix of community, culture and leisure destinations (treated as an individual indicator within the ULI) was most strongly associated with cardiometabolic outcomes, including reduced diagnoses of hypertension and T2DM. This may be because these types of destination may be a marker for established activity centres. This requires further investigation in future studies. Given global interest in urban liveability in policy and public discourse, these results highlight the utility of the ULI as a tool to inform localised urban planning interventions that would create healthier more sustainable cities.
Methods
Urban liveability index
Detailed methods for the construction of the ULI are published elsewhere24; however, the present paper refines the selection of indicators incorporated in the composite indicator. The ULI was calculated for address points within the urban portion of the 2011 statistical division for Melbourne46: a coastal Australian port city developed through the nineteenth to twenty-first centuries with temperate climate, rapid population growth and sprawling growth extending from relatively flat, moderately dense and well-serviced inner suburbs to peri-urban rural and bush fringe areas challenged with a lack of amenities, local employment opportunities and transport infrastructure47,48.
Spatial data resources including the road network49, address points50, destinations, administrative areas and area linkage data sets as required (see Table 5) were collated up to a 10 km expanse beyond the study region boundary to ensure appropriate measurement of built environment exposures on the urban fringe. Liveability measurement was undertaken for address points in small area census regions (Mesh Blocks) with positive dwelling count in the 2011 census51, reflecting residential exposure potential. Local neighbourhood liveability indicators were calculated for each residential address. Where area-level measures were more appropriate than address level, or finer grained data were otherwise not available, administrative area statistics were associated with address points via geographical linkage. The revised ULI formulation presented here includes 15 indicators across 8 broad domains, detailed in Table 5.
Access to point of interest locations
Point of interest destination accessibility indicators were evaluated according to destination types: community, culture and leisure; education; health and social services; sport and recreation services; early years services; fresh food outlets; convenience amenities; public transport (bus, tram and train; evaluated separately). Access to destinations along the pedestrian road network for each address point was evaluated against destination-specific access thresholds (see Table 6). A score out of 1 for access for each indicator was calculated using soft thresholds24. The soft threshold method yielded a continuous rather than binary score for access such that greater proximity was rewarded while arbitrarily greater distance from the target threshold only lead to a commensurately arbitrary penalty; i.e. access to a destination at exactly the threshold value yields a score of 0.5, with more proximal access scoring higher, and access at greater than double the threshold distance approaching a score of zero. Equal weighting was awarded to each component destination (e.g. access to 3–5 health destinations corresponded to a score of 0.6 out of a possible maximum of 1 for that social infrastructure subdomain).
Access to public open space
The general approach for evaluating access to large public open space was as per that used to determine destination access, described above. However, in lieu of a single point for each public open space, pseudo-access points were generated along public open space polygon boundaries at 20 m intervals52.
Local walkable neighbourhood characteristics
The local walkable neighbourhood for each address point was measured as the 1600 m extent along pedestrian traversable network segments52, buffered by 50 m53. The resulting area was used as a denominator in local intersection and dwelling density calculations. Intersection density, or street connectivity, was calculated as the number of cleaned pedestrian network intersections intersecting the local walkable network buffer, divided by its area in square kilometres54. Local neighbourhood dwelling density was calculated as the sum of dwellings within Mesh Blocks intersecting the local walkable network buffer, divided by its area in hectares.
Area-level measures
Housing affordability stress was first defined as the proportion of low-income households (in the bottom 40% of the Australian income distribution) spending >30% of their income on housing costs. This measure was reverse scaled for inclusion in the ULI composite measure, representing housing affordability as the proportion of low-income households not spending in excess of 30% of household income on housing. The percentage of employed persons working in the same Statistical Area 3 (broader catchment, SA3) as the local area (Statistical Area 2; SA2) in which they live was also evaluated.
Composite indicator construction
Indicator estimates for each address were conditionally cleaned through constraining the range of indicators with outlying values in excess of 3 standard deviations of the indicator mean through scaling to terminate within 3 standard deviations of the mean; these cleaned indicator estimates were normalised to a common scale with mean of 100 and standard deviation of 10, as per the previously published methods24. With the cleaned, normalised value z of indicator j at address i referred to as \(z_{ij}\) and following the Mazziota–Pareto Index method55, the average of each address point’s set of normalised indicator results \(\bar z_i\)—Eq. (1)—, less their standard deviation—Eq. (2)—squared standardised by the mean \(s_{z_i}^2/\bar z_i\) (coefficient of variation) as a penalty for inconsistent performance, results in the ULI estimate for that address point—Eq. (3). Thus, the final ULI score implicitly rewards balance across the set of indicators considered.
Spatial distribution maps were prepared using QGIS 3.1656. The spatial distribution of the composite indicator was mapped for Melbourne residential address points (Fig. 1).
Survey data
Data from the VPHS, a cross-sectional survey concerned with health and wellbeing outcomes for 33,654 Victorians aged ≥18 years57 were obtained (Victorian DHHS HREC ethics approval number 23/16). The survey was undertaken with informed consent and included questions related to physical activity, active transport usage, obesity and chronic diseases, general health, mental health and community satisfaction and was conducted using computer-assisted telephone interviews across the state of Victoria57. Approximately 426 participants were included from each local government area (LGA), following selection using random digit dialling. Study participants were asked to provide either their residential address or the nearest intersection to their address between two roads. Where responses were provided and of sufficient quality to be usable, these locations were geocoded. Built environment indicators and ULI scores calculated for address points across the greater Melbourne region using spatial data from 2011 to 2014 were able to be linked to 11,067 geocoded participants’ survey data based on match to closest residential address point, with a median match distance of 0.1 m [IQR 0.0, 18.9]. A participant flow diagram is presented in Supplementary Fig. 1. A completed STROBE reporting checklist has also been included as Supplementary Note 158.
Statistical analyses
Multilevel modelling of cardiometabolic and health-related outcomes with regard to liveability was undertaken using linear and logistic models fitted using the R package rstanarm and ordered logistic regression using the R package brms59,60,61. Both packages provide an interface for Bayesian analysis using weakly informative priors. Eight outcomes of interest were considered under the themes: physical activity by walking, cardiometabolic risk factors, major chronic disease, and overall health and wellbeing. Details on the eight analyses adjusting for socio-demographic covariates (age group, sex, employment status, education, income, household type, housing tenure) and LGA-level clustering are provided in Table 6. Results are reported as either AORs (logistic models) or beta-coefficients (β; linear models) for unit change in the outcome variable, with 95% CIs for estimates of the true effect size.
To further investigate the relationships between liveability and physical activity and body size, and the potential associations with metabolic outcomes, we fitted models for each sub-indicator separately. For comparison with existing measures in the literature, models were also fitted for the walkability index and the pilot ULI24. To facilitate comparison of effect size estimates across the range of exposures and corresponding units of analysis considered, the results for each exposure were scaled according to the respective distances of their IQR as observed in the VPHS sample. This value—the difference between the 75th percentile and the 25th percentile—represents a meaningful estimate of variability that does not rely on distributional assumptions. This approach is akin to considering for each exposure what the impact of a ‘high’ result would be relative to a ‘low’ one in terms realistic to their spatial distribution for the sample.
Post hoc, correlations with the community, culture and leisure access score were calculated, and cluster analysis of address points with the indicator was performed to explore differences in spatial distribution to the ULI.
Data availability
A CSV file containing the ULI and component indicators with both raw and cleaned, normalised values as well as coordinates and area linkage codes with an accompanying data dictionary is hosted on FigShare under CC BY-NC-SA 4.0 terms at https://doi.org/10.25439/rmt.13322984. The source data that support the calculation of the ULI for Greater Melbourne in 2012 are available from the sources cited in the ‘Methods’ section; however, some were used under license for the current study or are historical data sets and so are not publicly available. Source data are, however, available from the authors upon request and with permission of custodians. The Victorian Public Health Survey data that support the findings of this study are available from the Victorian Department of Health and Human Services pending ethics approval. Data sourced under CC BY 4.0 licence from the Australian Bureau of Statistics included. the Australian Statistical Geography Standard (ASGS): Volume 1—Main Structure and Greater Capital City Statistical Areas, July 2011 (https://www.abs.gov.au/AUSSTATS/abs@.nsf/DetailsPage/1270.0.55.001July%202011); Australian Statistical Geography Standard (ASGS): Volume 4—Significant Urban Areas, Urban Centres and Localities, Section of State (https://www.abs.gov.au/AUSSTATS/abs@.nsf/DetailsPage/1270.0.55.004July%202011); 2011 Census of Population and Housing: Mesh Block Counts (https://www.abs.gov.au/AUSSTATS/abs@.nsf/DetailsPage/2074.02011); Other ABS data were acquired from custom data reports or constructed using ABS Table Builder, as indicated in Table 5. Historical archives of the Geocoded National Address File (G-NAF) are available under CC BY 3.0 terms from (https://data.gov.au/dataset/ds-dga-e1a365fc-52f5-4798-8f0c-ed1d33d43b6d). Victorian Government data sets used under CC BY 4.0 terms included VicMap Features of Interest (https://discover.data.vic.gov.au/dataset/foi-point-vicmap-features-of-interest), the VicMap transport data set (https://discover.data.vic.gov.au/dataset/vicmap-transport-scale-various) and the Victorian Environmental Assessment Council (VEAC) Metropolitan Melbourne Open Space Inventory (https://discover.data.vic.gov.au/dataset/veac-metropolitan-melbourne-open-space-inventory).
Code availability
Code used for calculation of the ULI is available at https://doi.org/10.25439/rmt.14956209. Code used for analysis of the VPHS data set is available at https://bitbucket.org/Koen_Simons/liveability_vphs/.
References
Pacione, M. The use of objective and subjective measures of life quality in human geography. Prog. Hum. Geogr. 6, 495–514 (1982).
UNDP. Human Development Report 1990: Concept and Measurement of Human Development. http://www.hdr.undp.org/en/reports/global/hdr1990 (1990).
Ruth, M. & Franklin, R. S. Livability for all? Conceptual limits and practical implications. Appl. Geogr. 49, 18–23 (2014).
Arundel, J. et al. Creating liveable cities in Australia: Mapping urban policy implementation and evidence-based national liveability indicators. https://apo.org.au/node/113921 (2017).
United Nations. Resolution adopted by the General Assembly: political declaration of the high-level Meeting of the General Assembly on the Prevention and Control of Non-communicable Diseases A/RES/66/2. https://digitallibrary.un.org/record/720106 (2012).
Lowe, M. et al. Liveable, healthy, sustainable: what are the key indicators for Melbourne neighbourhoods? Research Paper 1. https://socialequity.unimelb.edu.au/__data/assets/pdf_file/0006/1979574/Liveability-Indicators-report.pdf (2013).
Giles-Corti, B. et al. City planning and population health: a global challenge. Lancet 388, 2912–2924 (2016).
Malambo, P., Kengne, A. P., De Villiers, A., Lambert, E. V. & Puoane, T. Built environment, selected risk factors and major cardiovascular disease outcomes: a systematic review. PLoS ONE 11, e0166846 (2016).
Chandrabose, M. et al. Built environment and cardio-metabolic health: systematic review and meta-analysis of longitudinal studies. Obes. Rev. 20, 41–54 (2019).
Leal, C. & Chaix, B. The influence of geographic life environments on cardiometabolic risk factors: a systematic review, a methodological assessment and a research agenda. Obes. Rev. 12, 217–230 (2011).
Australian Government. Smart cities plan: National Cities Performance Framework. Final report. https://www.infrastructure.gov.au/cities/national-cities-performance-framework/files/National_Cities_Performance_Framework_Final_Report.pdf (2017).
World Health Organization & UN Habitat. Global report on urban health: equitable healthier cities for sustainable development. https://apps.who.int/iris/handle/10665/204715 (2016).
State of Victoria DELWP. 20-Minute neighbourhoods: creating a more liveable Melbourne. https://www.planmelbourne.vic.gov.au/__data/assets/pdf_file/0018/515241/Creating-a-more-liveable-Melbourne.pdf (2019).
Prasad, A., Gray, C. B., Ross, A. & Kano, M. Metrics in urban health: current developments and future prospects. Annu. Rev. Public Health 37, 113–133 (2016).
Johnson, I. L. et al. Not at home on the range: peer production and the urban/rural divide. Proc. CHI Conf. Hum. Factor Comput. Syst. 13–25 (2016).
Huston, P., Edge, V. L. & Bernier, E. Reaping the benefits of Open Data in public health. Can. Commun. Dis. Rep. 45, 252–256 (2019).
Giles-Corti, B. et al. City planning and population health: a global challenge. Lancet 388, 2912–2924 (2016).
McGreevy, M. et al. Can health and health equity be advanced by urban planning strategies designed to advance global competitiveness? Lessons from two Australian case studies. Soc. Sci. Med. 242, 112594 (2019).
Badland, H. & Pearce, J. Liveable for whom? Prospects of urban liveability to address health inequities. Soc. Sci. Med. 232, 94–105 (2019).
Lowe, M. et al. Liveability aspirations and realities: implementation of urban policies designed to create healthy cities in Australia. Soc. Sci. Med. 245, 112713 (2020).
Hooper, P., Giles-Corti, B. & Knuiman, M. Evaluating the implementation and active living impacts of a state government planning policy designed to create walkable neighborhoods in Perth, Western Australia. Am. J. Health Promot. 28, S5–S18 (2014).
Durand, C. P., Andalib, M., Dunton, G. F., Wolch, J. & Pentz, M. A. A systematic review of built environment factors related to physical activity and obesity risk: implications for smart growth urban planning. Obes. Rev. 12, e173–e182 (2011).
WHO & UN HABITAT. Hidden cities: unmasking and overcoming health inequities in urban settings. https://apps.who.int/iris/handle/10665/44439 (2010).
Higgs, C., Badland, H., Simons, K., Knibbs, L. D. & Giles-Corti, B. The Urban Liveability Index: developing a policy-relevant urban liveability composite measure and evaluating associations with transport mode choice. Int. J. Health Geogr. 18, 14 (2019).
Sallis, J. F. et al. Use of science to guide city planning policy and practice: how to achieve healthy and sustainable future cities. Lancet 388, 2936–2947 (2016).
Frank, L., Andresen, M. & Schmid, T. Obesity relationships with community design, physical activity, and time spent in cars. Am. J. Prev. Med. 27, 87–96 (2004).
Hankey, S., Marshall Julian, D. & Brauer, M. Health impacts of the built environment: within-urban variability in physical inactivity, air pollution, and ischemic heart disease mortality. Environ. Health Perspect. 120, 247–253 (2012).
Bird, E. L. et al. Built and natural environment planning principles for promoting health: an umbrella review. BMC Public Health 18, 930 (2018).
ABS. Australian Statistical Geography Standard (ASGS): Volume 3 - Non ABS Structures, July 2011. https://www.abs.gov.au/AUSSTATS/abs@.nsf/DetailsPage/1270.0.55.003July%202011?OpenDocument (2011).
Blas, E., Sivasankara Kurup, A. & World Health Organization. Equity, social determinants and public health programmes. https://apps.who.int/iris/handle/10665/44289 (2010).
Williams, D. R., Costa, M. V., Odunlami, A. O. & Mohammed, S. A. Moving upstream: how interventions that address the social determinants of health can improve health and reduce disparities. J. Public Health Manag. Pract. 14, S8–S17 (2008).
Alderton, A. et al. What is the meaning of urban liveability for a city in a low-to-middle-income country? Contextualising liveability for Bangkok, Thailand. Globalization Health 15, 51 (2019).
Storer, J. Our cities: their present position and requirements. 19th Century British Pamphlets. www.jstor.org/stable/60249334 (1870).
The Economist. Liveability ranking: Melbourne Storm. https://web.archive.org/web/20200828122153if_/https://www.economist.com/gulliver/2011/08/30/melbourne-storm (2011).
Salve, S. et al. In Beyond Interactions. INTERACT 2019. Lecture Notes in Computer Science, Vol. 11930 (eds. Abdelnour Nocera, J. et al.) 44–51 (Springer, 2020).
Tan, K. G. & Kaur, S. Measuring Abu Dhabi’s liveability using the global liveable city index (GLCI). World Rev. Sci. Technol. Sustain. Dev. 13, 205–223 (2016).
Antognelli, S. & Vizzari, M. Landscape liveability spatial assessment integrating ecosystem and urban services with their perceived importance by stakeholders. Ecol. Indic. 72, 703–725 (2017).
Robinson, J. Comparative urbanism: new geographies and cultures of theorizing the urban. Int. J. Urban Reg. Res. 40, 187–199 (2016).
Booth, F. W., Roberts, C. K., Thyfault, J. P., Ruegsegger, G. N. & Toedebusch, R. G. Role of inactivity in chronic diseases: evolutionary insight and pathophysiological mechanisms. Physiol. Rev. 97, 1351–1402 (2017).
Hooper, P., Knuiman, M., Foster, S. & Giles-Corti, B. The building blocks of a ‘liveable neighbourhood’: identifying the key performance indicators for walking of an operational planning policy in Perth, Western Australia. Health Place 36, 173–183 (2015).
Grimes, D. A. & Schulz, K. F. Bias and causal associations in observational research. Lancet 359, 248–252 (2002).
Howell, N. A., Farber, S., Widener, M. J. & Booth, G. L. Residential or activity space walkability: what drives transportation physical activity? J. Transp. Health 7, 160–171 (2017).
Ivory, V. C. et al. What shape is your neighbourhood? Investigating the micro geographies of physical activity. Soc. Sci. Med. 133, 313–321 (2015).
Rissel, C., Curac, N., Greenaway, M. & Bauman, A. Physical activity associated with public transport use−a review and modelling of potential benefits. Int. J. Environ. Res. Public Health 9, 2454–2478 (2012).
MobilityData IO. OpenMobilityData. https://openmobilitydata.org/ (2020).
ABS. 1270.0.55.001 - Australian Statistical Geography Standard (ASGS): Volume 1 - Main Structure and Greater Capital City Statistical Areas, July 2011. https://www.abs.gov.au/AUSSTATS/abs@.nsf/DetailsPage/1270.0.55.001July%202011 (2015).
Foster, H., Towers, B., Whittaker, J., Handmer, J. & Lowe, T. Peri-urban Melbourne in 2021: changes and implications for the Victorian emergency management sector. Aust. J. Emerg. Manag. 28, 6–11 (2013).
State of Victoria DELWP. Plan Melbourne 2017-2050: metropolitan planning strategy. https://www.planmelbourne.vic.gov.au/__data/assets/pdf_file/0007/377206/Plan_Melbourne_2017-2050_Strategy_.pdf (2017).
PSMA Australia Limited. Transport and Topography (Callpoint Spatial Pty Ltd, 2012).
PSMA Australia Limited. G-NAF: the Geocoded National Address File (Callpoint Spatial Pty Ltd, 2012).
ABS. 2074.0 - Census of Population and Housing: Mesh Block Counts, 2011. https://www.abs.gov.au/AUSSTATS/abs@.nsf/DetailsPage/2074.02011 (2012).
Mavoa, S. et al. Area-level disparities of public open space: a geographic information systems analysis in metropolitan Melbourne. Urban Pol. Res. 33, 306–323 (2015).
Forsyth, A., Van Riper, D., Larson, N., Wall, M. & Neumark-Sztainer, D. Creating a replicable, valid cross-platform buffering technique: the sausage network buffer for measuring food and physical activity built environments. Int. J. Health Geogr. 11, 14 (2012).
Villanueva, K. et al. The impact of neighborhood walkability on walking: does it differ across adult life stage and does neighborhood buffer size matter? Health Place 25, 43–46 (2014).
Mazziotta, M. & Pareto, A. On a generalized non-compensatory composite index for measuring socio-economic phenomena. Soc. Indic. Res. 127, 983–1003 (2016).
QGIS Development Team. QGIS Geographic Information System (QGIS Version 3.16). https://qgis.org/ (2021).
Victorian DHHS. Victorian Population Health Survey 2014: modifiable risk factors contributing to chronic disease in Victoria. https://www2.health.vic.gov.au/Api/downloadmedia/%7B9CDE5BE1-7EC1-4B7B-818E-EEBC221BF69C%7D (2016).
Elm, E. V. et al. Strengthening the reporting of observational studies in epidemiology (STROBE) statement: guidelines for reporting observational studies. BMJ 335, 806–808 (2007).
Goodrich, B., Gabry, J., Ali, I. & Brilleman, S. rstanarm: Bayesian applied regression modeling via Stan v. R package version 2.19.2. https://mc-stan.org/rstanarm (2019).
Bürkner, P.-C. brms: An R package for Bayesian multilevel models using Stan. J. Stat. Softw. 80, 28 (2017).
R Development Core Team. R: A Language and Environment for Statistical Computing. Version 3.3.2 (R Foundation for Statistical Computing, 2016).
Acknowledgements
This project was funded by the NHMRC Centre of Research Excellence in Healthy Liveable Communities (#1061404) and RMIT University (Healthy Liveable Cities Group, 2017–2020). H.B. is in part supported by an RMIT University Vice Chancellor’s Senior Research Fellowship; and B.G.-C. an NHMRC Senior Principal Research Fellowship (#1107672).
Author information
Authors and Affiliations
Contributions
All authors contributed to project planning and manuscript authoring and approved of the manuscript prior to submission. C.H. designed and implemented code for calculation of the spatial built environment exposure measures and linked these with geocoded survey participant health outcome records; prepared all figures, tables and basic analyses of the urban liveability index and led the manuscript authoring. K.S. contributed to programming, undertook statistical analyses of health outcomes and led the reporting on these. H.B. and B.G.-C. conceived of the project, arranged its funding and provided mentorship throughout the course of the project.
Corresponding author
Ethics declarations
Competing interests
The authors declare no competing interests.
Additional information
Publisher’s note Springer Nature remains neutral with regard to jurisdictional claims in published maps and institutional affiliations.
Supplementary information
Rights and permissions
Open Access This article is licensed under a Creative Commons Attribution 4.0 International License, which permits use, sharing, adaptation, distribution and reproduction in any medium or format, as long as you give appropriate credit to the original author(s) and the source, provide a link to the Creative Commons license, and indicate if changes were made. The images or other third party material in this article are included in the article’s Creative Commons license, unless indicated otherwise in a credit line to the material. If material is not included in the article’s Creative Commons license and your intended use is not permitted by statutory regulation or exceeds the permitted use, you will need to obtain permission directly from the copyright holder. To view a copy of this license, visit http://creativecommons.org/licenses/by/4.0/.
About this article

Cite this article
Higgs, C., Simons, K., Badland, H. et al. Cross-sectional evidence of the cardiometabolic health benefits of urban liveability in Australia. npj Urban Sustain 1, 37 (2021). https://doi.org/10.1038/s42949-021-00039-5
Received:
Accepted:
Published:
DOI: https://doi.org/10.1038/s42949-021-00039-5
