
Abstract
The research on driving mechanisms of urban land expansion is hot topic of land science. However, the relative importance of anthropogenic-natural factors and how they affect urban land expansion change are still unclear. Based on the Google Earth Engine platform, this study used the support vector machine classifier to extract land-use datasets of Mentougou district of Beijing, China from 1990 to 2016. Supported by machine-learning approaches, multiple linear regression (MLR) and random forests (RF) were applied and compared to identify the influential factors and their relative importance on urban land expansion. The results show: There was a continuous growth in urban land expansion from 1990 to 2016, the increased area reached 6097.42 ha with an average annual rate of 8.01% and average annual intensity rate of 2.57%, respectively. Factors such as elevation, risk of goaf collapse, accessibility, local fiscal expenditure, industrial restructuring, per capita income in rural area, GDP were important drivers of urban land expansion change. The model comparison indicated that RF had greater ability than MLR to identify the non-linear relationships between urban land expansion and explanatory variables. The influencing factors of urban land expansion should be comprehensively considered to regulate new land policy actions in Mentougou.
Introduction
Land use/cover change (LUCC) has become the focus of land science research1. As an important component of LUCC, urban land expansion plays a vital role in the regional ecological environment and economic development2. As the largest developing country in the world, China has experienced rapid urban land expansion since the implementation of reform and opening-up in 1978. However, the loss of natural vegetation3, farmland4, as well as environmental pollution5 and other problems are increasingly prominent in response to urban sprawl6. Thus, in order to reduce the negative impact of urban land expansion on the social environment, there is a great need to clarify the driving mechanisms of urban land expansion7.
In the past decades, scholars have intensively investigated urban land expansion, which is mainly focused on the following aspects: (i) the characteristics of urban land expansion and spatial distribution trend of urban land expansion and (ii) analysis drivers of urban land expansion8,9. In the first research area, previous studies generally used urban land expansion density2, urban land expansion intensity10, gravity center migration11 and Gini coefficient7 to evaluate urban land expansion change.
For the second research focus, urban land change is a complicated process that involves the spatial and temporal of various natural and socio-economic factors, therefore, the driving factors often have strong regional and spatial heterogeneity. Wu et al.12 found that urban land expansion was closely related to transportation accessibility. Thus, distance to roads, distance to city center and distance to rivers had been used as variables in some studies of urban land expansion13,14. Slavati15 indicated that the effect of neighborhood and increased population density drove the urban land expansion in many Chinese cities. Other factors such as topography and geological conditions were found to be meaningful drivers of urban land expansion6,16, with flatter, lower elevation and shadier areas being more prone to development as construction land17, especially in areas where mineral resources have been exploited for a long time, the geological environment is poor, such as goaf collapse area and surface subsidence18. The land unit is probably to convert into urban land if it is surrounded by more urban land, thus, neighborhood factors are considered as the main factors affecting urban land expansion in many studies19,20. Land market factors have also been linked to urban land expansion in many areas. Specifically, construction land utilization efficiency21, per capita GDP19 and population urbanization rate22 have positive effects on urban land expansion, such as urban redevelopment and road network expansion23. Additionally, with the increased proportion of urban population, managers and citizens are accelerating the pace of urbanization24. Relevant government drivers, such as industrial restructuring and local fiscal expenditure23, can greatly affect urban land expansion. Methodologically, the structure equation models16,24, regression analyses25,26 and statistical analyses6 were generally used to explore the relationship between urban land expansion and its drivers, and further investigated the driving mechanism of urban land expansion. Although extensive research on urban land expansion analyses, the complexity of relative importance of influential factors and how they affect urban land expansion are still unclear. Traditional statistical models of urban land also have their limitations. These models generally utilize correlation and regression coefficients to assess variable importance. The results may be affected by the cross-correlated variables, which may lead to inadequate and misleading results27. Further, the monitoring of land cover datasets is traditionally obtained through field measurement28, geographic information system19 and remote sensing29, the pre-processing of these datasets is complex, making it difficult to continuously monitor and update land-use data for a long time. Therefore, it is necessary to improve the methods of traditional long-term land use datasets processing in some effective ways.
To solve these issues mentioned above, the study investigated the relative importance by considering the relationships between natural and human factors for urban land expansion. More specifically, the objective of this study is to reveal the dynamic evolution of urban land expansion in Mentougou over the past 26 years, as well as the basic processes and identify the ranking of the main driving factors of urban land expansion. For this purpose, supported by the Google Earth Engine (GEE) platform and machine-learning approach, our study selected the long-term series remote sensing images, and used Support Vector Machine (SVM) classifier to extract land use datasets, both multiple linear regression (MLR) and random forest (RF) models were used to evaluate the potential contribution of topographical, geological, accessibility, neighborhood, land market and government action factors to urban land expansion in Mentougou district of Beijing, China. Each approach was applied to the land use data and the results of the two models were analyzed and compared. Furthermore, the driving factors and their importance to urban land expansion were revealed.
Materials and methods
Study area
Mentougou district is located in the west of Beijing City, China (39°48′–40°10′ N and 115°25′–116°10′E) and covers an area of 144 892 km2, of which mountainous area constitutes about 98.5% (Fig. 1). It is characterized by complex surface geological conditions, undulate topography, and is rich in vegetation resources and belongs to the deciduous broad-leaved forest type area. Historically, there were a lot of mineral resources, which were the main economic income of local industries. However, as it was recognized as Beijing's Ecological Conservation Area in 200430, Mentougou faced industrial transformation31, the local land use experienced a significant change18. With the acceleration of the process of urbanization, the area has undergone intense urban land expansion, with GDP and population growing from 7.51 billion yuan (RMB) and 0.25 million in 2000 to 17.45 billion yuan (RMB) and 0.32 million in 2016. In addition, many abandoned mined land has been reclaimed and utilized as the closure of various mines, which also provided the area with the impetus for rapid urban expansion32.

Location of the study area (the map was created by the author using the software ArcGIS 10.5, www.esri.com).
Data resources
Urban land area
Urban land area refers to the developed land covered by impervious surfaces, including urban–rural land, residential land, industrial and mining land, transportation land7. In this study, we classified land use types into arable land, forestland, grassland, urban land and unused land. Google Earth Engine (GEE) platform provides the possibility for large-scale remote sensing data processing and mining analysis33. Therefore, Landsat TM and ETM images from 1990 to 2016 were selected as data sources and archived in the GEE. These images were obtained on April 19 and May 19, 1990 obtained from Landsat TM, on April 19, 2000 and April 21, 2010 from ETM and TM, and April 30 and May 19, 2016 from Landsat TM. The spatial resolution of the land use dataset was 30 m and the temporal resolution was per 16 days. All images were obtained from plant growing seasons, in order to facilitate comparative analysis. We also obtained land use datasets from the Data Center for Resources and Environmental Sciences, Chinese Academy of Sciences (RESDC) (http://www.resdc.cn), which has high accuracy and application value32.
Explanatory factors: selection and pre-processing of variables
Based on the data available and literature review in the introduction section, driving factors (independent variables) that are likely to affect urban land expansion were classified into 6 categories, including topographical, geological, accessibility, neighborhood, land market and government action factors, and urban land expansion change density was selected as dependent variables14,31.
-
(i)
Topographic factors High resolution (30 m) Digital Elevation Model (DEM) data, developed in the 1980s, collected from the National Administration of Surveying, Mapping and Geoinformation of China. Based on DEM, the terrain factors were extracted to obtain the corresponding slope and aspect. Among them, the aspect factor was further converted into aspect index27, the formula is as follows:
$${\text{Aspect index}} = {\text{cos}}(q \times \pi /{18}0)$$where θ represents the aspect (value range is 0°–360°), and the aspect index ranges from − 1 to 1. The potential solar radiation is higher when the index value is closer to 1.
-
(ii)
Geological factors Geological factors include the risk of goaf collapse and fault. The data of the year 2010 were available from our project of Optimization Technology for the Reuse of Abandoned Mined Land in Industrial Succession Cities18. The data generating process was also based on the results of our research.
-
(iii)
Accessibility factors Four accessibility variables such as distance to main roads, distance to railways, distance to city center and distance to rivers were extracted from National Administration of Surveying, Mapping and Geoinformation of China (http://218.244.250.78/NgccDigitalHall/). The data in 2000, 2010 and 2016 were used for main roads and railways. Other factors present no significant dynamic throughout the study period, thus, data from the year 2000 was used to calculate other accessibility factors.
-
(iv)
Neighborhood factors Based on the previous study7, the proportion of urban land area within a 7 × 7 object pixel was set for each pixel in the study area. The neighborhood factor is calculated by Block Statistics Tool in ArcGIS. We calculated the neighborhood factor in 1990, 2000, 2010 and 2016, respectively.
-
(v)
Land market factors Land market factors include utilization efficiency of construction land, population urbanization rate, per capita GDP and per capita rural income. The proportion of non-agricultural output value to the area of construction land and urban resident population were used to calculate construction land utilization efficiency and population urbanization rate, respectively. The data were collected from the Statistical Year Book of Beijing City (http://tjj.beijing.gov.cn/) from 1990 to 2016.
-
(vi)
Government action factors Government action factors include industrial restructuring and local fiscal expenditure. The industrial restructuring was represented by the proportion of the tertiary industry output value to the secondary industry output value. The government action factors were also obtained from the Statistical Year Book of Beijing City from 1990 to 2016. Details of these variables are provided in Table 1.
Table 1 Description of driving factors.
Research procedure
-
(i)
Supported by the GEE platform, we firstly selected Landsat TM and ETM images with cloud-free images from 1990 to 2016, and extracted features from the land use datasets. These pre-processed images were cropped according to the study area boundaries to obtain the land use datasets for 1990, 2000, 2010 and 2016, and then LULC change covering the whole region was assessed.
-
(ii)
Referred to the interpretation principles34, we performed a visual analysis of land use dataset classified pixels, and randomly selected an average of 10 000 pixels (about 6000 (60%) pixels for training samples and 4000 (40%) for verification samples) for sample analysis from each year, which was used for evaluating the classified maps. For more information about data processing, see Appendix Table 1.
-
(iii)
The LULC results were extracted by the SVM classifier. The area of different land use types was shown in Appendix Table 2. The indicators of overall accuracy and kappa coefficient were calculated from the error matrix35 to evaluate the overall classification accuracy, and land use data of RESDC was used as standard. The overall accuracy and Kappa coefficient of LULC classification from 1990 to 2016 were 0.84 ± 0.03 and 0.83 ± 0.06, respectively (Fig. 2). The overall accuracy of each land use type was above 0.82 ± 0.05, and the Kappa coefficient ranged from 0.84 ± 0.06 to 0.87 ± 0.07 (Table 2). The results indicated that the overall accuracy of the SVM classification is high, which meets the research needs. The area of different land use types refers to Appendix Table 2.
Table 2 The accuracy assessment of land use interpretation from 1990 to 2016. Figure 2 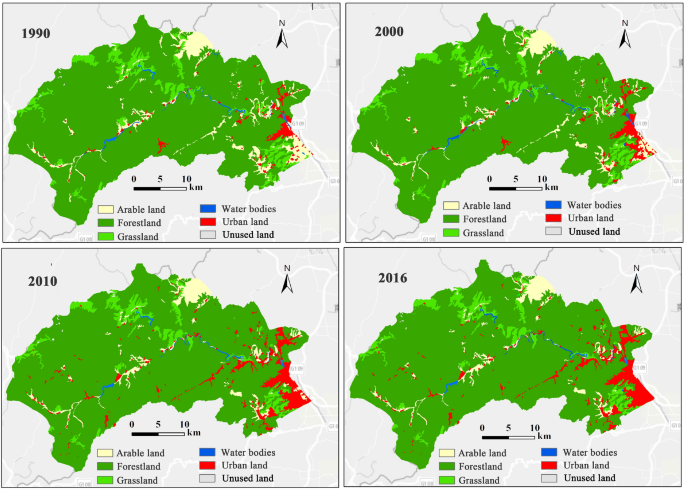
Land cover maps in Mentougou from 1990 to 2016.
-
(iv)
Each explanatory variable was generated as a layer in the ArcGIS environment and converted to a 30 × 30 m grid for model-fitting. In order to reduce the error of samples distribution on the results, the expansion intensity of urban land was taken as the dependent variable. the original driving factors data were randomly divided into two parts: training samples (60%) and validation samples (40%)36. All samples were divided repeatedly for 5 times to obtain stable results, resulting in 5 random sub-samples of the data. MLR and RF models were then applied and compared to identify the influential factors and their relative importance on urban land expansion, the partialPlot of RF model was used to calculate the influence intensity (variable effect) on urban land expansion change. The research framework was shown in Fig. 3.
Figure 3 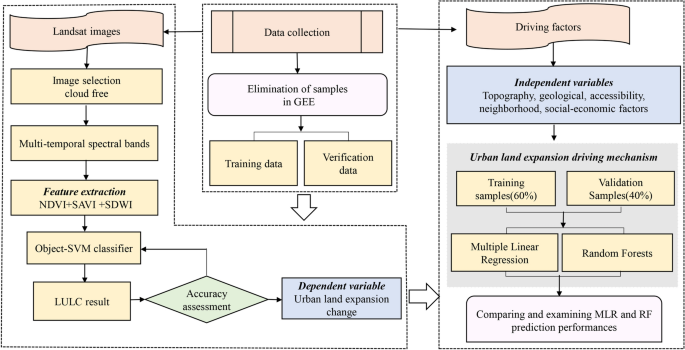
Schematic representation of the research framework. SAVI, NDVI, NDW and LULC represent Soil Adjusted Vegetation Index, Normalized Difference Vegetation Index and Normalized Difference Water Index and land use/cover.


Models and computing procedures
Urban land expansion
The average annual urban expansion rate (UE) and average annual urban expansion intensity rate (UI) are used to compare urban land expansion in different periods6. The equation of average UE is as follows:
The average UI is expressed as follows:
where Ua and Ub represent the total urban land area in the initial and final time period, respectively, and T is the time period.
SVM-based classification
There are many automatic land classification algorithms, such as statistical analysis method, decision tree method, K-means algorithm, random forest regression (RF), Super Vector Machine (SVM)37. Among these algorithms, SVM is a machine learning method based on non-probabilistic binary functions38. Compared to most classification methods, SVM is characteristic of high fitting ability, high predictive power and high-dimensional feature space, which has been widely used in remote sensing image classification research in recent years37,39.
SVM-based classification aims to find a low-dimensional classification hyperplane in the constructed high-dimensional space based on a kernel function, which is typically adopted polynomial basis, Gaussian radial basis and sigmoid basis functions37. Among these functions, previous studies have proved that the gaussian radial basis works best in most situations40,41. Therefore, we chose the Gaussian radial basis function as the SVM classifier, and selected the two necessary parameters of the kernel width γ and the penalty parameter C, which were directly affected the classification accuracy. Based on relevant studies, the result will be better when C takes 100 and γ takes the reciprocal of the number of bands42. In this study, the number of Landsat TM/ ETM bands involved in the classification of images was 9, so the kernel width was set 1/9 and the penalty parameter was set 100.
Models
Multiple linear regression
Multiple Linear Regression (MLR) has been widely applied in the study of driving factors of land use change23,43. In order to eliminate the factors with collinearity, the Variance Inflation Factor (VIF) was used to test the influencing factors before fitting MLR model44. We randomly selected training samples and validation samples for 5 times of calculations, and the predictive ability of the model was tested based on the validation data. The statistically significant predictor variables (α = 0.05) were chosen from at least three of five training samples to fit the final MLR.
The LMG metric (Lindeman, Merenda, and Gold method), which identifies the contribution of variables and other predictors32, and represents the average R2 contribution of each variable in the regression. In our study, the relative importance of each variable was measured and evaluated by LMG index. The higher value of LMG metric shows the higher importance of the variables, and variables less than 2% LMG were removed from the final model45. The LMG metrics were calculated in the Relaimpo package of R software.
Random forest model
Random Forests (RF) is a non-parametric algorithm, which can explore the relationship between independent variables and dependent variables, and calculate the relative importance of covariates46. In this study, the bootstrap resampling technique was used to randomly extract ‘ntree’ sampling with sample size of N from urban land expansion data27, so as to randomly select the number of variables used at each split of ‘mtry’ variables on node of each classification tree. The RF is composed of ‘ntree’ trees, and the results are the average of all ‘ntrees’. In each sampling, the results accounted for about two-thirds of the entire sample, and retains the rest of samples (called out-of-bag, OOB) to estimate the internal error47 (Pang et al., 2020). We set the ‘mtry’ as 4 and ‘ntree’ as 2000 in the number of independent variables. Finally, variable importance was extracted based on node impurity, which was calculated based on the decline in the Mean Decrease Accuracy (%IncMSE) of prediction after splitting nodes.
%IncMSE in RF method was used to measure the importance of independent variables in urban land expansion. According to the average calculation results of 5 samples, we selected the most relevant variables to fit the final model. Besides, the Partial Plot Function in R statistical software package was used to build part of the correlation diagram and analyze the main driving factors of urban land expansion. And then the coefficient of determination (R2) and mean absolute error (MAE) were used to test the fitting accuracy of MLR and RF48. A higher value of R2 and a lower value of MAE indicated a higher model interpretation accuracy. The driving factors analyses of RF were carried out by R statistics software.
Results
Urban land expansion dynamic change
The overall urban land expansion in Mentougou from 1990 to 2016 is shown in Fig. 4. Urban land was mainly distributed in shallow mountains and hilly areas. In 1990–2000, the urban land expanded with an average UE of 3.89% and average UI of 2.80% and the increased area of 1127.19 ha, which were concentrated in the southeast of Mentougou, the main urban land area. In 2000–2010, the urban land expansion rate and intensity were the highest with an average UE of 10.11% and average of UI 5.02% and the increased area of 4072.64 ha, the urban core expansion became more apparent, urban expansion was mainly along the main transportation lines. From 2010 to 2016, under the background of industrial transformation and urban planning, the average UE and average UI increased slowly, with 1.85% and 1.66%, respectively. The total urban land expansion from 1990 to 2016 showed a continuous upward trend and increased 6097.42 ha with an average UE of 8.01% and average UI of 2.57%, respectively (Table 3).

Spatial expansion distribution of urban land from 1990 to 2016.
Variable importance measurement
Multiple linear regression
The results of the multicollinearity test (Table 4) showed that no obvious collinearity was found among all the variables, and 16 variables were used as influencing factors for MLR model fitting. It can be seen from Table 5 that local fiscal expenditure, industrial restructuring, per capita rural income and per capita GDP were positively correlated with the urban land expansion in Mentougou. The importance of the independent variables showed that the most important factors in the MLR model were the elevation, risk of goaf collapse, then followed by distance to city center, local fiscal expenditure, industrial restructuring, distance to main roads, per capita rural income. While population urbanization rate and per capita GDP had a lower impact on urban land by the MLR model. The final model was built with 9 variables in the dataset.
Random forest regression
According to the research results, we took 20% as the threshold of the %IncMSE, and selected the significant variables with %IncMSE higher than 20% for the final model. Figure 5 is the ranking of the impact of each variable on urban land expansion. The final model was built with the 9 variables shown in Table 6. In this model, the %IncMSE value in descending order was as follows: elevation, risk of goaf collapse, distance to main roads, distance to city center, local fiscal expenditure, industrial restructuring, distance to railways, per capita GDP, per capita rural income.

Importance ranking of driving factors by RF model.
Model fitting comparison
The fitting results of both MLR and RF showed that all variables appeared as highly significant (p < 0.001) in the intermediate models. Table 7 showed the adjusted R2 of each training sample and the correlation between observed and predicted values in MLR. Among them, the adjusted R2 values were 0.57–0.59, the correlation values were all above 0.763, and the final model interpretation variance percentages were above 58%. In contrast, RF modelling showed a proportion of explained variance between 88.73% and 89.34% in both training and validation datasets. The mean square residual error was 0.00861–0.00868, and the correlation between the observed value and the predicted value was higher than 0.928 (Table 8).
Figure 6 showed R2 and model interpretation rate of final sample predicted and actual values calculated by MLR and RF respectively. The distribution of observed and predicted values of MLR had more residuals than RF. The R2 of MLR was 0.58, which was smaller than that of RF (R2 = 0.88). The MAE value of MLR (13.25) was higher than that of RF model (4.81). The model interpretation degree of RF was higher than that of MLR, indicating that the deviation error of prediction value of random forest was smaller than multiple linear regression. In addition, there was 1/3 negative value in the urban land prediction value of MLR, which is contrary to the actual significance of urban land spatial change intensity, but there was no negative value in RF. Therefore, the prediction of RF had a larger R2 than MLR, the correlation between the actual value and the predicted value was stronger and the model interpretation degree was higher, thus RF was prone to more practicality and it could be used to analyze the factors of urban land expansion.

Observed and predicted values by MLR and RF Models.
Partial dependence for important variables
In order to analyze the influence of the regularity of main driving factors on urban land spatial expansion, we used the partial dependence plots to draw the local dependence diagram between urban land expansion and its important influential factors including elevation, risk of goaf collapse area, distance to main roads, distance to city center, distance to railways, local fiscal expenditure, industrial restructring, per capita GDP and per capita rural income (Fig. 7). Urban land area decreased sharply when the elevation was 25 m and the risk of goaf collapse was 0.4, and then stabilized after the elevation was 1300 m and the risk of goaf collapse is 0.8. The distance to roads and distance to city center had a decreasing trend on urban land expansion. When the distance to main roads was 1 km and the distance to city center was 5 km, their impact on urban land was the greatest. When the distance to roads was 3 km and the distance to the city center was 13 km, the impact of those two variables on urban land was minimal and remained unchanged. While the distance to railways showed a trend from decline to rise. Urban land area was mainly distributed in areas with the local fiscal expenditure of 22 million RMB. As the local fiscal expenditure increased, its impact on the expansion of urban land area became greater and reached a peak at 27 million RMB. The industrial restructuring and per capita rural income had a similar trend which was positively correlated and had a stronger effect on urban land expansion. The influence of CGDP was greatest at 11,000 RMB, and then increased after CGDP was 15,000 RMB.

Partial dependence plots of the main influence factors on urban land expansion using RF.
Discussion
Unlike many studies aimed at the descriptive analysis of urban land expansion, we explored the importance and influence of each variable on urban land expansion using MLR and RF models. The random forests had a better ability (with a high prediction accuracy) in the estimation of urban land expansion change caused by natural and human activities, and 9 variables were identified as important factors in both methods. Among these factors, elevation and the risk of goaf collapse were identified as important geological factors of Mentougou, which is in line with findings of earlier studies18,49. Tian et al.32 concluded that mining towns had complex topographical conditions and large fluctuations in elevation and goaf collapse area, thus, urban land construction was relatively difficult, which required more technical support and capital investment to expand urban space. However, our study did not find the impact of slope and aspect factors on urban land expansion in both MLR and RF, which is contrary to Cheng18. This may be due to most of the urban construction in the study area is located in flat terrain, and the spatial heterogeneity of slope and aspect is inapparent on urban land expansion.
In addition to topographic conditions, the accessibility factors including the distance to city center, to main roads, to railways also significantly influence urban land expansion, which is supported by other studies20,51. Our results revealed that the longer distance to main roads and city center, the smaller impact on urban land expansion. Poelmans and Van52 believed that the closer to city center, main roads, the more likely a region will be urbanized. However, the partial dependence result of the distance to railways showed a trend of decreasing and then increasing. This may be due to the soil near and traffic lines are loose and weak, which may lead to the expansion of urban area far away from railways7.
Our study also identified the importance of land market factors including the per capita GDP and per capita rural income on urban land expansion based on two models. Some studies have noted that the relationship between GDP growth and land expansion is U-shaped, suggesting that land expansion first increases as GDP increases and then decreases beyond a threshold20. Regional economy development will increase the investment in urban infrastructure construction, so as to expand domestic demand and speed up the expansion of urban land6. According to the result of RF and MLR, per capita GDP and rural income are positively related to urban land expansion in Mentougou, which is consistent with other studies18,25.
The financial investment and industrial restructuring in urban construction land, representing government effectiveness, significantly expanded the urban land of Mentougou. Similarly, Galinato et al. 53 noted that higher fiscal input is associated with larger urban land scales. In the past decades, the Chinese central government and local governments had invested a large amount of money in the development of urbanization, which directly influenced urban land change in many regions, such as Mentougou. National policies also had a large impact on land management practices and government’s behavior could be seemed as the original impetus for urban land expansion. For example, in 2006, the town’s government started a project that was designed to improve urban land utilization and living environment. Under this project, the government provided reconstruction and compensation to households that were staying in old residential areas and shantytowns in the goaf area, and made great efforts to increase investment in urban infrastructure, urban roads, etc18. Additionally, in order to allocate land resources reasonably, local governments also promulgated economic development policies (e.g., city planning) and related plans (e.g., traffic planning)31. As of 2010, residential land and traffic land in Mentougou increased by 2034 ha and 1027 ha compared to 2000, respectively. Moreover, the industrial economy of Mentougou was gradually transforming into tourism, ecological agriculture and high-tech industries. However, it should be noted that the increase of average UE and average UI in 2000–2010 was 4 times that in 1990–2000. This is because most construction land distributed mainly in the plain areas with flat terrain and favorable engineering geological conditions, which combined economic development policies support and financial investment, accelerates population growth and urban expansion32. In general, although the increased rate of urban land expansion had slowed down in Mentougou, we couldn't ignore there is still a tendency of excessive expansion of urban land. Therefore, the arduousness of land planning in Mentougou in the future, and more measures, effort and continuous policy support are needed.
In addition, the comparison of MLR and RF revealed the variance explained by RF was about 20% higher than MLR, which indicated that RF was better than MLR in the model fitting. The importance and ranking results of the main driving factors showed that RF method was not a single test of whether there was a significant linear relationship between a certain impact factor and the urban land expansion, it could analyze the relative importance of factors on urban land expansion, and its advantages lied in each variable can be used multiple times, allowing non-linear relationships and interaction to be included in the model27. Moreover, the process sampling inspection of RF can ensure the accuracy and stability of significance tests, which is also an important aspect of the method superior to MLR54. However, due to the complicated non-linear effect of the driving factors on urban land expansion, the current research is in the deep exploration stage, and statistical models are still the major research method55. Our results also indicate that the factors such as distance to the road, the risk of goaf collapse, per capita GDP, and per capita rural income had different orders in both MLR and RF, the reason for the difference was possibly attributable to the differences in statistical principles27,54. However, from the existing research, the clarification of these differences is still complicated and uncertain56,57, which needs to be further researched.
However, our study still has some limitations, we only selected 16 potential factors as the explanatory variables. In the case of data availability, it is also need to obtain other relevant factors. Furthermore, for the exploration of spatiotemporal variations in urban sprawl, more accurate and efficient estimation approaches, such as nighttime light (NTL) data58, can be used in future research to obtain longer high-resolution data time series. Moreover, in the near future, researchers could also focus on exploring the spatiotemporal differences of driving factors in different regions, so as to assess the applicability of the methods for identifying the relative importance of different variables.
Conclusion
Our research provided a new perspective through machine-learning techniques for ranking the main driving factors of urban land expansion in Mentougou district. Further, we interpreted the land use/cover remote sensing images based on long-term Landsat and GEE platform, which compensates the disadvantage of the low overall accuracy of publicly available land use products, and provides a more effective approach for land mapping. This joint SVM-Machine learning approach is a useful guideline for enriching the existing research framework and predicting the impact on important driving factors of land use/cover change. We found that there was an expanding trend of urban land from 1990 to 2016, and the expansion of urban land area was mainly determined by the combination of natural environment and socio-economic factors. Based on the results here, it needs to design different land schemes according to the importance of explanatory variables, so as to control urban sprawl and minimize the adverse impacts in Mentougou. Further, factors such as elevation, the risk of goaf collapse, government drivers, accessibility, GDP, rural income and population density should be given priority in land use policies.
References
Orr, D. W. Land use and climate change. Conserv. Biol. 22(6), 1372–1374 (2010).
Zhang, X. D. et al. Tropospheric ozone perturbations induced by urban land expansion in China from 1980 to 2017. Environ. Sci. Technol. https://doi.org/10.1021/ACS.EST.1C06664 (2022).
Noojipady, P. et al. Forest carbon emissions from cropland expansion in the Brazilian cerrado biome. Environ. Res. Lett. 12(2), 025004. https://doi.org/10.1088/1748-9326/aa5986 (2017).
Zhu, B., Xun, Z., Ran, Z. & Zhao, X. Study of multiple land use planning based on the coordinated development of wetland farmland: A case study of Fuyuan City, China. Sustainability 11(1), 271. https://doi.org/10.3390/su11010271 (2019).
Tong, D., Chu, J., Han, Q. & Liu, X. How land finance drives urban expansion under fiscal pressure: Evidence from Chinese cities. Land. 11(2), 253. https://doi.org/10.3390/land11020253 (2022).
Chen, J., Chang, K. T., Karacsonyi, D. & Zhang, X. Comparing urban land expansion and its driving factors in Shenzhen and Dongguan, China. Habitat. Int. 43, 61–71. https://doi.org/10.1016/j.habitatint.2014.01.004 (2014).
Shu, B. R., Zhang, H. H., Li, Y. L., Qu, Y. & Chen, L. Spatiotemporal variation analysis of driving forces of urban land spatial expansion using logistic regression: A case study of port towns in Taicang City, China. Habitat. Int. 43, 181–190. https://doi.org/10.1016/j.habitatint.2014.02.004 (2014).
Wang, R. Y., He, W. S., Wu, D., Zhang, L. & Li, Y. J. Urban Land expansion simulation considering the diffusional and aggregated growth simultaneously: A case study of Luoyang City. Sustainability. 13(17), 9781–9781. https://doi.org/10.3390/su13179781 (2021).
Wei, Y. D. & Ye, X. Determinants of urban land expansion and environmental change in China. Stoch. Env. Res. Risk. A. 28(4), 757–765. https://doi.org/10.1007/s00477-013-0840-9 (2014).
Yang, Q. K., Duan, X. J., Yang, L. & Wang, L. Spatial-Temporal patterns and driving factors of rapid urban land development in provincial China: A case study of Jiangsu. Sustainability. 9(12), 2371. https://doi.org/10.3390/su9122371 (2017).
Zhong, Y., Lin, A. & Zhou, Z. Evolution of the pattern of spatial expansion of urban land use in the Poyang Lake ecological economic zone. Int. J. Environ. Res. Public. Health. 16(1), 117. https://doi.org/10.3390/ijerph16010117 (2019).
Wu, C., Huang, X. & Chen, B. Telecoupling mechanism of urban land expansion based on transportation accessibility: A case study of transitional Yangtze River economic Belt, China. Land Use Policy 96, 104687. https://doi.org/10.1016/j.landusepol.2020.104687 (2020).
Zhao, P. Sustainable urban expansion and transportation in a growing megacity: Consequences of urban sprawl for mobility on the urban fringe of Beijing. Habitat. Int. 34(2), 236–243. https://doi.org/10.1016/j.habitatint.2009.09.008 (2010).
Cai, W. J. & Tu, F. Y. Spatiotemporal characteristics and driving forces of construction land expansion in Yangtze River economic belt, China. PLoS ONE 15(1), 0227299. https://doi.org/10.1371/journal.pone.0227299 (2020).
Salvati, L., Carlucci, M., Grigoriadis, E. & Chelli, F. M. Uneven dispersion or adaptive polycentrism? Urban expansion, population dynamics and employment growth in an “ordinary” city. Rev. Region. Res. 38(1), 1–25. https://doi.org/10.1007/s10037-017-0115-x (2017).
Cao, Y., Ba, I. Z., Zhou, W. & Zhang, X. Analyses of traits and driving forces on urban land expansion in a typical coal-resource-based city in a loess area. Environ. Earth. Sci. 75(16), 1191.1-11911.3. https://doi.org/10.1007/s12665-016-5926-5 (2016).
Davies, R. G., Barbosa, O. D. & Fuller, R. A. City-wide relationships between green spaces, urban land use and topography. Urban Ecosyst. 11(3), 269. https://doi.org/10.1007/s11252-008-0062-y (2008).
Cheng, L. L., Liu, M. & Zhan, J. Q. Land use scenario simulation of mountainous districts based on Dinamica EGO model. J. Mt. Sci. 17(2), 289–303. https://doi.org/10.1007/s11629-019-5491-y (2020).
Liu, J. Y., Zhan, J. Y. & Deng, X. Z. Spatio-temporal patterns and driving forces of urban land expansion in China during the economic reform era. Ambio 34, 450–455. https://doi.org/10.1579/0044-7447-34.6.450 (2005).
Li, X. M., Zhou, W. & Quyang, Z. J. Forty years of urban expansion in Beijing: What is the relative importance of physical, socioeconomic, and neighborhood factors?. Appl. Geogr. 38, 1–10. https://doi.org/10.1016/j.apgeog.2012.11.004 (2013).
Wang, Z. W. & Lu, C. H. Urban land expansion and its driving factors of mountain cities in China during 1990–2015. J. Geogr. Sci. 28(8), 1152–1166. https://doi.org/10.1007/s11442-018-1547-0 (2018).
Zhang, Y. W. & Xie, H. L. Interactive relationship among urban expansion, economic development, and population growth since the reform and opening up in China: An analysis based on a vector error correction model. Land 8(10), 153–153. https://doi.org/10.3390/land8100153 (2019).
Deng, X., Huang, J., Rozelle, S. & Uchid, E. Growth, population and industrialization, and urban land expansion of China. J. Urban. Econ. 63(1), 96–115. https://doi.org/10.1016/j.jue.2006.12.006 (2006).
Luo, J., Zhang, X. & Wu, Y. Urban land expansion and the floating population in China: For production or for living?. Cities 74(4), 219–228. https://doi.org/10.1016/j.cities.2017.12.007 (2018).
Salem, M., Tsurusaki, N. & Divigalpitiya, P. Analyzing the driving factors causing urban expansion in the peri-urban areas using logistic regression: A case study of the greater Cairo region. Infrastructures 4(1), 4. https://doi.org/10.3390/infrastructures4010004 (2019).
Salem, M., Bose, A. & Chowdhury, I. R. Urban expansion simulation based on various driving factors using a logistic regression model: Delhi as a case study. Sustainability 13(19), 1–17. https://doi.org/10.3390/su131910805 (2021).
Su, Z. W. et al. Using GIS and Random Forests to identify fire drivers in a forest city, Yichun, China. Geomat. Nat. Hazards. Risk. 9(1), 1207–1229. https://doi.org/10.1080/19475705.2018.1505667 (2018).
Hu, Y. & Hu, Y. Land cover changes and their driving mechanisms in central Asia from 2001 to 2017 supported by google earth engine. Remote. Sens-Basel. 11(5), 554. https://doi.org/10.3390/rs11050554 (2019).
Liu, Y., Song, W. & Deng, X. Understanding the spatiotemporal variation of urban land expansion in oasis cities by integrating remote sensing and multi-dimensional dpsir-based indicators. Ecol. Indic. 2(96), 23–37. https://doi.org/10.1016/j.ecolind.2018.01.029 (2019).
Tian, C., Cheng, L. L., Wang, Y. F., Sun, H. Y. & Yin, T. T. Comprehensive effectiveness evaluation and obstacle diagnosis of mining villages in the transition period. Trans. CSAE. 38(5), 241–249. https://doi.org/10.11975/j.issn.1002-6819.2022.05.029 (2022).
Cheng, L. L., Sun, H. Y., Zhang, Y. & Zhen, S. Spatial structure optimization of mountainous abandoned mine land reuse based on system dynamics model and CLUE-S model. Int. J. Coal. Sci. Techn. 6, 113–126. https://doi.org/10.1007/s40789-019-0241-x (2019).
Tian, C., Cheng, L. L. & Yin, T. T. Impacts of anthropogenic and biophysical factors on ecological land using logistic regression and random forest: A case study in Mentougou District, Beijing, China. J. Mt. Sci. 19, 433–445. https://doi.org/10.1007/s11629-021-7022-x (2022).
Gorelick, N., Hanchr, M., Dixon, M., Ilyushchenko, S. & Moore, R. Google earth engine: Planetary-scale geospatial analysis for everyone. Remote. Sens. Environ. 202, 18–27. https://doi.org/10.1016/j.rse.2017.06.031 (2017).
Feng, R. D., Wang, F. Y. & Wang, K. Y. Quantifying influences of anthropogenic-natural factors on ecological land evolution in mega-urban agglomeration: A case study of Guangdong-Hong Kong-Macao Greater Bay area. J. Clean. Prod. 283(9), 125304. https://doi.org/10.1016/j.jclepro.2020.125304 (2021).
Sun, X., Lu, Z., Li, F. & Crittenden, J. C. Analyzing spatio-temporal changes and tradeoffs to support the supply of multiple ecosystem services in Beijing, China. Ecol. Indicat. 94, 117–129. https://doi.org/10.1016/j.ecolind.2018.06.049 (2018).
Oliveira, S., Oehler, F., San-Miguel-Ayanz, J., Camia, A. & Pereira, J. Modeling spatial patterns of fire occurrence in Mediterranean Europe using multiple regression and random forest. Forest. Ecol. Manag. 275, 117–129. https://doi.org/10.1016/j.foreco.2012.03.003 (2012).
Ugur, A. Dynamic land cover mapping of urbanized cities with Landsat 8 multi-temporal images: Comparative evaluation of classification algorithms and dimension reduction methods. Isprs Int. J. Geo-Inf. 8(3), 139. https://doi.org/10.3390/ijgi8030139 (2019).
Chapelle, O. Training a support vector machine in the primal. Neural. Comput. 19(5), 1155. https://doi.org/10.1162/neco.2007.19.5.1155 (2007).
Lin, Q. Y., Guo, J. Y., Yan, J. F. & Wang, H. Land use and landscape pattern changes of Weihai, China based on object-oriented SVM classification from Landsat MSS/TM/OLI images. Eur. J. Remote. Sens. 51(1), 1036–1048. https://doi.org/10.1080/22797254.2018.1534532 (2018).
Devos, O., Ruckebusch, C., Duponchel, L. & Huvenne, J. P. Support vector machines (SVM) in near infrared (NIR) spectroscopy: Focus on parameters optimization and model interpretation. Chemometr. Intell. Lab. 96(1), 27–33. https://doi.org/10.1016/j.chemolab.2008.11.005 (2009).
Heumann, B. W. An object-based classification of mangroves using a hybrid decision tree-support vector machine approach. Remote. Sens-Basel. 3(11), 2440–2460. https://doi.org/10.3390/rs3112440 (2011).
Hsu, C., Chang, C. C. & Lin, C. J. A practical guide to support vector classification, 15. Department of Computer Science, National Taiwan University. https://doi.org/10.1111/j.1365-3016.1995.tb00168.x (2009).
Aspinall, R. Modelling land use change with generalized linear models-a multi-model analysis of change between 1860 and 2000 in Gallatin valley, Montana. J. Environ. Manage. 72(1–2), 91–103. https://doi.org/10.1016/j.jenvman.2004.02.009 (2004).
Wu, W. & Zhang, J. Comparison of spatial and non-spatial logistic regression models for modeling the occurrence of cloud cover in north-eastern Puerto Rico. Appl. Geogr. 37, 52–62. https://doi.org/10.1016/j.apgeog.2012.10.012 (2013).
Thomas, D. R., Zhu, P. C. & Decady, Y. J. Point estimates and confidence intervals for variable importance in multiple linear regression. J. Educ. Behav. Stat. 32(1), 61–91. https://doi.org/10.1002/bimj.201100134 (2007).
Huang, B. & Boutros, P. C. The parameter sensitivity of random forests. BMC Bioinform. 17, 331. https://doi.org/10.1186/s12859-016-1228-x (2016).
Pang, J., Chen, Y., He, S., Qiu, H. & Mao, L. Classification of friction and wear state of wind turbine gearboxes using decision tree and random forest algorithms. J. Tribol-T. Asme. 143(9), 1–28. https://doi.org/10.1115/1.4049257 (2020).
Liu, M., Hu, S., Ge, Y., Heuvelink, G. & Huang, X. Using multiple linear regression and random forests to identify spatial poverty determinants in rural China. Spat. Stat.-Neth. 42, 100461. https://doi.org/10.1016/j.spasta.2020.100461 (2020).
Jutidamrongphan, W. Determine the land-use land-cover changes, urban expansion and their driving factors for sustainable development in Gazipur Bangladesh. Atmosphere 12(10), 1353. https://doi.org/10.3390/atmos12101353 (2021).
Liu, M. & Tian, H. China’s land cover and land use change from 1700 to 2005: estimations from high-resolution satellite data and historical archives. Glob. Biogeochem. Cycles https://doi.org/10.1029/2009GB003687 (2010).
Tong, Z., Yao, S., Hu, W. & Cui, F. Simulation of urban expansion in Guangzhou Foshan metropolitan area under the influence of accessibility. Scientia. Geographica. Sinica. 38(5), 737–746 (2018).
Poelmans, L. & Rompaey, A. V. Complexity and performance of urban expansion models. Comput. Environ. Urban Syst. 34(1), 17–27. https://doi.org/10.1016/j.compenvurbsys.2009.06.001 (2010).
Galinato, S. P. & Gregma, I. The effects of government spending on deforestation due to agricultural land expansion and CO2 related emissions. Ecol. Econ. 122, 43–53. https://doi.org/10.1016/j.ecolecon.2015.10.025 (2016).
Xie, X. F., Wu, T., Zhu, M., Jiang, G. J. & Xw, E. Comparison of random forest and multiple linear regression models for estimation of soil extracellular enzyme activities in agricultural reclaimed coastal saline land. Ecol. Indic. 120, 106925. https://doi.org/10.1016/j.ecolind.2020.106925 (2021).
Miller, M. D. The mpacts of Atlanta’s urban sprawl on forest cover and fragmentation. Appl. Geogr. 34, 171–179. https://doi.org/10.1016/j.apgeog.2011.11.010 (2012).
Güneralp, B. & Seto, K. C. Futures of global urban expansion: uncertainties and implications for biodiversity conservation. Environ. Res. Lett. https://doi.org/10.1088/1748-9326/8/1/014025 (2013).
Qiao, W. et al. Multi-dimensional expansion of urban space through the lens of land use: The case study of Nanjing city, China. J. Geogr. Sci. 29(5), 749–761. https://doi.org/10.1007/s11442-019-1625-y (2019).
Yza, B., Lt, A. & Hw, A. An improved approach for monitoring urban built-up areas by combining NPP-VIIRS nighttime light, NDVI, NDWI, and NDBI. J. Clean. Prod. 329, 129488. https://doi.org/10.1016/j.jclepro.2021.129488 (2021).
Acknowledgements
This work was supported by project National Natural Science Foundation of China No. 41877533.
Author information
Authors and Affiliations
Contributions
L.L. Cheng conceptualized the research idea. C.T. developed the theory analyzed the results and wrote the manuscript. T.T. Yin collected literatures and data. All authors reviewed the manuscript.
Corresponding author
Ethics declarations
Competing interests
The authors declare no competing interests.
Additional information
Publisher's note
Springer Nature remains neutral with regard to jurisdictional claims in published maps and institutional affiliations.
Supplementary Information
Rights and permissions
Open Access This article is licensed under a Creative Commons Attribution 4.0 International License, which permits use, sharing, adaptation, distribution and reproduction in any medium or format, as long as you give appropriate credit to the original author(s) and the source, provide a link to the Creative Commons licence, and indicate if changes were made. The images or other third party material in this article are included in the article's Creative Commons licence, unless indicated otherwise in a credit line to the material. If material is not included in the article's Creative Commons licence and your intended use is not permitted by statutory regulation or exceeds the permitted use, you will need to obtain permission directly from the copyright holder. To view a copy of this licence, visit http://creativecommons.org/licenses/by/4.0/.
About this article

Cite this article
Cheng, LL., Tian, C. & Yin, TT. Identifying driving factors of urban land expansion using Google Earth Engine and machine-learning approaches in Mentougou District, China. Sci Rep 12, 16248 (2022). https://doi.org/10.1038/s41598-022-20478-z
Received:
Accepted:
Published:
DOI: https://doi.org/10.1038/s41598-022-20478-z
This article is cited by
Comments
By submitting a comment you agree to abide by our Terms and Community Guidelines. If you find something abusive or that does not comply with our terms or guidelines please flag it as inappropriate.
