
Abstract
Campylobacter is the leading cause of bacterial foodborne gastroenteritis worldwide. Handling or consumption of contaminated poultry meat is a key risk factor for human campylobacteriosis. One potential control strategy is to select poultry with increased resistance to Campylobacter. We associated high-density genome-wide genotypes (600K single nucleotide polymorphisms) of 3000 commercial broilers with Campylobacter load in their caeca. Trait heritability was modest but significant (h2 = 0.11 ± 0.03). Results confirmed quantitative trait loci (QTL) on chromosomes 14 and 16 previously identified in inbred chicken lines, and detected two additional QTLs on chromosomes 19 and 26. RNA-Seq analysis of broilers at the extremes of colonisation phenotype identified differentially transcribed genes within the QTL on chromosome 16 and proximal to the major histocompatibility complex (MHC) locus. We identified strong cis-QTLs located within MHC suggesting the presence of cis-acting variation in MHC class I and II and BG genes. Pathway and network analyses implicated cooperative functional pathways and networks in colonisation, including those related to antigen presentation, innate and adaptive immune responses, calcium, and renin–angiotensin signalling. While co-selection for enhanced resistance and other breeding goals is feasible, the frequency of resistance-associated alleles was high in the population studied and non-genetic factors significantly influenced Campylobacter colonisation.
Introduction
Human campylobacteriosis exerts profound societal and economic costs. The World Health Organisation estimated that Campylobacter caused 95 million illnesses, 21,000 deaths and loss of 2.1 million disability-adjusted life years globally in 20101. In the United Kingdom alone, there were 63,946 laboratory-confirmed human cases in 2017, most of which were due to C. jejuni. The ratio of unreported cases of human campylobacteriosis to those captured by national surveillance in the United Kingdom is estimated to be 9.3 to 12, therefore the true burden may exceed half a million cases per annum at a projected median cost to the national health service of £50 million3. Human infections typically involve acute gastroenteritis, however debilitating sequelae may occur including Guillain–Barré syndrome (GBS) and other inflammatory neuropathies4. Poultry are the main reservoir of human campylobacteriosis and up to 80% of human cases may be attributable to the avian reservoir as a whole5,6. During 2016–2017, a United Kingdom-wide survey indicated that 54% of fresh retail chicken was contaminated with viable Campylobacter7. The number of C. jejuni in the caeca of chickens frequently exceeds 108 colony-forming units/gram and carcass contamination at slaughter can be difficult to avoid8,9. Quantitative risk assessments predict that even a relatively modest 2 log10 reduction in the number of Campylobacter on broiler carcasses could reduce the incidence of human disease due to contaminated chicken by up to 30-fold10. A pressing need therefore exists for strategies to reduce the entry of Campylobacter-contaminated poultry meat into the food chain.
As effective vaccines and treatments for pre-slaughter control of Campylobacter in poultry are lacking, much interest exists in the potential for breeding chickens with improved resistance to intestinal colonisation by C. jejuni. The scope for genetic control of Campylobacter in poultry has been demonstrated in commercial broiler lines that vary in resistance11,12,13,14,15,16,17 and inbred layer lines exhibiting heritable differences in C. jejuni colonisation following experimental inoculation18,19. Breeding for Campylobacter resistance may also benefit avian intestinal health and productivity. In some commercial broiler chicken lines, experimental inoculation of C. jejuni elicits damage to the intestinal mucosa, diarrhoea and impaired weight gain20,21. In some birds, Campylobacter colonisation may impact intestinal barrier function22, nutrient absorption and transporter expression21,23, the translocation of Escherichia coli to extra-intestinal organs24, and may lead to a dysbacteriosis. In other studies, where Campylobacter inoculation was via natural exposure mimicking field exposure, there was no association between Campylobacter levels and bird growth rate25 or gut pathology26, and selection for Campylobacter resistance remained compatible with other breeding goals26.
A previously published genome-wide association study (GWAS) on C. jejuni intestinal colonisation, where phenotypes were analysed as a binary trait in a novel dual-purpose chicken breed, revealed a resistance-associated locus on chromosome 11 near the CDH13 gene encoding T-cadherin, and a second candidate locus on chromosome 5 was identified close to calmodulin (CALM1), a calcium-activated modulator of cadherin function17. Both genes differed in relative expression in a manner associated with resistance17. Studies in inbred layer lines 61 and N found heritable differences in caecal colonisation by various C. jejuni strains18. Initial low-resolution mapping studies using reciprocal (61♀ × N♂) and (N♀ × 61♂) F1 crosses and the progeny of an (N♀ × 61♂) F1♂ x N♀ backcross indicated that resistance was controlled by a single autosomal dominant locus18, but subsequent analysis of a backcross population using 1243 fully-informative single nucleotide polymorphism (SNP) markers revealed quantitative trait loci (QTL) on chromosomes 7, 11 and 1419. Using a ninth-generation advanced intercross (61xN) line and a 600K genome-wide SNP array, the location of the QTL on chromosome 14 was confirmed and refined, and additional QTLs were identified on chromosomes 4 and 16, indicating potential involvement of the Major Histocompatibility Complex (MHC) region19. QTL for resistance of chickens to enteric carriage of Salmonella have been reported at the same regions of chromosome 1427 and 1627,28,29 that were implicated in host resistance to C. jejuni colonisation. Analysis of caecal gene expression in chicken lines of varying susceptibility to Campylobacter colonisation has identified transcriptional signatures associated with differential resistance, including genes influencing the immune response13,14,15,16.
In the present study, we conducted a comprehensive genome-wide association study on a commercial pedigree broiler population exposed to Campylobacter naturally present in the litter. The genomic architecture of resistance was analysed using imputed high-density SNP genotyping, and resistance was further characterised by transcriptome analyses of intestinal tissue from birds of the predicted resistant or susceptible genotypes at the corresponding extremes of caecal Campylobacter colonisation phenotype. Our data provide valuable insights into the prospects for genetic control of Campylobacter in poultry.
Results
Descriptive statistics and genetic parameters affecting Campylobacter levels
In the 3000 commercial broilers sampled, we estimated a mean number of caecal C. jejuni ± standard deviation of 7.057 ± 1.023 log10 colony-forming units (CFU) per gram (g), with a maximum of 10.64 log10 CFU/g and minimum of 2 log10 CFU/g, equal to the limit of detection by direct plating. We were unable to detect Campylobacter by direct plating for just 10 out of 3000 caecal samples (0.003%). Sex had a marginal effect on Campylobacter levels (P < 0.05), with males (n = 2141) having a higher Campylobacter load (7.178 ± 0.034 log10 CFU/g) compared to females (n = 859; 6.930 ± 0.032 log10 CFU/g). Campylobacter levels showed seasonal variability, with date of sampling having a significant effect (P < 0.05), while body weight did not have a significant effect on the trait. No significant maternal effects were identified. Modest, but statistically significant heritability for caecal Campylobacter level was estimated (h2 = 0.11 ± 0.03).
Genetic association analyses
From 50K SNP genotype data obtained for 3000 broilers, genotypes were imputed to 600K SNP for 2718 birds. 282 samples failed the pedigree integrity testing prior to imputation and were removed. Imputation was not possible on chromosome 16 due to the complexity of the MHC region. These data were analysed using two genome-wide association methodologies: a genome-wide association study (GWAS) for single SNPs and regional heritability mapping (RHM) to consider associations with genomic regions comprising multiple consecutive SNPs. Using the SNP data on chromosome 16 the MHC haplotypes of these birds were assembled and a haplotype analysis was performed.
Genome-wide association study
Manhattan and quantile–quantile (Q–Q) plots for the GWAS results using the 50K and the imputed 600K arrays are shown in Fig. 1A,B, respectively. SNPs significantly associated with log-transformed caecal Campylobacter levels, after a Bonferroni correction for multiple testing, are shown in Table 1. Multi-dimensional scaling analysis revealed no population substructure in these commercial broilers (Supplementary Fig. S1). GWAS analysis using the 50K SNP DNA array identified one SNP on chromosome 16 significantly associated with the log-transformed number of Campylobacter in the caeca at the genome-wide level and another ca. 100 SNPs on the same chromosome with a suggestive genome-wide significant association with the trait. All the significant SNPs were in high linkage disequilibrium (LD) and located within the same LD block (length 230 kb), in the same MHC region (Supplementary Fig. S2). Three MHC haplotypes were constructed. The recombination events were limited with only one event identified in the TRIM region of MHC of one sample. One of the MHC haplotypes (AA) was detected at much higher frequency (88%; n = 2645), compared to the other two (BB = 0.4%; n = 12 and AB = 11.6%; n = 343). The ensuing MHC haplotype analysis identified statistical significant (P < 0.05) associations between the MHC haplotypes and the log-transformed number of Campylobacter in the caeca. The prevalent MHC haplotype AA was associated with colonisation resistance accounting for 1 log10 difference in the Campylobacter levels compared to the susceptible BB haplotype; a significant favourable dominance deviation was also observed for the heterozygous haplotype AB (Supplementary Fig. S3).

Manhattan plots and Q–Q plots displaying the GWAS results for chicken Campylobacter colonisation resistance using the 50K (A) and the imputed 600K (B) HD arrays. (i) Genomic location is plotted against – log10(P) in the Manhattan plot. Genome-wide (P < 0.05) and suggestive genome-wide thresholds are shown as red and blue lines, respectively. (ii) Q–Q plot of observed P values against the expected P values for Campylobacter caecal load of (log-transformed CFU of Campylobacter per gram of caeca content).
Additionally, one SNP with a genome-wide significant association and another one, located 1.4 Mb away, with a suggestive association were identified on chromosome 26. Similarly, two SNPs identified on chromosome 14, albeit 7.5 Mb apart from each other, crossed the suggestive genome-wide significant threshold. The significant SNPs on chromosomes 14 and 26 were not in LD (on chromosome 14: r2 = 0 between AX-75778268 and AX-75798135 markers; on chromosome 26: r2 = 0 between AX-76346701, AX-76339934 markers). The GWAS analysis using the imputed 600K SNP array information confirmed the associations on chromosomes 14 and 26.
The additive and dominance genetic effects, and the proportion of the total phenotypic variance explained by each of these SNPs are summarised in Table 1. The SNPs on chromosome 14 and 16 had a significant additive effect (ranging from 0.3 to 0.6 log10 CFU/g), while the SNPs on chromosome 26 had a significant dominant effect (ranging from 0.3 to 0.4 log10 CFU/g) on Campylobacter levels. The significant SNPs in the QTL region on chromosome 16 accounted for 6% of the phenotypic variance, while collectively all the SNPs in the three candidate regions accounted for 17% of the phenotypic variance of caecal Campylobacter levels.
Regional heritability mapping
A Manhattan plot and Q–Q plot for the RHM analysis are shown in Supplementary Fig. S4. Details of the significant SNP windows are presented in Supplementary Table S1. RHM confirmed the significant associations on chromosome 16 previously identified by the GWAS. Moreover, RHM detected one more suggestive significant association on chromosome 19.
SNP and candidate region annotation
Most of the significant SNPs identified in the GWAS analysis were located upstream (40%) or downstream (34%) of predicted genes or within introns (19%). However, eight of the SNPs on chromosome 16, one SNP on chromosome 26 and one SNP located within the significant RHM SNP-window on chromosome 19 were found within exons. The exonic variants on chromosome 16 were located within TRIM10 (tripartite motif 10), TAP1 (transporter associated with antigen processing 1), RACK1/GNB2L1 (receptor for activated C kinase 1), TRIM27 (tripartite motif 27), and TRIM32 (tripartite motif 32). The SNP on chromosome 19 corresponds to a synonymous variant within HIP1 (huntingtin interacting protein 1), and the SNP on chromosome 26 corresponds to a missense variance within ADORA3 (adenosine receptor 3). Details of the SNP annotation are presented in Supplementary Table S2.
The candidate QTL regions for caecal Campylobacter levels contained a relatively small number of genes, collectively comprising 173 annotated protein-coding genes, 7 microRNAs and 2 snoRNAs. Details of the genes and non-coding RNAs located in the candidate regions are presented in Supplementary Table S3.
Transcriptomic analyses
As many traits are associated with altered expression of genes within QTLs30, we performed RNA-Seq analysis of the caecal tonsil transcriptome of 23 broilers to identify expression QTLs (eQTLs) and potential allelic imbalance of candidate genes within the regions associated with Campylobacter resistance identified by GWAS and RHM analyses. The birds used were selected to represent combinations of predicted resistant or susceptible genotypes (based on the identified QTLs) that were correspondingly at the extremes of caecal C. jejuni colonisation phenotype (resistant n = 9, susceptible n = 7), as well as the average (n = 7) of measured caecal Campylobacter load (Supplementary Table S4).
Differential gene expression analysis
After false discovery rate (FDR, P < 0.05) correction for multiple testing, 3 protein-coding genes were found to exhibit significant differential expression (Table 2). The three differentially expressed (DE) genes were located within the QTL region on chromosome 16 (BF2, ENSGALG00000032221, ENSGALG00000024357). The BF2 gene is an MHC class I gene while the other two are both BG-like genes belonging to the butyrophilin family. In order to identify more subtle patterns of differential expression, a relaxed significance threshold of unadjusted P value of 0.001 was implemented. A total of 33 genes exhibited differential expression between high-, average-, and low-colonised birds at this threshold (Table 2; Fig. 2). Among these DE genes were several related with the immune response (ILF2, ATG7, BG1, BF2, BF1, TAP1, ZNF692). Interestingly, there were three DE BF2 transcripts, two of which were downregulated (ENSGALT00000079478, ENSGALT00000077683) and the other upregulated (ENSGALT00000087837) in the resistant birds. There were also two DE BF1 transcripts, both of which were upregulated in the resistant birds.

Differential expression analysis results. Differential expression of genes in chickens with different (low, average and high) Campylobacter colonisation levels. Each column represents relative gene expression levels in the caecal tonsils of chickens. Expression level is shown as log2 fold change in gene expression in caecal tonsils from chickens colonised at low and average levels relative to expression in chickens colonised at a high level.
We performed separate cis- and trans- based eQTL analyses for the significant and suggestive significant SNP markers identified by the GWAS and RHM:
Cis-analysis
After false discovery rate (FDR, P < 0.05) correction for multiple testing, we detected 102 significant cis-eQTL (Supplementary Table S5). Of those, 90 were associations between SNPs in high LD, located in the same QTL region on chromosome 16, and the expression of a single gene, BG-like antigen 1 (BG1) (Fig. 3A). This eQTL had a log10 allelic-fold-change of 2.03. Four more cis-eQTLs were identified for ENSGALG00000032221 and three novel gene transcripts on chromosome 16 (ENSGALT00000065054, ENSGALT00000049453 and ENSGALT00000085167). Another three significant cis-eQTLs were detected within TMEM11 (transmembrane protein 11) and the COPS3 (COP9 signalosome subunit 3), two genes located within the QTL region on chromosome 14 (position 4,552,835–4,560,698 and 4,767,396–4,781,731, respectively) (Fig. 3B,C, Supplementary Table S5).

Expression QTL analysis results. Boxplots showing the expression of BG1 (4A), TMEM11 (4B) and COPS3 (4C) genes depending on the genotypes of SNPs acting as cis-elements. On the x-axis, "0", "1" and "2" represent the number of copies of the non-reference allele, and on the y-axis the expression of each gene (in Transcripts Per Million, TPM), is represented after mean-centering and scaling.
Trans-analysis
We detected a total of 13 significant trans-eQTLs within the QTL region on chromosome 19 and two on chromosome 26 (Supplementary Table S6). Most of these predicted trans-acting elements are for genes related with metabolic processes. The trans-acting SNP on chromosome 26 is for a microRNA (gga-mir-1553) located on chromosome 7, close to the peak of a previously identified QTL for C. jejuni resistance using a back-cross population of inbred lines 61 and N19.
Allele-specific expression analysis
If an individual is heterozygous for a cis-acting SNP it is expected that the two alleles of the gene will be expressed unequally causing allelic expression imbalance. To verify the cis-QTLs detected above, and identify additional ones, we identified genetic variation within the QTL regions identified by the GWAS and RHM using the RNA-Seq data and performed allele-specific expression (ASE) analysis for all the SNPs located within these regions. Several significant ASE events were identified in all QTL regions (mean P value ≤ 0.05 with at least 4 heterozygous animals). Specifically, 14 significant ASE events were identified for 3 genes located on chromosome 14, 30 for 6 genes on chromosome 16, 11 for 2 genes and one microRNA (gga-mir-142) on chromosome 19, and 35 for 5 genes on chromosome 26 (Supplementary Table S7). A highly significant ASE event was identified on chromosome 14 (for the QTL located at 12 MB) for chloride voltage-gated ion channel 7 (CLCN7). ASE results on chromosome 16 were consistent with the presence of a cis-acting polymorphism in BG1, with 6 SNPs in high-LD showing allelic imbalance (P < 10–13). Moreover, ASE analysis highlighted potential cis-acting polymorphisms for other genes of interest in the region, namely MHC class 1 (BF1 and BF2) and class 2 (BLB2 and BLB1) (Fig. 4A–C). Within BF2, 13 different SNPs showed highly significant ASE, with P values < 10–305 (Fig. 4A). Chromosomes 19 and 26 also contain several immune-related genes showing significant ASE: angiopoietin-related protein 2 (ANGPTL2), C–C motif chemokine ligand 4 (CCL4), complement C3b/C4b receptor 1-like (CR1L), C4b-binding protein (C4BP), polymeric immunoglobulin receptor (PLGR) and BCL2 antagonist/killer 1 (BAK2).

Allele specific expression (ASE) analysis results. Bar plots showing the allele specific expression results for BF2 (5A), BLB1 (5B) and BLB2 (5C) genes. Each column represents gene expression levels, measured as read counts, for each allele (reference (red) vs non-reference (green) allele). Gene expression levels have been plotted against each individual animal.
Validation of selected differentially transcribed genes
Specific qRT-PCR assays were devised to validate the transcript levels measured by RNA-Seq using the same RNA samples. Four genes located in the MHC region on chromosome 16 (BF1, BF2, ENSGALG00000024357 and ENSGALG00000032221), were found to be differentially transcribed in the caecal tonsils of birds of predicted resistant or susceptible genotypes with divergent caecal Campylobacter load, after adjusting for sex and seasonality. This confirmed that the expression of each gene differed significantly between resistant and susceptible birds (P ≤ 0.05 after Tukey’s HSD post-hoc test adjustment). The correlation estimates (r2) between the quantified by qRT-PCR and RNA-Seq expression levels of BF1, BF2, ENSGALG00000024357 and ENSGALG00000032221 were 0.85, 0.78, 0.83 and 0.71, respectively (Supplementary Fig. S5).
Pathway, network and functional enrichment analyses
Pathway analysis using encoded genes in the candidate regions for Campylobacter resistance
Based upon the significant heritability estimate and the large amount of genetic variance accounted for by the identified SNPs, we reasoned that the corresponding QTL regions may contain genes contributing to common pathways associated with resistance to Campylobacter colonisation. We therefore identified the sets of annotated genes lying within QTL regions and sought evidence of gene set enrichment. Ingenuity Pathway Analysis (IPA) (https://digitalinsights.qiagen.com/products-overview/discovery-insights-portfolio/analysis-and-visualization/qiagen-ipa) found these genes to be enriched for pathways involved in innate and adaptive immune responses, antigen presentation, inflammatory responses, calcium signalling, renin–angiotensin signalling, epithelial cell signalling and interactions (Fig. 5). Moreover, three networks of molecular interactions related to ‘immunological diseases’, ‘cell death and survival’, and ‘molecular transport and protein trafficking’ were constructed using the list of genes in the candidate regions (Fig. 6). Core genes featured in these networks included immune-related genes (such as NFkB-complex, RAS, ITPR, CCL5, CCL4, interferon alpha and beta), MHC-related genes (such as TAP1, TAP2, TAPBP) and calcium (Ca+) regulated genes. We subsequently extracted the gene ontology terms for each of these genes and performed functional annotation clustering analysis. The genes were organised into 41 clusters, each given an enrichment score (ES). The first (ES = 4) and the second (ES = 3.5) clusters were both enriched for genes functionally annotated as involved in ‘antigen processing and presentation via MHC class I and class II molecules’ (including BF1, BF2, BLB1, BLB2, DMB1, DMB2, TAP1, and TAP2) (Supplementary Table S8).

Pathway analysis using the IPA software (https://digitalinsights.qiagen.com/products-overview/discovery-insights-portfolio/analysis-and-visualization/qiagen-ipa/). The most highly represented canonical pathways derived from genes located within the candidate regions for Campylobacter colonisation resistance in commercial chickens are shown. The solid yellow line represents the significance threshold. The line joining squares represents the ratio of the genes represented within each pathway to the total number of genes in the pathway.
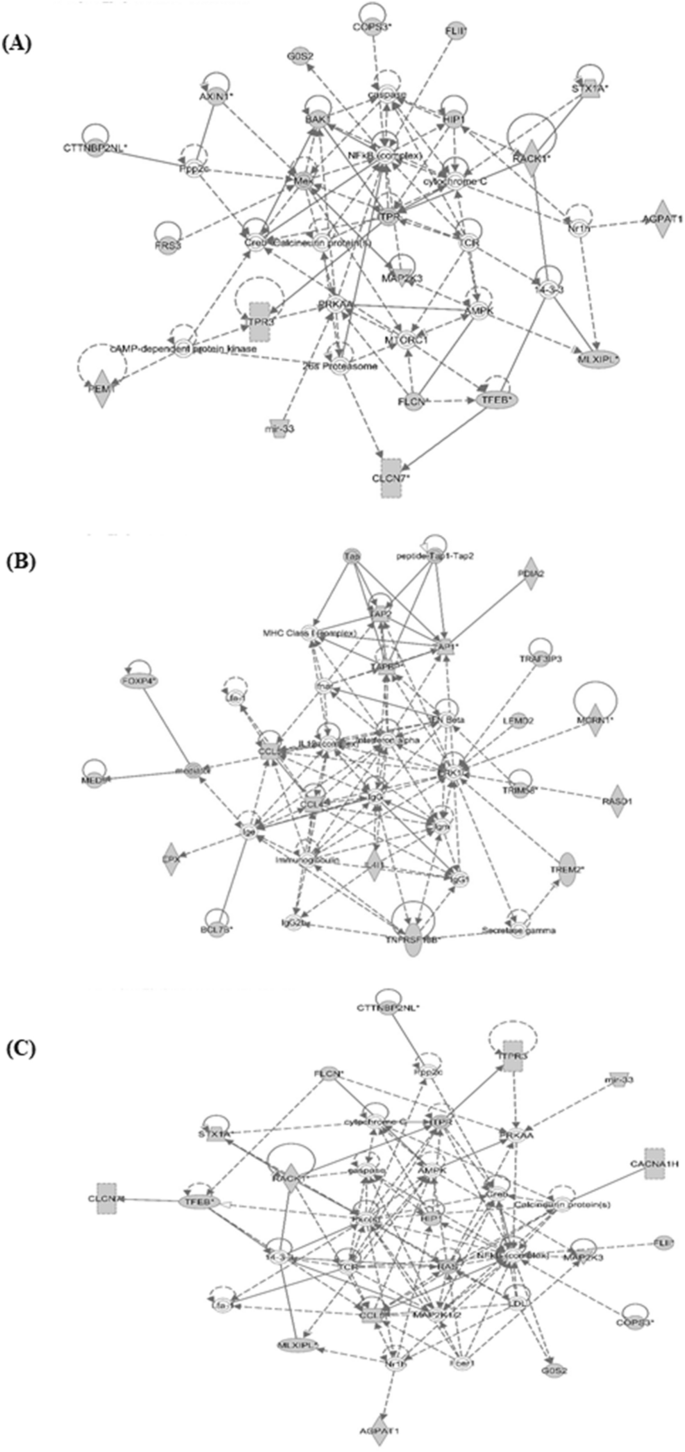
Network analysis using the IPA software (https://digitalinsights.qiagen.com/products-overview/discovery-insights-portfolio/analysis-and-visualization/qiagen-ipa/). Three networks, related to immunological disease (A), cell death and survival (B), and molecular transport and protein trafficking (C) are shown that illustrate the molecular interactions between the products of candidate genes selected from QTL regions for Campylobacter colonisation resistance in commercial chickens. Arrows with solid lines represent direct interactions and arrows with broken lines represent indirect interactions. Genes with white labels are those added to the IPA analysis because of their interaction with the target gene products.
Pathway analysis using DE genes in birds with different Campylobacter colonisation levels
Functional analysis of the DE genes using the IPA software showed significant enrichment for pathways related with immune response (interferon signalling, antigen presentation, immunodeficiency signalling) and metabolism (protein ubiquitination, glutamate degradation). Moreover, one network of molecular interactions related to ‘cell death and survival, and organismal injury and abnormalities’ was constructed based on the DE genes. A core gene in this network was HSP90AB1 which encodes a member of the heat shock protein 90 family. Functional annotation clustering of these genes uncovered significant enrichment (E.S. = 1.2) for one gene cluster related with immune response, defence response, response to stress, symbiosis, encompassing mutualism through symbiosis, interspecies interactions between organisms.
Discussion
We sought to investigate the genetic basis of resistance of chickens to Campylobacter colonisation and evaluate the potential for selective breeding of poultry with enhanced resistance to control Campylobacter at farm level. Using samples from 3000 commercial chickens exposed to Campylobacter, we detected heritable variation associated with caecal Campylobacter levels and identified genomic markers and regions associated with colonisation that can be used to inform breeding decisions. Candidate genes, cis- and trans- acting elements, canonical pathways and networks, and MHC haplotypes that were implicated in resistance to Campylobacter colonisation were also identified.
We estimated significant heritability (h2 = 0.11) for caecal Campylobacter colonisation. This was lower compared to a previous estimate for this trait using the progeny of crosses of inbred White Leghorn chicken lines with differing resistance to Campylobacter colonisation (h2 = 0.25)19. The difference is likely attributable to the use of field data on naturally colonised broilers in the present study compared to experimental challenge of inbred lines. The heritability of resistance to Campylobacter colonisation is similar to that observed for other livestock pathogens and diseases, such as bovine tuberculosis (h2 = 0.09–0.17)31,32 and bovine and ovine mastitis (h2 = 0.10–0.20)33, where the development of genetic evaluations to guide breeding decisions was deemed to be feasible.
In a previous study of the same commercial chicken population, Campylobacter colonisation levels were not significantly phenotypically and genetically correlated with key production traits such as body weight, nutrient absorption and gut health; this highlights that the presence of Campylobacter in the caeca of chickens was not detrimental to the birds studied and that co-selection for Campylobacter colonisation resistance with other breeding goals is feasible26. However, the low heritability estimates indicate that a large proportion of phenotypic variance in Campylobacter colonisation is determined by non-genetic factors that merit further investigation. Moreover, the high frequency of resistance-associated alleles in the studied population of commercial birds suggests limited scope for improvement in the specific pedigree line.
In the present study, we assumed a uniform exposure of birds to Campylobacter during the 16 months of sampling. A seasonal, batch and sex effect on Campylobacter colonisation was detected and fitted in the GWAS, eQTL and differential expression models of analysis to adjust for these sources of systematic variation. Season has been previously reported to affect the colonisation phenotype in chickens34,35, with this linked to an elevated incidence of human campylobacteriosis during summer36. The basis of this seasonal effect is not entirely clear37. Moreover, while Campylobacter was routinely detected in the environment of the birds sampled, we cannot preclude the possibility that the bacterial species and sequence types present varied over time.
Consistent with a previous report of paternal effects on caecal C. jejuni colonisation in broilers12, we detected a significant effect of sex on the colonisation phenotype, with males having higher mean caecal counts of Campylobacter. Male susceptibility to Campylobacter has been also reported in human and mouse studies38,39. Sex-related differences in immune response and survival rate of broiler chickens have been reported for a range of pathogens in chickens40. Male broilers were found to be more susceptible to infectious disease and this was attributed to a less efficient immune response compared to females40. Moreover, there are differences in gene expression and responsiveness to bacterial lipopolysaccharide between macrophages from males and females that have been attributed to the lack of dosage compensation of the genes on the Z chromosome, which includes the interferon cluster41. Apart from seasonality and sex, other non-genetic factors may explain the observed variation in Campylobacter colonisation, including strain variation42, the time and level of exposure relative to sampling43, coinfections44, variation in the gut microbiota45,46, and diet and feed intake47,48. Our results should be interpreted in the context of the limitations and advantages of field-based genome-wide association studies49,50. Compared to controlled challenge experiments, unknown and uncontrolled exposure to non-genetic factors may reduce the power of a field study but do not constitute a fatal flaw in demonstrating host genetic differences in resistance49. Moreover, the demonstration of heritable resistance in field studies that simulate commercial practice is highly relevant to the production system into which selectively-bred birds would be introduced. Ideally we would challenge age-matched birds of predicted resistant or susceptible genotypes synchronously by oral gavage with defined doses of a range of C. jejuni strains to validate predictions. However, the number of generations between the population used for the genome-wide association study and broiler flocks currently available, together with the low frequency of susceptibility-associated variation, would make it challenging to validate associations between specific genomic regions and caecal C. jejuni colonisation.
In line with our previous findings using the progeny of crosses of inbred chicken lines19, the major histocompatibility complex region on chromosome 16 was implicated in resistance to Campylobacter colonisation in commercial broilers. Using genomic data we were able to identify a strong QTL in the MHC region explaining most of the trait-associated genetic variation, and the QTL overlapped with expression QTLs detected by RNA-Seq analysis of caecal tonsil tissue from birds at the extremes of the colonisation phenotype. Within this QTL region, 100 SNP markers were found in high LD and collectively corresponded to three MHC haplotypes. These haplotypes were relatively stable, since only one recombination event was identified in the TRIM region of MHC, and they were associated with distinct colonisation phenotypes, with the more prevalent one associated with colonisation resistance accounting for 1 log10 difference in the Campylobacter levels.
Despite the MHC region being polymorphic and repetitive, making it challenging to identify causative genes and mutations underlying disease resistance, our analyses revealed a number of candidate genes for Campylobacter resistance that warrant further investigation. Specifically, the eQTL and ASE analyses showed evidence for cis-acting elements related with the expression of the BG-like antigen 1 (BG1) gene, major (BF2) and minor (BF1) MHC class I genes, the major (BLB2) and minor (BLB1) MHC class II beta chain genes. In addition, the BF2, BF1, BG1 and two BG-like genes were found to be differentially expressed in chickens with different caecal Campylobacter levels. The major MHC class II beta chain gene (BLB2) gene is widely expressed at high levels in hematopoietic cells, whereas the minor MHC class II beta chain gene (BLB1) is generally poorly expressed, although highly expressed in spleen, intestinal epithelial cells, and particularly the caecal51. The CIITA transactivator gene that controls expression of MHC class II genes52 has been found to be differentially expressed in chickens with high and low C. jejuni colonisation levels in a previous experimental RNA-Seq study of the caecal tissue16. Previous human studies have associated MHC class II alleles as genetic risk factors for inflammatory neuropathies secondary to C. jejuni infection53. C. jejuni can increase surface expression of MHC class II on murine bone marrow-derived dendritic cells and activate them to induce T cell responses54, however the extent to which this applies in chickens is ill-defined. In that study, MHC class I genes BF1 and BF2 were also found to be differentially expressed in the caeca of chickens with high and low C. jejuni levels16. Furthermore, similar to our findings, MHC-related BG genes have also been reported to be differentially transcribed in the spleen of two chicken lines that differ in susceptibility to C. jejuni colonisation. The BG region of MHC is very repetitive, and it is therefore difficult to distinguish specific BG genes due to copy number variation55. In mammals, gammadelta (γδ) T cells recognize a wide variety of ligands, among members of the butyrophilin family encoded by BG genes, and recent studies suggest that the same may apply in chickens56. In mammals, γδ T cells enriched in the intestinal epithelium and play a key role in control of mucosal immunity and inflammation57. Indeed, human γδ T cells proliferate after exposure to C. jejuni and have been implicated in GBS following C. jejuni infection58. The role of γδ T cells and recognition of BG ligands during Campylobacter infection in poultry therefore merits further study.
In the present study, network analyses detected interferon signalling among the pathways associated with resistance. Interferon-γ (IFN-γ) has been reported to be induced following Campylobacter infection of avian cells59 and chickens in a breed-dependent manner60, and may underlie breed-specific differences in gut inflammation and pathology20,61. Furthermore, multiple interferon-related genes were found to be differentially expressed in the caecal transcriptome of chickens with high and low C. jejuni colonisation levels in a previous RNA-Seq study16. Interestingly, the major class I and II molecules, as well as other MHC related genes have interferon response elements (IREs) in their promoters which respond to IFN-γ and therefore their differential expression may be subject to interferon regulation. Furthermore, our recent analysis of whole genome sequence of commercial broilers and layers, and the transcriptome of isolated macrophages from a broiler-layer F2 sibling backcross, also revealed substantial differences in the expression of interferon-regulatory factors (IRF) family members as well as in the BLB1 and BLB2 genes between individual birds62 that could underlie this phenotype.
The present study identified two distinct QTLs on chromosome 14, both located within the interval of a previously identified QTL for Campylobacter resistance using a backcrossed ([61 × N] x N) population of inbred lines 61 and N19. One of these QTLs (located at 12 Mb) overlaps with a QTL identified for the same trait using a ninth generation advanced intercross population of these lines19, as well as a QTL for resistance to Salmonella colonisation in chickens27, suggesting that a mechanism of resistance common to both pathogens may exist. CREB binding protein (CREBBP), a key immune regulatory protein implicated in Salmonella resistance in chickens63, lies in close proximity to the marker of this QTL. In the present study, a mutation (14:12,556,836, C to T, splice donor variant) with a predicted high impact on the encoded protein of this gene was significantly (P < 0.05) associated with Campylobacter colonisation resistance (data not shown). Furthermore, pathway analysis in the present study confirmed the enrichment for CREB signalling reported previously in inbred lines19. The other QTL region (located close to 5 Mb) on chromosome 14 in the present study overlapped with an expression QTL for Campylobacter resistance. Specifically, the SNP marker significantly associated with Campylobacter resistance was also a cis-acting element for two genes (upregulates COPS3 and downregulates TMEM11). The protein encoded by COP9 signalosome complex subunit 3 gene possesses kinase activity that acts as a site for complex phosphorylation of many regulators involved in signal transduction such as I-kappa-B-alpha, p105, and c-Jun64. This protein is part of a complex that plays a key role in diverse cellular processes including cytokine signalling and antigen induced responses65.
Several immune-related genes in the QTL regions on chromosomes 19 and 26 showed evidence of allele-specific expression. Among these genes were the polymeric immunoglobulin receptor (PLGR) which is highly expressed in intestinal epithelial cells and mucosa, and plays a crucial role in the transcytosis of polymeric soluble immunoglobulins and immune complexes to the gut mucosal surface66. Genes and pathways involved in the immunoglobulin production and function were reported to be upregulated in chickens relative resistance to C. jejuni16. PLGR has been associated with intestinal immune defence against the lumen-dwelling parasite Giardia in mice67. The QTL for Campylobacter resistance identified on chromosome 26 encompasses the calcium/calmodulin-dependent protein kinase IG which belongs to a calcium-triggered signalling cascade and phosphorylates the transcription factor CREB (https://www.uniprot.org/uniprot/Q96NX5). A previous GWAS study of C. jejuni resistance identified a suggestive significant association proximal to the calmodulin gene17. Intracellular calcium levels in the intestinal epithelium are affected by C. jejuni in some lines23, however the extent to which this affects bacterial colonisation, or is induced by it, is unclear.
Our pathway analysis also showed enrichment for other innate and adaptive immune related pathways in association with Campylobacter resistance. Of increased interest is the pathway related with IL-17 signalling since several previous studies suggested that IL-17 signalling and TH-17 responses play a role in resistance to Campylobacter colonisation in chickens following experimental inoculation13,16,19,61,68,69. Future studies could seek to characterise the timing and magnitude of such responses in birds of predicted resistant or susceptible genotypes upon exposure. An important factor to be considered in future studies of this type is to characterise any concurrent infections and the subsequent relationship with Campylobacter and the host immune response. Pathway analysis also detected enrichment for the renin–angiotensin system, components of which have been reported to be upregulated in a chicken line exhibiting relative resistance to Campylobacter infection16 and in the gastric mucosa of Helicobacter pylori infected humans70.
The advent of rapid genome-editing technology, for example reliant on modification of primordial germ cells implanted into sterile recipients during embryo development71, provides a potential means to validate the role of genetic variation in Campylobacter resistance.
Conclusion
Our comprehensive genomic analyses estimated significant heritability of Campylobacter resistance in a commercial broiler population and identified QTLs, transcripts and networks in common with previous studies. A clear association with the MHC locus on chromosome 16 was identified, including detection of differentially transcribed MHC-related genes in the QTL interval in birds at the extreme of colonisation phenotype. The low frequency of susceptibility-associated alleles in the broiler population studied precluded the selection of predicted resistant or susceptible birds for experimental challenge. The QTLs identified accounted for a c. 2 log10 CFU/g difference in caecal C. jejuni colonisation, sufficient to provide a significant reduction in the predicted number of human cases based on mathematical modelling10. However, resistance-associated variation was already highly prevalent in the population studied and environmental factors, which played a far greater role in the phenotype, may be more amenable to rapid and effective intervention. A multifactorial approach addressing both genetic and non-genetic factors is therefore needed to reduce Campylobacter levels in poultry and the incidence of the human disease attributed to this source.
Methods
Animals and sampling
A total of 3000 birds of an outbred pure-bred commercial broiler line from the Aviagen breeding programme were housed within a non-bio-secure environment (referred to as the sib-test environment) that aimed to resemble broader commercial conditions and where full siblings and half siblings of selection candidates are placed72. Birds were fed standard maize-based starter, grower and finisher diets in line with industry practice. All birds throughout the study received the same vaccinations as per commercial regime and were reared under the same management practices and environmental parameters26. Birds were naturally exposed to Campylobacter spp. under these conditions, as confirmed by routine sampling of the environment using the ‘boot sock’ method described previously25. Birds were culled and phenotyped when they reached the age of five weeks. This was performed in batches of 100 birds (50 males and 50 females) giving a total of 3000 birds phenotyped over a period of 16 months. After culling of birds by cervical dislocation by trained personnel, cardiac blood was collected for DNA extraction, the two caeca were collected for enumeration of viable Campylobacter, and the two caecal tonsils were stored in RNAlater (Thermo Fisher Scientific, Waltham, USA) for subsequent RNA extraction.
Phenotyping and genotyping
To enumerate Campylobacter, serial ten-fold dilution series of weighed contents of the two caeca were separately prepared to 10–7 in phosphate-buffered saline and 100 μL of each dilution plated to modified charcoal deoxycholate (mCCDA) agar supplemented with cefoperazone (32 mg/L) and amphotericin B (10 mg/L; Oxoid), followed by incubation for 48 h under microaerophilic conditions (5% O2, 5% CO2, and 90% N2) at 41 °C. Dilutions were plated in duplicate and colonies with morphology typical of Campylobacter were counted and expressed as CFU/g. The theoretical limit of detection by the method used was 100 CFU/g. In instances where no colonies were observed after direct plating, a Campylobacter load equal to the theoretical limit of detection was assumed, as enrichment to confirm the absence of Campylobacter in caecal contents was not performed.
All the birds were genotyped with a proprietary 50K high-density genome-wide SNP array and then imputed using AlphaImpute73,74 to the 600K SNP Affymetrix Axiom HD array75 based on parent, grand-parent and great-grand-parent 600K SNP Affymetrix data. Of 3000 birds sampled, genotypes for 2718 birds were successfully imputed. Imputation failures likely reflect a lack of compatibility between the pedigree information and the genotypic data.
Heritability analysis
As caecal Campylobacter levels were not normally distributed, all counts were log-transformed and expressed as log10 CFU/g. Genetic parameters were estimated for caecal Campylobacter colonisation resistance using a mixed linear univariate model that included the date of sampling and the sex as fixed effects, and the random effect of the individual birds linked to each other with the pedigree genetic relationship matrix. Body weight and maternal effects were also tested but their effects on Campylobacter levels were not significant and therefore were not included in the final model. Genetic relationships between birds were calculated using a three generations pedigree and included in the analyses. The heritability of the trait was calculated as the ratio of the additive genetic variance to the total phenotypic variance. The analysis was performed using ASReml v4.076.
Genome-wide association study
The 50K and 600K SNP genotype data were subjected to quality control measures using PLINK v1.0977 with parameters of minor allele frequency > 0.05, call rate > 95% and Hardy–Weinberg equilibrium (P > 10−6). After quality control, 37,498 and 288,381 SNP markers remained for further analysis (from the 50K and 600K datasets, respectively). Positions of SNP markers were obtained using the GalGal5 annotation, available via the Ensembl Genome Browser (http://www.ensembl.org). Population stratification was investigated using a genomic relatedness matrix generated from all individuals. This was converted to a distance matrix that was used to carry out classical multi-dimensional scaling analysis (MSA) using the R package GenABEL78 to obtain its principal components. The GEMMA v0.98.1 algorithm79 was used to perform GWAS analyses using a standard univariate linear mixed model in which date of sampling and sex were fitted as fixed effects and the genomic relatedness matrix among individuals was fitted as a polygenic random effect. After Bonferroni correction for multiple testing, significance thresholds for analysis with the 50K array were P ≤ 1.33 × 10⁻⁶ and P ≤ 2.66 × 10⁻⁵ for genome-wide significant levels (i.e., P ≤ 0.05) and suggestive significant levels (namely one false positive per genome scan), respectively, corresponding to − log10(P) of 5.87 and 4.47. The significance thresholds for the 600K array after Bonferroni correction were P ≤ 1.73 × 10⁻⁷ and P ≤ 3.46 × 10⁻⁶ corresponding to − log10(P) of 6.76 and 5.45. The extent of linkage disequilibrium (LD) between significant SNPs located on the same chromosome regions was calculated using the r-square statistic of PLINK v1.0977.
Individual markers found to be significant in the previous step were further examined with a mixed model that included the same fixed effects as used in the GWAS, the fixed effect of the corresponding SNP locus genotype and the random effect of the animal. Additive (a) and dominance (d) effects, and the proportion of total phenotypic variance (PVP) due to each SNP locus were calculated as follows:
where AA, BB and AB were the predicted trait values of the respective genotypic classes, p and q were the allelic frequencies of A and B at the SNP locus, and VP was the total phenotypic variance of the trait. The latter were estimated with the same model used for the heritability estimate. All analyses were run with ASReml v4.076.
Regional heritability mapping
RHM analyses were performed using DISSECT80 fitting genomic regions of 20 SNPs in sliding windows along each chromosome with the same fixed effects as the ones used in the single SNP GWAS described above. The significance of genomic regions was assessed with the likelihood ratio test statistic, which was used to compare the RHM model where both the whole genome and a genomic region were fitted as random effects against a base model that excluded the latter effect. Only the 50K data was analysed with this method. A total of 1915 regions were tested across the genome. After adjustment for multiple testing, using the Bonferroni correction, significance thresholds were P ≤ 2.63 × 10⁻⁵ and P ≤ 5.26 × 10⁻⁵ for genome-wide levels (P ≤ 0.05) and suggestive levels (namely one false positive per genome scan), respectively, corresponding to − log10(P) of 4.57 and 3.27.
SNP and candidate region annotation
All significant SNPs identified in the GWAS and RHM analyses were mapped to the GalGal5 reference genome and annotated using the Ensembl Variant Effect Predictor (http://www.ensembl.org/Tools/VEP). Moreover, all the genes that were located within the 20 SNP windows found to be significant by RHM; and the 250 kb 5′ and 3′ regions of the significant SNP markers identified by the GWAS were annotated using GalGal5 data obtained by the BioMart data mining tool (http://www.ensembl.org/biomart/martview/). This allowed us to catalogue all the genes that were located in the vicinity of the identified significant SNP markers for Campylobacter colonisation resistance.
Transcriptomic analyses
Total RNA was prepared from the caecal tonsils of 23 broilers, selected on their genotype (allele combination in the significant identified markers) and caecal Campylobacter load, after correction for other sources of systematic variation (sex and date of sampling). Details of the birds selected are shown in Supplementary Table S4. RNA was extracted using the RNeasy Mini Kit (Qiagen Hilden, Germany) according to manufacturer’s instructions. The resultant RNA was checked for quality using the Agilent Tapestation 2200, and all samples were of high quality with RNA Integrity Numbers (RIN) greater than 9. Library preparation was performed by Edinburgh Genomics (http://genomics.ed.ac.uk/) using the Illumina TruSeq mRNA (poly-A selected) library preparation protocol (Ilumina; Part: 15031047, Revision E). The mRNA was sequenced by Edinburgh Genomics at a depth of > 40 million strand-specific 75 bp paired-end reads per sample, using an Illumina HiSeq 4000. Expression levels for the 23 samples were estimated using Kallisto v0.43.081. Rather than aligning RNA-seq reads to a reference genome, reconstructing transcripts from these alignments and then quantifying expression as a function of the reads aligned, Kallisto employs a ‘lightweight’ algorithm, which first builds an index of k-mers from a known transcriptome. As a reference transcriptome, we obtained from Ensembl v89 the set of GalGal5 cDNAs and ncRNA transcripts (ftp://ftp.ensembl.org/pub/release-89/fasta/gallus_gallus/cds/Gallus_gallus.Gallus_gallus-5.0.cds.all.fa.gz, and ftp://ftp.ensembl.org/pub/release-87/fasta/gallus_gallus/ncrna/Gallus_gallus.Gallus_gallus-5.0.ncrna.fa.gz; n = 38,118 total transcripts, representing 10,846 protein-coding genes and 937 non-coding genes). Expression levels were then estimated directly (i.e., in an alignment-free manner) by quantifying exact matches between reads and k-mers. Expression is reported per transcript as the number of transcripts per million, and is summarised to the gene level as described previously82.
Differential expression
Differential expression analysis was run on caecal tonsils from birds with high, intermediate and low Campylobacter load, after adjusting for sex and seasonality, using the Kallisto output with the R/Bioconductor package ‘Sleuth’ v0.29.083. Differential expression was considered significant for FDR corrected P values ≤ 0.05 and suggestive significant for uncorrected P values ≤ 0.001. Additional differential expression analyses were performed using the qRT-PCR output for a subset of the genes found to be significantly differentially expressed in the initial RNA-Seq analysis. Least square mean pairwise comparisons between different Campylobacter levels were conducted. Tukey’s HSD post-hoc test adjustment was applied at a significance level of 0.05.
Expression QTL analysis
eQTL analyses were performed using the R package Matrix eQTL v2.1.084. The number of transcripts per million, derived from Kallisto analysis as described above, were used as a measure of gene expression. Several covariates (log10 transformed Campylobacter counts, sex, date of sampling) were included in the association analysis. Cis- and trans-eQTLs were obtained, considering cis-acting SNPs to be within 100 kb from the 5′ start or 3′ end of a known gene. P values were corrected using false discovery rate (FDR) estimated with Benjamini–Hochberg procedure. SNP–gene expression association was considered significant for FDR corrected P values ≤ 0.05. For the significant cis-eQTL we estimated effect size using the log allelic fold-change (aFC) measurement. aFC is defined as the log-ratio between the expression of the haplotype carrying the alternative variant allele to the one carrying the reference allele and was calculated as described85. Briefly, the model assumes an additive model of expression in which the total expression of a gene in a given genotype group is the sum of the expression of the two haplotypes: e(genotype) = 2e_r, e_r + e_a, and 2e_a for reference homozygotes, heterozygotes, and alternate homozygotes, respectively, where e_r is the expression of the haplotype carrying the reference allele, and e_a the expression of the haplotype carrying the alternative allele. The allelic fold change k is defined as e_a = k e_r where 0 < k < ∞. aFC is represented on a log2 scale as s = log2 k.
SNP calling and allele-specific expression analysis
In order to perform allele-specific expression analysis we aligned RNA-Seq reads to the reference genome and called the genomic variance in the previously identified QTL regions. Quality filtering and removal of residual adaptor sequences from the raw reads was first performed using Trimmomatic v0.3886. Leading and trailing bases with a Phred score less than 20 were removed, and the read trimmed if the average Phred score over a sliding window of four bases was less than 20. Only reads where both forward and reverse pairs were longer than 36 bp post-filtering were retained. Filtered reads were mapped to the chicken genome (Gallus_gallus-5.0; Genbank assembly GCA_000002315.3)87 using STAR v2.6.1a88, with the maximum number of mismatches allowed for each read pair set to 10% of the trimmed read length, and minimum and maximum intron lengths set to 20 bases and 1 Mb, respectively. PCR duplicates were marked and SNPs were identified and genotyped called for individual samples using samtools v1.689, ignoring reads with mapping quality < 20 and bases with Phred quality scores < 20. SNPs within 5 bp of an indel, with mapping quality < 20, minor allele frequency (MAF) < 0.05 or where < 4 reads supported the alternative allele were also discarded. The SNPs located within the QTL regions identified by the GWAS were annotated using Variant Effect Predictor, as described above.
Allelic-specific expression was assessed using the R package AllelicImbalance v1.24.090. For every SNP in a region of interest, read counts were obtained for each allele present in a heterozygous animal, provided it was present in > 4 and < 17 heterozygous animals (i.e. 75% of the total animals). SNPs with less than 10 reads were excluded. A binomial test was performed to assess the significance of the difference in allelic count. Allele-specific expression was considered significant if the mean P value across all heterozygotes was ≤ 0.05.
Quantitative RT-PCR validation of differentially expressed genes
First strand synthesis was performed using 1 μg of total RNA and the Verso cDNA Synthesis Kit (Thermo Scientific) according to the manufacturer’s instructions. qPCR reactions were performed using a hot-start EvaGreen dye-based master mix (the Forget-Me-Not qPCR Master Mix (Biotium), https://biotium.com/technology/pcr-dna-amplification/forget-qpcr-master-mix/) in 20 μL volumes containing 1 × Forget-Me-Not qPCR Master Mix, 0.5 μM of each forward and reverse primer, 50 nM of ROX reference dye and 2 μL of cDNA at a 1:10 dilution in template buffer. Gene-specific primers were designed and purchased from Sigma. Primer sequences are detailed in Supplementary Table S9. The amplification and detection of specific DNA was achieved using the AB 7500 FAST Real-Time PCR System (Applied Biosystems) and the following programme: 95 °C for 2 min followed by 40 cycles of 95 °C for 5 s then 60 °C for 30 s. To confirm the presence of a single PCR product, melting curves were generated by one cycle of 60 °C for 1 min, increasing to 95 °C in 1% increments every 15 s. Samples were run in triplicate and each qPCR experiment contained 3 no-template control wells and a fivefold dilution series in duplicate of pooled caecal tonsil derived cDNA from several birds from which standard curves were generated. The expression of genes were normalised to the geometric mean of three reference genes found previously to be stably expressed in chicken lymphoid organs; r28S, TBP and GAPDH91.
Pathway, network and functional enrichment analyses
Identification of potential canonical pathways and networks underlying the candidate genomic regions associated with Campylobacter colonisation resistance was performed using the Ingenuity Pathway Analysis (IPA) programme (https://digitalinsights.qiagen.com/products-overview/discovery-insights-portfolio/analysis-and-visualization/qiagen-ipa/). IPA constructs multiple possible upstream regulators, pathways and networks that serve as hypotheses for the biological mechanism underlying the phenotypes based on a large-scale causal network derived from the Ingenuity Knowledge Base. IPA then infers the most suitable pathways and networks based on their statistical significance, after correcting for a baseline threshold92. The IPA score in the constructed networks can be used to rank these networks based on the P values obtained using Fisher’s exact test [IPA score or P score = – log10(P value)].
The gene list for Campylobacter colonisation resistance was also analysed using the Database for Annotation, Visualization and Integrated Discovery (DAVID) v6.893. Gene ontology (GO) was determined and functional annotation clustering analysis was performed. The Gallus gallus background information is available in DAVID and was used for the analysis. The enrichment score (ES) of the DAVID package is a modified Fisher exact P value calculated by the software, with higher ES reflecting more enriched clusters. An ES greater than 1 means that the functional category is overrepresented.
Ethical approval
As these were commercial birds from an industry breeding programme and were not experimentally inoculated, the study was conducted outside the auspices of the Animals (Scientific Procedures) Act 1986, but was nevertheless subject to scrutiny and approval by the Animal Welfare & Ethical Review Body of The Roslin Institute, University of Edinburgh.
Data availability
The sequencing and expression data from caecal tonsils of chickens with different levels of Campylobacter colonisation in their caeca are deposited in the European Nucleotide Archive under accession number PRJEB22580.
References
Havelaar, A. H. et al. World Health Organization global estimates and regional comparisons of the burden of foodborne disease in 2010. PLoS Med. 12, e1001923. https://doi.org/10.1371/journal.pmed.1001923 (2015).
Tam, C. C. et al. Longitudinal study of infectious intestinal disease in the UK (IID2 study): incidence in the community and presenting to general practice. Gut 61, 69–77. https://doi.org/10.1136/gut.2011.238386 (2012).
Tam, C. C. & O’Brien, S. J. Economic cost of Campylobacter, norovirus and rotavirus disease in the United Kingdom. PLoS ONE 11, e0138526. https://doi.org/10.1371/journal.pone.0138526 (2016).
O’Brien, S. J. The consequences of Campylobacter infection. Curr. Opin. Gastroenterol. 33, 14–20. https://doi.org/10.1097/mog.0000000000000329 (2017).
EFSA Panel on Biological Hazards. Scientific opinion on Campylobacter in broiler meat production: control options and performance objectives and/or targets at different stages of the food chain. EFSA J. https://doi.org/10.2903/j.efsa.2011.2105 (2011).
Kaakoush, N. O., Castano-Rodriguez, N., Mitchell, H. M. & Man, S. M. Global epidemiology of Campylobacter infection. Clin. Microbiol. Rev. 28, 687–720. https://doi.org/10.1128/cmr.00006-15 (2015).
FSA. Campylobacter contamination in fresh whole chilled UK-produced chickens at retail: the final results from Year 3 (August 2016 to July 2017). https://admin.food.gov.uk/sites/default/files/campyretailsurveyjul2017.pdf (2017).
Reich, F., Atanassova, V., Haunhorst, E. & Klein, G. The effects of Campylobacter numbers in caeca on the contamination of broiler carcasses with Campylobacter. Int. J. Food Microbiol. 127, 116–120. https://doi.org/10.1016/j.ijfoodmicro.2008.06.018 (2008).
Hansson, I., Pudas, N., Harbom, B. & Engvall, E. O. Within-flock variations of Campylobacter loads in caeca and on carcasses from broilers. Int. J. Food Microbiol. 141, 51–55. https://doi.org/10.1016/j.ijfoodmicro.2010.04.019 (2010).
Rosenquist, H., Nielsen, N. L., Sommer, H. M., Norrung, B. & Christensen, B. B. Quantitative risk assessment of human campylobacteriosis associated with thermophilic Campylobacter species in chickens. Int. J. Food Microbiol. 83, 87–103. https://doi.org/10.1016/s0168-1605(02)00317-3 (2003).
Stern, N. J., Meinersmann, R. J., Cox, N. A., Bailey, J. S. & Blankenship, L. C. Influence of host lineage on cecal colonization by Campylobacterjejuni in chickens. Avian Dis. 34, 602–606 (1990).
Li, X. et al. The paternal effect of Campylobacterjejuni colonization in ceca in broilers. Poult. Sci. 87, 1742–1747. https://doi.org/10.3382/ps.2008-00136 (2008).
Li, X. et al. Gene expression profiling of the local cecal response of genetic chicken lines that differ in their susceptibility to Campylobacterjejuni colonization. PLoS ONE 5, e11827. https://doi.org/10.1371/journal.pone.0011827 (2010).
Li, X. Y. et al. Caecal transcriptome analysis of colonized and non-colonized chickens within two genetic lines that differ in caecal colonization by Campylobacterjejuni. Anim. Genet. 42, 491–500. https://doi.org/10.1111/j.1365-2052.2010.02168.x (2011).
Li, X. et al. Systemic response to Campylobacterjejuni infection by profiling gene transcription in the spleens of two genetic lines of chickens. Immunogenetics 64, 59–69. https://doi.org/10.1007/s00251-011-0557-1 (2012).
Connell, S. et al. Avian resistance to Campylobacterjejuni colonization is associated with an intestinal immunogene expression signature identified by mRNA sequencing. PLoS ONE 7, e40409. https://doi.org/10.1371/journal.pone.0040409 (2012).
Connell, S. et al. Genome-wide association analysis of avian resistance to Campylobacterjejuni colonization identifies risk locus spanning the CDH13 gene. G3 3, 881–890. https://doi.org/10.1534/g3.113.006031 (2013).
Boyd, Y., Herbert, E. G., Marston, K. L., Jones, M. A. & Barrow, P. A. Host genes affect intestinal colonisation of newly hatched chickens by Campylobacterjejuni. Immunogenetics 57, 248–253. https://doi.org/10.1007/s00251-005-0790-6 (2005).
Psifidi, A. et al. The genomic architecture of resistance to Campylobacterjejuni intestinal colonisation in chickens. BMC Genomics 17, 293. https://doi.org/10.1186/s12864-016-2612-7 (2016).
Humphrey, S. et al. Campylobacterjejuni is not merely a commensal in commercial broiler chickens and affects bird welfare. mBio 5, e01364-e1314. https://doi.org/10.1128/mBio.01364-14 (2014).
Awad, W. A. et al. Campylobacterjejuni influences the expression of nutrient transporter genes in the intestine of chickens. Vet. Microbiol. 172, 195–201. https://doi.org/10.1016/j.vetmic.2014.04.001 (2014).
Awad, W. A. et al. Campylobacter infection in chickens modulates the intestinal epithelial barrier function. Innate Immun. 21, 151–160. https://doi.org/10.1177/1753425914521648 (2015).
Awad, W. A. et al. Increased intracellular calcium level and impaired nutrient absorption are important pathogenicity traits in the chicken intestinal epithelium during Campylobacterjejuni colonization. Appl. Microbiol. Biotechnol. 99, 6431–6441. https://doi.org/10.1007/s00253-015-6543-z (2015).
Awad, W. A. et al. Campylobacterjejuni colonization promotes the translocation of Escherichiacoli to extra-intestinal organs and disturbs the short-chain fatty acids profiles in the chicken gut. Poult. Sci. 95, 2259–2265. https://doi.org/10.3382/ps/pew151 (2016).
Gormley, F. J. et al. Campylobacter colonization and proliferation in the broiler chicken upon natural field challenge is not affected by the bird growth rate or breed. Appl. Environ. Microbiol. 80, 6733–6738. https://doi.org/10.1128/aem.02162-14 (2014).
Bailey, R. A. et al. Colonization of a commercial broiler line by Campylobacter is under limited genetic control and does not significantly impair performance or intestinal health. Poult. Sci. 97, 4167–4176. https://doi.org/10.3382/ps/pey295 (2018).
Calenge, F. et al. New QTL for resistance to Salmonella carrier-state identified on fowl microchromosomes. Mol. Genet. Genomics 285, 237–243. https://doi.org/10.1007/s00438-011-0600-9 (2011).
Calenge, F. et al. QTL for resistance to Salmonella carrier state confirmed in both experimental and commercial chicken lines. Anim. Genet. 40, 590–597. https://doi.org/10.1111/j.1365-2052.2009.01884.x (2009).
Tilquin, P. et al. A genome scan for quantitative trait loci affecting the Salmonella carrier-state in the chicken. Genet. Select. Evol. 37, 539–561. https://doi.org/10.1051/gse:2005015 (2005).
Nicolae, D. L. et al. Trait-associated SNPs are more likely to be eQTLs: annotation to enhance discovery from GWAS. PLoS Genet. 6, e1000888. https://doi.org/10.1371/journal.pgen.1000888 (2010).
Bermingham, M. L. et al. Evidence for genetic variance in resistance to tuberculosis in Great Britain and Irish Holstein-Friesian populations. BMC Proc. 5(Suppl 4), S15. https://doi.org/10.1186/1753-6561-5-s4-s15 (2011).
Banos, G. et al. Genetic evaluation for bovine tuberculosis resistance in dairy cattle. J. Dairy Sci. 100, 1272–1281. https://doi.org/10.3168/jds.2016-11897 (2017).
Banos, G. et al. The genomic architecture of mastitis resistance in dairy sheep. BMC Genomics 18, 624. https://doi.org/10.1186/s12864-017-3982-1 (2017).
Taylor, E. V. et al. Common source outbreaks of Campylobacter infection in the USA, 1997–2008. Epidemiol. Infect. 141, 987–996. https://doi.org/10.1017/s0950268812001744 (2013).
Friedrich, A., Marshall, J. C., Biggs, P. J., Midwinter, A. C. & French, N. P. Seasonality of Campylobacterjejuni isolates associated with human campylobacteriosis in the Manawatu region, New Zealand. Epidemiol. Infect. 144, 820–828. https://doi.org/10.1017/s0950268815002009 (2016).
Skarp, C. P. A., Hanninen, M. L. & Rautelin, H. I. K. Campylobacteriosis: the role of poultry meat. Clin. Microbiol. Infect. 22, 103–109. https://doi.org/10.1016/j.cmi.2015.11.019 (2016).
Sibanda, N. et al. A review of the effect of management practices on Campylobacter prevalence in poultry farms. Front. Microbiol. 9, 2002. https://doi.org/10.3389/fmicb.2018.02002 (2018).
Strachan, N. J. et al. Sexual dimorphism in campylobacteriosis. Epidemiol. Infect. 136, 1492–1495. https://doi.org/10.1017/s0950268807009934 (2008).
Gillespie, I. A. et al. Demographic determinants for Campylobacter infection in England and Wales: implications for future epidemiological studies. Epidemiol. Infect. 136, 1717–1725. https://doi.org/10.1017/s0950268808000319 (2008).
Leitner, G., Heller, E. D. & Friedman, A. Sex-related differences in immune response and survival rate of broiler chickens. Vet. Immunol. Immunopathol. 21, 249–260. https://doi.org/10.1016/0165-2427(89)90035-4 (1989).
Garcia-Morales, C. et al. Cell-autonomous sex differences in gene expression in chicken bone marrow-derived macrophages. J. Immunol. 194, 2338–2344. https://doi.org/10.4049/jimmunol.1401982 (2015).
Chaloner, G. et al. Dynamics of dual infection with Campylobacterjejuni strains in chickens reveals distinct strain-to-strain variation in infection ecology. Appl. Environ. Microbiol. 80, 6366–6372. https://doi.org/10.1128/aem.01901-14 (2014).
Newell, D. G. & Fearnley, C. Sources of Campylobacter colonization in broiler chickens. Appl. Environ. Microbiol. 69, 4343–4351. https://doi.org/10.1128/aem.69.8.4343-4351.2003 (2003).
Macdonald, S. E. et al. Impact of Eimeriatenella coinfection on Campylobacterjejuni colonization of the chicken. Infect. Immun. https://doi.org/10.1128/iai.00772-18 (2019).
Sofka, D., Pfeifer, A., Gleiss, B., Paulsen, P. & Hilbert, F. Changes within the intestinal flora of broilers by colonisation with Campylobacterjejuni. Berl. Munch. Tierarztl. Wochenschr. 128, 104–110 (2015).
Indikova, I., Humphrey, T. J. & Hilbert, F. Survival with a helping hand: Campylobacter and microbiota. Front. Microbiol. 6, 1266. https://doi.org/10.3389/fmicb.2015.01266 (2015).
Gracia, M. I. et al. Effect of feed form and whole grain feeding on gastrointestinal weight and the prevalence of Campylobacterjejuni in broilers orally infected. PLoS ONE 11, e0160858. https://doi.org/10.1371/journal.pone.0160858 (2016).
Visscher, C. et al. Influence of a specific amino acid pattern in the diet on the course of an experimental Campylobacterjejuni infection in broilers. Poult. Sci. 97, 4020–4030. https://doi.org/10.3382/ps/pey276 (2018).
Bishop, S. C. & Woolliams, J. A. On the genetic interpretation of disease data. PLoS ONE 5, e8940. https://doi.org/10.1371/journal.pone.0008940 (2010).
Bishop, S. C., Doeschl-Wilson, A. B. & Woolliams, J. A. Uses and implications of field disease data for livestock genomic and genetics studies. Front. Genet. 3, 114. https://doi.org/10.3389/fgene.2012.00114 (2012).
Parker, A. & Kaufman, J. What chickens might tell us about the MHC class II system. Curr. Opin. Immunol. 46, 23–29. https://doi.org/10.1016/j.coi.2017.03.013 (2017).
Steimle, V., Siegrist, C. A., Mottet, A., Lisowska-Grospierre, B. & Mach, B. Regulation of MHC class II expression by interferon-gamma mediated by the transactivator gene CIITA. Science 265, 106–109. https://doi.org/10.1126/science.8016643 (1994).
Sinha, S. et al. Immunoglobulin IgG Fc-receptor polymorphisms and HLA class II molecules in Guillain–Barré syndrome. Acta Neurol. Scand. 122, 21–26. https://doi.org/10.1111/j.1600-0404.2009.01229.x (2010).
Rathinam, V. A. K., Hoag, K. A. & Mansfield, L. S. Dendritic cells from C57BL/6 mice undergo activation and induce Th1-effector cell responses against Campylobacterjejuni. Microbes Infect. 10, 1316–1324. https://doi.org/10.1016/j.micinf.2008.07.030 (2008).
Salomonsen, J. et al. Sequence of a complete chicken BG haplotype shows dynamic expansion and contraction of two gene lineages with particular expression patterns. PLoS Genet. 10, e1004417. https://doi.org/10.1371/journal.pgen.1004417 (2014).
Chen, L., Fakiola, M., Staines, K., Butter, C. & Kaufman, J. Functional alleles of chicken BG genes, members of the butyrophilin gene family, in peripheral T cells. Front. Immunol. 9, 930. https://doi.org/10.3389/fimmu.2018.00930 (2018).
McCarthy, N. E. & Eberl, M. Human γδ T-cell control of mucosal immunity and inflammation. Front. Immunol. 9, 985. https://doi.org/10.3389/fimmu.2018.00985 (2018).
Van Rhijn, I., Van den Berg, L. H., Ang, C. W., Admiraal, J. & Logtenberg, T. Expansion of human gammadelta T cells after in vitro stimulation with Campylobacterjejuni. Int. Immunol. 15, 373–382. https://doi.org/10.1093/intimm/dxg041 (2003).
Smith, C. K. et al. Campylobacterjejuni-induced cytokine responses in avian cells. Infect. Immun. 73, 2094–2100. https://doi.org/10.1128/iai.73.4.2094-2100.2005 (2005).
Smith, C. K. et al. Campylobacter colonization of the chicken induces a proinflammatory response in mucosal tissues. FEMS Immunol. Med. Microbiol. 54, 114–121. https://doi.org/10.1111/j.1574-695X.2008.00458.x (2008).
Reid, W. D. et al. Cytokine responses in birds challenged with the human food-borne pathogen Campylobacterjejuni implies a Th17 response. R. Soc. Open Sci. 3, 150541. https://doi.org/10.1098/rsos.150541 (2016).
Freem, L. et al. Analysis of the progeny of sibling matings reveals regulatory variation impacting the transcriptome of immune cells in commercial chickens. Front. Genet. 10, 1032. https://doi.org/10.3389/fgene.2019.01032 (2019).
Li, P. et al. Messenger RNA sequencing and pathway analysis provide novel insights into the susceptibility to Salmonellaenteritidis infection in chickens. Front. Genet. 9, 256. https://doi.org/10.3389/fgene.2018.00256 (2018).
Rozen, S. et al. CSNAP is a stoichiometric subunit of the COP9 signalosome. Cell Rep. 13, 585–598. https://doi.org/10.1016/j.celrep.2015.09.021 (2015).
Dubiel, D., Rockel, B., Naumann, M. & Dubiel, W. Diversity of COP9 signalosome structures and functional consequences. FEBS Lett. 589, 2507–2513. https://doi.org/10.1016/j.febslet.2015.06.007 (2015).
Agarwal, V. & Hammerschmidt, S. Cdc42 and the phosphatidylinositol 3-kinase-Akt pathway are essential for PspC-mediated internalization of pneumococci by respiratory epithelial cells. J. Biol. Chem. 284, 19427–19436. https://doi.org/10.1074/jbc.M109.003442 (2009).
Davids, B. J. et al. Polymeric immunoglobulin receptor in intestinal immune defense against the lumen-dwelling protozoan parasite Giardia. J. Immunol. 177, 6281–6290. https://doi.org/10.4049/jimmunol.177.9.6281 (2006).
Shaughnessy, R. G., Meade, K. G., McGivney, B. A., Allan, B. & O’Farrelly, C. Global gene expression analysis of chicken caecal response to Campylobacterjejuni. Vet. Immunol. Immunopathol. 142, 64–71. https://doi.org/10.1016/j.vetimm.2011.04.010 (2011).
Connerton, P. L. et al. The effect of the timing of exposure to Campylobacterjejuni on the gut microbiome and inflammatory responses of broiler chickens. Microbiome 6, 88. https://doi.org/10.1186/s40168-018-0477-5 (2018).
Hallersund, P., Elfvin, A., Helander, H. F. & Fandriks, L. The expression of renin–angiotensin system components in the human gastric mucosa. J. Renin Angiotensin Aldosterone Syst. JRAAS 12, 54–64. https://doi.org/10.1177/1470320310379066 (2011).
Taylor, L. et al. Efficient TALEN-mediated gene targeting of chicken primordial germ cells. Development 144, 928–934. https://doi.org/10.1242/dev.145367 (2017).
Kapell, D. N. et al. Twenty-five years of selection for improved leg health in purebred broiler lines and underlying genetic parameters. Poult. Sci. 91, 3032–3043. https://doi.org/10.3382/ps.2012-02578 (2012).
Hickey, J. M., Kinghorn, B. P., Tier, B., van der Werf, J. H. & Cleveland, M. A. A phasing and imputation method for pedigreed populations that results in a single-stage genomic evaluation. Genet. Select. Evol. GSE 44, 9. https://doi.org/10.1186/1297-9686-44-9 (2012).
Hickey, J. M. & Kranis, A. Extending long-range phasing and haplotype library imputation methods to impute genotypes on sex chromosomes. Genet. Select. Evol. GSE 45, 10. https://doi.org/10.1186/1297-9686-45-10 (2013).
Kranis, A. et al. Development of a high density 600K SNP genotyping array for chicken. BMC Genomics 14, 59. https://doi.org/10.1186/1471-2164-14-59 (2013).
Gilmour, A. R., Gogel, B. J., Cullis, B. R. & Thompson, R. ASReml User Guide Release 3.0 (VSN International Ltd, Hemel Hempstead, 2009).
Purcell, S. et al. PLINK: A tool set for whole-genome association and population-based linkage analyses. Am. J. Hum. Genet. 81, 559–575. https://doi.org/10.1086/519795 (2007).
Aulchenko, Y. S., Ripke, S., Isaacs, A. & van Duijn, C. M. GenABEL: An R library for genome-wide association analysis. Bioinformatics 23, 1294–1296. https://doi.org/10.1093/bioinformatics/btm108 (2007).
Zhou, X. & Stephens, M. Efficient multivariate linear mixed model algorithms for genome-wide association studies. Nat. Methods 11, 407–409. https://doi.org/10.1038/nmeth.2848 (2014).
Canela-Xandri, O., Law, A., Gray, A., Woolliams, J. A. & Tenesa, A. A new tool called DISSECT for analysing large genomic data sets using a Big Data approach. Nat. Commun. 6, 10162. https://doi.org/10.1038/ncomms10162 (2015).
Bray, N. L., Pimentel, H., Melsted, P. & Pachter, L. Near-optimal probabilistic RNA-seq quantification. Nat. Biotechnol. 34, 525–527. https://doi.org/10.1038/nbt.3519 (2016).
Soneson, C., Love, M. I. & Robinson, M. D. Differential analyses for RNA-seq: transcript-level estimates improve gene-level inferences. F1000Research 4, 1521. https://doi.org/10.12688/f1000research.7563.2 (2015).
Pimentel, H., Bray, N. L., Puente, S., Melsted, P. & Pachter, L. Differential analysis of RNA-seq incorporating quantification uncertainty. Nat. Methods 14, 687–690. https://doi.org/10.1038/nmeth.4324 (2017).
Shabalin, A. A. Matrix eQTL: ultra fast eQTL analysis via large matrix operations. Bioinformatics 28, 1353–1358. https://doi.org/10.1093/bioinformatics/bts163 (2012).
Mohammadi, P., Castel, S. E., Brown, A. A. & Lappalainen, T. Quantifying the regulatory effect size of cis-acting genetic variation using allelic fold change. Genome Res. 27, 1872–1884. https://doi.org/10.1101/gr.216747.116 (2017).
Bolger, A. M., Lohse, M. & Usadel, B. Trimmomatic: a flexible trimmer for Illumina sequence data. Bioinformatics 30, 2114–2120. https://doi.org/10.1093/bioinformatics/btu170 (2014).
Warren, W. C. et al. A new chicken genome assembly provides insight into avian genome structure. G3 7, 109–117. https://doi.org/10.1534/g3.116.035923 (2017).
Dobin, A. et al. STAR: Ultrafast universal RNA-seq aligner. Bioinformatics 29, 15–21. https://doi.org/10.1093/bioinformatics/bts635 (2013).
Li, H. et al. The Sequence Alignment/Map format and SAMtools. Bioinformatics 25, 2078–2079. https://doi.org/10.1093/bioinformatics/btp352 (2009).
Gadin, J. R., van Hooft, F. M., Eriksson, P. & Folkersen, L. AllelicImbalance: an R/bioconductor package for detecting, managing, and visualizing allele expression imbalance data from RNA sequencing. BMC Bioinform. 16, 194. https://doi.org/10.1186/s12859-015-0620-2 (2015).
Borowska, D., Rothwell, L., Bailey, R. A., Watson, K. & Kaiser, P. Identification of stable reference genes for quantitative PCR in cells derived from chicken lymphoid organs. Vet. Immunol. Immunopathol. 170, 20–24. https://doi.org/10.1016/j.vetimm.2016.01.001 (2016).
Kramer, A., Green, J., Pollard, J. Jr. & Tugendreich, S. Causal analysis approaches in ingenuity pathway analysis. Bioinformatics (Oxford, England) 30, 523–530. https://doi.org/10.1093/bioinformatics/btt703 (2014).
Dennis, G. Jr. et al. DAVID: Database for annotation, visualization, and integrated discovery. Genome Biol. 4, P3 (2003).
Acknowledgements
The authors gratefully acknowledge the support of the Biotechnology and Biological Sciences Research Council via the LINK scheme (grant reference BB/J006815/1) and Institute Strategic Programme funding at The Roslin Institute (BBS/E/D/20231760 and BBS/E/D/20002172). We also acknowledge funding from the Scottish Government via the Rural and Environmental Science and Analytical Services programme of research for 2016–2021. These funders had no role in study design, data collection and analysis, decision to publish, or preparation of the manuscript. We dedicate this manuscript to our late colleagues Dr. Paul Hocking and Professor Pete Kaiser, who played key roles in conception of the study and supervision of the research.
Author information
Authors and Affiliations
Contributions
P.K., K.W., M.S., P.H., M.F., A.K., S.A., R.B. and A.P. conceived and designed the genetic study of Campylobacter resistance and secured funding; M.S., A.P. and D.H. conceived and designed the transcriptomic study of Campylobacter resistance and M.S. and A.P. secured funding. A.P., L.R., R.B. and K.W. performed data collection. A.P. and L.R. performed the phenotyping, with input from M.S. A.K. performed the imputation of the genomic data. A.P. and G.B., with input from A.K., P.K. and K.W., collated and edited the genotyping data and performed the genetic and genomic analysis. A.P. performed the transcriptomic analyses with input from K.R., S.B., D.H. and M.S. D.R. performed the ALE analysis. A.P. performed the pathway analyses. K.W. reconstructed the MHC haplotypes. A.P. performed the haplotype analyses and interpreted the results with input from J.K. and K.W. K.R. performed the RNA extractions, K.R. and A.B. performed the qRT-PCR to validate the RNA-Seq data. A.P., M.S., K.W., A.K., G.B., D.H., J.K., M.F., R.B. and S.A. interpreted these results. A.P. and M.S. wrote the manuscript. All other co-authors provided manuscript editing and feedback. All authors read and approved the final manuscript.
Corresponding author
Ethics declarations
Competing interests
AK, RB, MF and SA are employed by Aviagen Ltd. The remaining authors declare that the research was conducted in the absence of any commercial or financial relationships that could be construed as a potential conflict of interest.
Additional information
Publisher's note
Springer Nature remains neutral with regard to jurisdictional claims in published maps and institutional affiliations.
Supplementary Information
Rights and permissions
Open Access This article is licensed under a Creative Commons Attribution 4.0 International License, which permits use, sharing, adaptation, distribution and reproduction in any medium or format, as long as you give appropriate credit to the original author(s) and the source, provide a link to the Creative Commons licence, and indicate if changes were made. The images or other third party material in this article are included in the article's Creative Commons licence, unless indicated otherwise in a credit line to the material. If material is not included in the article's Creative Commons licence and your intended use is not permitted by statutory regulation or exceeds the permitted use, you will need to obtain permission directly from the copyright holder. To view a copy of this licence, visit http://creativecommons.org/licenses/by/4.0/.
About this article

Cite this article
Psifidi, A., Kranis, A., Rothwell, L.M. et al. Quantitative trait loci and transcriptome signatures associated with avian heritable resistance to Campylobacter. Sci Rep 11, 1623 (2021). https://doi.org/10.1038/s41598-020-79005-7
Received:
Accepted:
Published:
DOI: https://doi.org/10.1038/s41598-020-79005-7
This article is cited by
-
Genetic resistance to Campylobacter coli and Campylobacter jejuni in wild boar (Sus scrofa L.)
Rendiconti Lincei. Scienze Fisiche e Naturali (2022)
-
Transcriptomic analysis of caecal tissue in inbred chicken lines that exhibit heritable differences in resistance to Campylobacter jejuni
BMC Genomics (2021)
Comments
By submitting a comment you agree to abide by our Terms and Community Guidelines. If you find something abusive or that does not comply with our terms or guidelines please flag it as inappropriate.
