
Abstract
Despite advances in cancer treatment, the 5-year mortality rate for oral cancers (OC) is 40%, mainly due to the lack of early diagnostics. To advance early diagnostics for high-risk and average-risk populations, we developed and evaluated machine-learning (ML) classifiers using metatranscriptomic data from saliva samples (n = 433) collected from oral premalignant disorders (OPMD), OC patients (n = 71) and normal controls (n = 171). Our diagnostic classifiers yielded a receiver operating characteristics (ROC) area under the curve (AUC) up to 0.9, sensitivity up to 83% (92.3% for stage 1 cancer) and specificity up to 97.9%. Our metatranscriptomic signature incorporates both taxonomic and functional microbiome features, and reveals a number of taxa and functional pathways associated with OC. We demonstrate the potential clinical utility of an AI/ML model for diagnosing OC early, opening a new era of non-invasive diagnostics, enabling early intervention and improved patient outcomes.
Introduction
Oral cancer (OC) is a major subtype of head and neck cancers (HNC)1. Worldwide, there are an estimated 350,000 to 400,000 new cases of OC each year, and more than 150,000 deaths2. In the USA in 2020, it is estimated that 53,500 people (~71% male) will be newly diagnosed, and that there will be 10,860 deaths (~73% male) from OC. That amounts to 145 new cases diagnosed every day, and one person dying from OC every hour. The overall 5-year survival rate for people with OC is 40% and this figure has not improved in the past 40 years, resulting in more cancer deaths when compared to melanoma and cervical cancer in the USA3. However, if diagnosed at an early stage, the overall 5-year survival rate is 84%. Unfortunately, with today’s practices, only 29% of patients are diagnosed at an early stage.
The cost effectiveness of targeted screening/early diagnostic approaches (these terms, as well as “early detection” are used interchangeably throughout this paper) has been supported by the results from a simulation model study4. Currently, OC is hard to detect in the early stages because of the lack of effective early diagnostic tools, resulting in late diagnosis, leading to poor prognosis and low survival rates5,6, with a significant impact on the healthcare system. Major risk factors for the development of OC are excessive tobacco smoking, alcohol consumption, and in Asia, betel nut chewing. Tobacco use can include consuming tobacco products by smoking, chewing, vaping, etc. OC risk increases with age or a history of tobacco use7,8, and the increase becomes more rapid after 50 years of age9. Only 2–4% of OC cases are associated with human papillomavirus (HPV) infection. In addition, OC commonly occurs in people without a history of tobacco use or alcohol consumption, which argues that additional environmental factors may lead to the development of OC.
Existing microbiological literature has established a significant correlation between changes in the microbiome and cancer phenotypes10,11. Perhaps the best-known association is of bacteria (Helicobacter pylori) causing gastric ulcers that progress into gastric cancer. In the last decade, multiple microbiome studies using biopsies, tissue samples, and deep epithelial swabs taken from OC patients have shown associations of certain microbes with the development of OC. In previous studies, although there were significant methodological variations in terms of type of samples, technologies used for microbial analysis (16S rRNA gene sequencing or shotgun DNA analysis), design and inclusion criteria, some overlaps were observed at high taxonomic levels. More recently, the notion has emerged that the microbial association with OC is at the level of the microbial community’s function, rather than at its composition12. Most intriguing, recent evidence raises the possibility that changes in salivary microbiome composition may have potential as biomarkers for detecting HNCs13,14,15,16,17.
Visual and tactile screening, followed by laboratory testing and clinical assessment remain the backbone of the current clinical standard of care. A simpler alternative would be measurements made from saliva samples. Saliva specimen collection is non-invasive, straightforward, safe, painless; patients can collect samples themselves. As with home-based stool sample collection, we imagine that removing the need for professional healthcare personnel for sample collection could lead to greater potential for access as well as patient compliance compared to blood-based methods18. Saliva is also a more stable and a less complex matrix compared to blood and as such, is ideal for broad use19. Despite all of these advantages of the use of saliva, an accurate method of profiling the microbiome changes in saliva samples as an early diagnostic indicator has not been developed to date that could generate the much needed clinical impact in this prevalent and deadly disease.
Our overarching aim is to develop a simple, non-invasive, and scalable method, with a classification algorithm that can be used as an early diagnostic tool to address an urgent unmet clinical need. We hypothesized that combining salivary microbial transcriptome (metatranscriptome) profiling using next-generation sequencing (NGS) technology with machine learning (AI/ML) would allow us to develop a classifier that could accurately discriminate premalignant/OC cases from normal healthy controls. We have developed and validated both state-of-the-art techniques for achieving accuracy and robustness in our OC classifier: (1) NGS metatranscriptomic analysis, which captures the microbial activity (RNA) within the saliva sample in high resolution, and accurately identifies both the microbial taxonomies as well as the microbial functions20, and (2) analytical discovery of the metatranscriptomic signature associated with OC, using a model trained from a ML algorithm.
To achieve the above objectives, we collected 433 saliva samples and meta-data from 242 unique individuals, and divided these samples into the cohorts described in Table 1 below. Using these cohorts, we developed and evaluated classifiers for two scenarios:
-
1.
Screening for OC or oral premalignant disorders (OPMD) within the high-risk population, i.e., 50 years or older, OR with a history of tobacco use
-
2.
Screening for OC only within the average-risk population, i.e., general population across all backgrounds
While we provide the results for both scenarios, we highlight the high-risk OC + OPMD screening scenario in the rest of the paper, since this represents the largest unmet clinical need. Based on our analysis and results across cohorts, the findings from this study provide the foundation for a large multi-center clinical trial to validate the effectiveness of the diagnostic classifier on the populations of interest.
Results
Cohort description
The goal of this study was to evaluate diagnostic performance of a novel liquid biopsy on both a high-risk as well as an average-risk population. Table 1 summarizes the participants in the cohorts used in this study: Cohorts A and B represent the high-risk population, defined as people aged 50 years or older OR with a history of tobacco use (so a 55 year old never-smoker and a 25 year old smoker would both belong to these cohorts). Cohorts C and D represent the average-risk general population.
-
The goal of Cohort A (high-risk OC + OPMD discovery cohort) was to support the primary use case of this study—to develop a machine-learned classifier for early diagnosis in the high-risk cohort, to analyze the features in the raw data (Fig. 1), evaluate the classifier performance (Fig. 2 and Table 2), and summarize the metatranscriptomic signature (Fig. 3). For this objective, we included both OC and OPMD patients within the positive “cases” category, as one would expect in a clinical early detection or screening test.
Fig. 1: Descriptive statistics of salivary metatranscriptome of the high-risk population (Cohort A in Table 1). 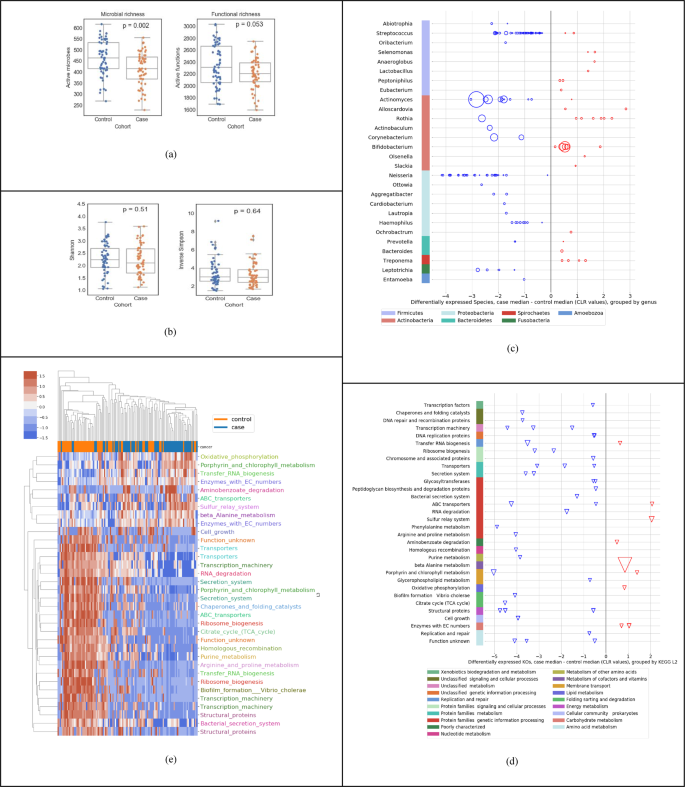
a Species richness; control median 463, case median 415 and function richness; control median 2306, case median 2205. b Shannon diversity index; control mean 2.25, case mean 2.20; and Inverse Simpson diversity index; control mean 3.41, case mean 3.26. c Using Mann–Whitney U tests and at least twofold difference in means (0.69 in CLR space), 139 differentially expressed species (at p < 0.05) up- or downregulated (red and blue respectively) in cases relative to controls, organized by genus and phylum (median difference in CLR values); the size of the bubble is inversely proportional to the p value. d Using Mann–Whitney U tests and at least twofold difference in means (0.69 in CLR space), 49 differentially expressed KOs (at p < 0.05) up- or downregulated in cases relative to controls, organized by KEGG level-3 and level-2 functional groups; the size of each triangle is inversely proportional to its p value e Clustermap using Euclidean distance of CLR transformed sum(transcripts per million) data for active function (KO) features significant by Mann–Whitney U tests. Features are shown with corrected p values < 0.01 and median CLR differences between the cohorts of greater than 0 or less than −1. KOs are color coded by their KEGG level-3 functional group.
Fig. 2: Predictive performance of machine-learnt classifier trained with discovery dataset (Cohort A in Table 1). 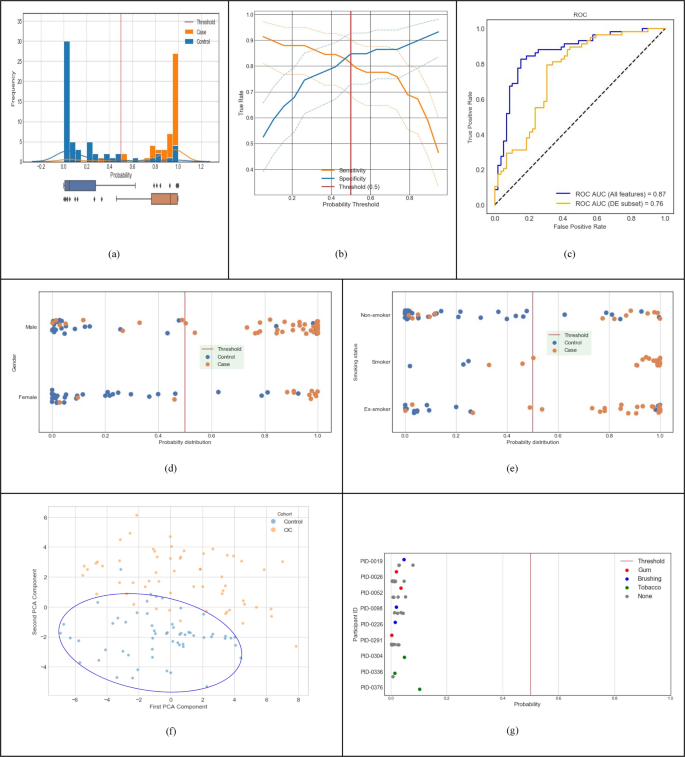
a Distribution of classifier output probabilities across the sample set. b Sensitivity & specificity tradeoff with 95% confidence interval computed using the Clopper-Pearson method; at the default decision boundary of 0.5, sensitivity is 0.81 and specificity is 0.85. c ROC AUC of the classifier using the LOOCV method is 0.87 (blue curve); using differentially expressed features only is 0.76 (orange curve). d Classifier probabilities separated by gender. e Classifier probabilities separated by smoking status. f PCA analysis using top 100 features (PC1 and PC2 capture 10.2% and 6.3% of the total variation, respectively.). g Probability of cancer output from the classifier for control samples with and without interference from chewing gum, chewing tobacco, and brushing teeth.
Table 2 Model performance for cohorts described in Table 1. Fig. 3: Oral metatranscriptomic signature from the ML classifier trained with Cohort A from Table 1. 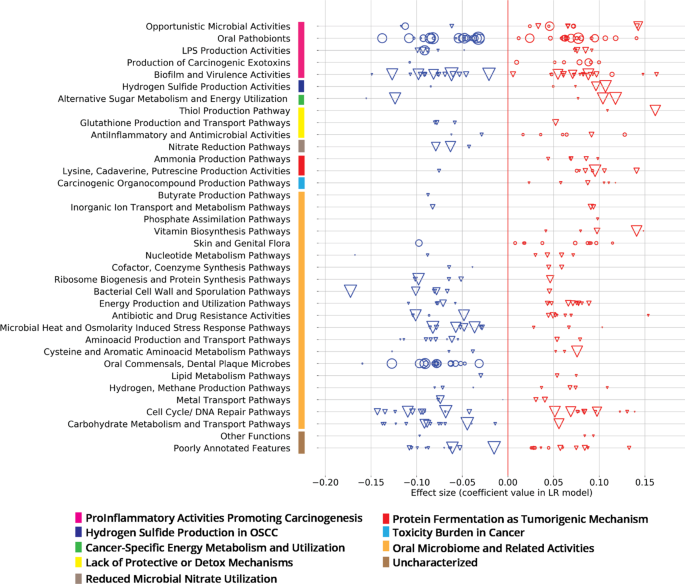
Effect sizes (coefficient values within the classification model) of 101 active species (circles) and 247 active KOs (triangles), grouped into curated Viome Functional Categories (VFC), see ‘Supplementary Note 4’ section of the Supplementary Material; sizes of circles or triangles are proportional to the CLR median difference in expression level between cases and controls.
-
The goal of Cohort B (high-risk cross-validation cohort) was to evaluate the performance of our approach by including an additional 27 samples on top of Cohort A.
-
The goal of Cohort C (average-risk OC only) was to develop and evaluate a classifier for a broad general population, and with only OC cases (i.e., without the premalignant OPMD cases).
-
The goal of Cohort D was to perform a technical validation using samples from “presumed normal” individuals from the general population, and to evaluate whether external interference factors (such as chewing gum, chewing tobacco, or brushing teeth) influenced the metatranscriptomic analysis.


Descriptive statistics
Figure 1 summarizes a set of descriptive statistics to show the differences in active species and KOs between the 58 cases and 59 controls in our study. Across all samples used in this study, we detected a wide range of unique active microbes (1587 active species, sample mean 438 ± StD 81) and unique active functions (4932 KEGG Orthologs or KOs, sample mean 2270 ± 314). As shown in Fig. 1a, we observed a lower richness in cases compared to controls, both in terms of active species and active KOs. However, as shown in Fig. 1b, we do not see a statistically significant difference (using Mann–Whitney U (MWU) test) in diversity indices, such as the shannon index or the inverse simpson diversity index between cases and controls. In general, diversity measures both richness and evenness, and in this dataset, although there is a lower richness in active species, Pielou’s evenness index is not significantly different between cases and controls (p value = 0.72). Overall, the ecological change in decreasing richness in cases does not seem to be driven by a single dominating species. Figure 1c shows the up/down regulation of the 139 significantly differentially active species between cases and controls, grouped into 28 genera (p < 0.05, MWU test). Each dot (circle) represents a species, all species on a horizontal line are grouped by the genus on the left of the line, and all genera in a given color are grouped by the phylum shown at the bottom. We observed a downward shift, i.e., that 75.5% of the species are downregulated in cases compared to controls. For example, out of the 41 differentially active species from the Streptococcus genus, 39 were downregulated, most of them within 2 units on the centered log-ratio (CLR) scale; the 27 species from the Neisseria genus were all downregulated in cases, with many of them at 4 units on the CLR scale. In contrast, 6 species from the Rothia genus were upregulated in cases compared to controls. Figure 1d shows the up/down regulation of the 49 significantly differentially expressed KOs between cases and controls, grouped into 30+ KEGG level-3 functional groups (p < 0.05, MWU test). Each dot (triangle) represents a KO, all KO’s on a horizontal line are grouped by the “level-3 KEGG function” on the left of the line, and all level-3 KEGG functions in a given color are grouped by the level-2 KEGG function shown at the bottom. We observed that most of the microbial functions were downregulated in cases (81.6%), compared to controls. Finally, Fig. 1e shows a visible distinction between cases and controls using only the differential expression of functions.
It is important to note that Fig. 1 presents a descriptive statistical analysis of the 58 cases versus 59 normal controls. The differential expression of individual features taken one-at-a-time without interactions provides a level of insight into the raw data, but may not necessarily result in the highest performing diagnostic model. In the section below, we demonstrate that a linear regression machine-learning approach provides a significantly higher diagnostic performance, as shown in Fig. 2c.
Predictive performance of the machine-learned (ML) classifier
Figure 2 depicts the clinical diagnostic performance of our trained classifier within the discovery dataset (Cohort A, n = 117 in Table 1), using the leave one out cross validation (LOOCV) method described earlier. For each incoming validation sample, the trained model outputs a probability that the input sample belongs to the OC/OPMD class (cases). When this probability is above the clinical decision threshold of 0.5, the sample is classified as OC/OPMD (case), otherwise Not-OC/OPMD (control). We used the default probability value of 0.5 for the clinical decision threshold, since it minimizes loss on the training data, and has the advantage that it balances sensitivity and specificity in general. Figure 2a shows the probabilities output by our model for all samples in cross validation. Our classifier results are bimodal with good separation of cases and controls, and most data points have predicted probability close to 0 or 1 with very few near the clinical decision threshold. The sensitivity and specificity tradeoff with 95% confidence interval is shown in Fig. 2b. At the clinical decision threshold of 0.5, the sensitivity is 0.81 and specificity is 0.85. Finally, Fig. 2c shows that our classifier has an ROC AUC of 0.87. Note that a classifier constructed using only the differentially expressed features shown in Fig. 1 (139 taxa and 49 KOs) performs at ROC AUC of 0.76 (shown by the orange line in Fig. 2c).
Figure 2d illustrates that gender does not overly bias our classifier. Figure 2e shows that smoking history also does not bias our classifier. It detects non-smokers who have cancer, and it detects smokers and ex-smokers who do not have cancer. Figure. 2f shows PCA clustering analysis of samples using the top 100 model features, which shows that non-cancer samples are clustered together, providing evidence that the signature is relatively stable. In addition, nine volunteers (from Cohort D in Table 1) provided saliva samples with different potential interferants, such as chewing gum, chewing tobacco, and brushing teeth. Fig. 2g shows that the probability output of the classifier does not change based on the presence of an interfering substance, showing that our cancer classifier is robust. Taken together, this data demonstrates that our model’s performance and robustness is state of the art in the field16,21.
Table 2 gives a summary of the classifier performance for all cohorts in Table 1. The larger high-risk cross-validation Cohort B resulted in a similar performance as Cohort A. The cross-validation performance for a model trained with Cohort C is higher than Cohorts A & B since Cohort C consists of only OC cases without any of the OPMD cases. Cohort D was evaluated with the diagnostic model developed for the primary use case presented in this paper for Cohort A (i.e., the model was trained only with Cohort A, but evaluated with samples from Cohort D). The purpose was to ensure that this model is still able to correctly classify a general population, which was confirmed with a specificity of 97.9% (276 true negatives and 6 false positives). Additional details are in the ‘Supplementary Note 3’ section of Supplementary Material.
Metatranscriptomic signature from the ML classifier
Figure 3 depicts the details of the features that drive our predictive model. As described earlier, our “metatranscriptomic signature” consists of 348 features (101 active species and 247 active functions) from the intersection of models built in each fold of cross validation. Here, we introduce a curated set of pathway and taxa categories called ‘Viome Functional Categories’ (VFCs) that group all the features into 9 major biological themes comprising 36 functional categories. These VFCs shed light on some of the microbial activities and biological pathway mechanisms that are known to be associated with oral carcinogenesis. For example, the functional category “Opportunistic Microbial Activities” consists of 3 features (1 taxon and 2 KOs) with a negative effect in the classifier, and 9 features (5 KOs and 4 taxa) with a positive effect. A brief description of the VFCs, the themes and the features (taxa and KOs) constituting the themes are provided in ‘Supplementary Note 4’ section of the Supplementary Material.
The functional categories and features within ‘ProInflammatory Activities promoting Carcinogenesis’, ‘Hydrogen Sulfide Production’, ‘Cancer-specific Energy Metabolism and Utilization’, ‘Lack of Protective or Detox Mechanisms’, ‘Reduced Microbial Nitrate Utilization’, ‘Protein Fermentation’, and ‘Toxicity Burden’, are more direct in terms of their association in oral carcinogenesis. This can be seen by the presence of a greater number of features (taxa and KO) that have a positive effect from the model in the ‘Opportunistic Microbial Activities’ and ‘Hydrogen Sulfide Production’ and ‘Production of Carcinogenic Exotoxins’ themes. These themes have already been implied in oral carcinogenesis22,23. Amongst the other functional categories, the features are more associated with general Oral Microbiome related Activities and are more predictive of controls. The ‘Oral Commensals, Dental Plaque Microbes’ constitute microbes such as commensal Streptococcus sp. that are important in maintaining oral commensalism and microbiome balance24. The functional categories that harbor many features have a negative effect from the model include pathways supporting normal cellular metabolism such as ‘Carbohydrate Metabolism and Transport Pathways’, ‘Amino Acid Production and Transport Pathways’, ‘Microbial Heat and Osmolarity Induced Stress Pathways’ and themes involved in cell growth, such as ‘Ribosome Biogenesis’ and ‘Cell Wall and Sporulation’.
Discussion
The 5-year overall survival rate for all OC in the USA is 84% but drops to 39–65% when diagnosed at an advanced stage (percentage dependent on location and extent of metastasis)25. Visual and tactile screenings are the foundation of the current standard of care, usually performed by dental hygienists and primary care physicians, which while being quick and easy, are subjective (e.g., verbal questions about symptoms) and prone to a high number of false negatives and false positives26. Research has shown some of the reasons for late diagnosis, which is a layered and complicated problem, including under-utilization of dental and primary care, lack of and poor quality of screening in individuals at a higher risk of developing OC and who do not seek general care, and especially, the fact that in the earliest, most treatable stages, many OC show few symptoms and may not be visible26,27,28,29,30,31.
To get an approximation of the performance of the standard of care, we used data from a meta-analysis of studies used in the clinical assessment of OC32 using the standard of care techniques described above (i.e., visual/tactile examinations). Walsh et al. included ten studies in their review along with the assessment methodology, sensitivity, specificity, population size and location for each. We focused on studies that best reflected our sample populations, i.e., predominantly white populations with a mix of all other ethnicities. This resulted in four studies ([‘julien_95a’, ‘downer’, ‘julien_95’, ‘sweeny’]) from the UK and the USA with a combined total of ~2500 participants. We then took a weighted average for sensitivity across the four relevant studies, weighing the metrics by study population size. This yielded a sensitivity value of 0.717 and specificity of 0.989. The diagnostic system presented in this paper yields a sensitivity of 83% for our validation Cohort B, and a specificity of 97.9% for our largest sample set of 282 samples in Cohort D. This establishes that the work presented in this paper is superior to the current standard of care, and we continue to improve this performance with ongoing studies.
Several adjunct diagnostic tools are available to aid providers in identification and diagnosis of OCs33, such as brush cytology34,35, toluidine blue staining36, and light-based visual detection systems37. The use of these tools varies among providers, and currently, none of the available tools has been studied sufficiently to prove that their use improves the sensitivity and specificity of the current standard of care physical exam38,39. The work presented in this paper addresses these issues in the standard of care. We introduce a method which has non-invasive and easy sample collection using saliva rinse, coupled with an objective and robust classification algorithm with high sensitivity and specificity to distinguish between control samples and OC samples.
There has been interest in investigating either individual bacteria or shifts in microbiome composition and their potential association with different stages of cancer development, since the classification of Helicobacter pylori as a causative agent for stomach cancers. In addition, there have been many published studies on the potential association between changes in the microbiome (mainly at the metagenomics level) and cancer. Even though microorganisms have been implicated in 15.4% of human malignancies, there is a dearth of knowledge regarding the role of bacteria in the development and progression of OC. Conventional differential expression analysis reported by existing studies40 shows statistical differences in microbial features between cases and controls in cancer tissue, but no study has yet presented a microbiome-based predictive classifier using a non-invasive saliva-based sampling method. Furthermore, while the majority of microbiome studies to date have focused on microbial taxonomy (due mostly to the limitation of DNA sequencing), we used a combined taxonomic and functional analysis (metatranscriptomics) and demonstrate that microbial functions make important contributions to our model. This is not unexpected, since the biological activity (of mechanistic relevance to OC biology) is the result of active gene expression, and not just genetic potential encoded by DNA.
In this study, we have used both taxonomic profiling and functional profiling to develop a diagnostic classifier based on AI/ML using salivary metatranscriptomic data. We have detected a wider range of unique active microbes (1587 active species, sample mean 438 StD 81) and unique active functions (4932 KOs, sample mean 2270 ± 314) than previous studies, making it feasible to comprehensively profile bacterial functions (KOs). Our AI/ML diagnostic classifier is effective in identifying individuals who are at high risk of developing OC, starting with premalignant lesions/OPMD (Cohort A in Table 1), which is the largest unmet clinical need in this space. For this cohort, cross validation of our diagnostic classifier yielded an ROC AUC of 0.87, sensitivity of 0.81 and specificity of 0.85. For a narrower use case such as Cohort C which includes only OC cases, our ML model achieves ROC AUC over 0.9. A secondary technical validation using 91 healthy individuals (Cohort D) yielded a sensitivity of 97.9%. To the best of our knowledge, our classifier has the best diagnostic performance published currently.
We have observed a lower richness, both in terms of active species and active KOs in saliva samples analyzed from cases compared to controls (Fig. 1a), corroborating with a previous study by ref. 40 using salivary metagenomic analysis. In contrast, another study revealed much greater diversity of bacterial communities in OC samples41. Our study shows that several genera such as Streptococcus, Haemophilus, and Actinomyces downregulated as does Yang’s work42; although some genera like Fusobacterium does not appear to be differentially expressed in our analysis. Our high throughput metatranscriptomic technology can detect features (strain-level taxa as well as KOs for functional activity) at a much finer granularity compared with 16S techniques used in Yang’s work20,43. Nevertheless, this level of concordance with prior work is highly encouraging. We have also detected at the genus-level high amounts of periodontal bacteria Fusobacterium, Prevotella and Porphyromonas in saliva samples from OC and OPMD, confirming previous findings44. Furthermore, we believe that our model is specific to OC and does not overlap with other common conditions such as canker sores, since there is negligible overlap (two species) between the features of our signature and the microbial signature discovered by Kim45.
Among the ProInflammatory Activities promoting carcinogenesis, we identified several species of pathobionts from Porphyromonas, Treponema, Fusobacterium, and Streptococcus genera and their raffinose, stachyose, and melibiose transporters, as previously reported46,47,48. This theme also captured two Porphyromonas species and one microbial KO shown to produce proinflammatory mediators49,50 and eight KOs that are involved in biofilm formation and virulence51,52. Protein Fermentation and polyamine metabolism are known to be associated with tumorigenesis by mediating oxidative damage to the host cells53, we report protein fermentation and ammonia-producing KOs as predictors of OC54,55,56. Five toxin-generating KOs that produce benzaldehyde, arsenite, and other carcinogenic metabolites also contribute to the pathogenesis of OC22,23,57.
Species-level taxonomic classifications were essential for identifying relevant taxa that are predictive of the phenotype. This is clearly depicted in Figs. 1c and 3, where several genera contain multiple species and that make opposite contributions to the model. This is an important observation, as there are many literature reports that show genera as contributing to a phenotype. In reality, that finding may be driven by certain species within the genera, but other species may have the opposite effect. Therefore, genus-level analysis can lead to false results of a test, depending on the specific species present in a sample.
Our approach improves on previous functional methods by revealing not simply differential expression and functional categorization, but more importantly, mechanisms that integratively connect predictive gene-encoded active functions along with active microbes to relevant biological themes characteristic of OC. Understanding the systems biology level perspective revealed by our ML model can take us one step closer to developing not only diagnostic but also future therapeutic strategies to address this disease.
Ideally, the diagnostic classifier developed in this study would be used clinically as an early detection/screening tool for a high-risk population (adults of either sex 50 years or older OR those with a history of tobacco use). A positive result may indicate the presence of either OPMD or OC and should be followed by, for instance, a detailed physical examination and/or a biopsy by an appropriate medical practitioner (dental surgeon, ENT specialist, etc). Due to the simple, efficient and non-invasive nature of the saliva collection procedure, it is unlikely that such a prediction model will cause any potential adverse effects. The primary risk associated with this prediction model is the possibility of a false prediction (i.e., a false-positive or a false-negative result). All positive test results will need to be followed by a physical examination of the patient. In a situation where the system presented here produces a false-negative result, there is a chance that a case of OC could go undetected, but this risk is no greater than what exists under the current standard of care (visual/tactile examination by a medical practitioner).
The main contribution of this paper is a diagnostic system that addresses an unmet clinical need for early detection of OC (including premalignant cases) in high-risk populations (people 50 years or older OR with a history of tobacco use). Our system uses (a) a simple, non-invasive, saliva sample (b) high throughput NGS metatranscriptomic lab analysis, and (c) a machine-learned diagnostic classifier that accurately discriminates between cases and controls. We show that this system can identify high-risk OPMD/OC patients vs. normal healthy controls with ROC AUC of 0.87. When restricted only to OC patients at average risk, our classifier achieves ROC AUC over 0.9. We demonstrate a system that effectively improves upon the current standard of care globally, opening a new era of non-invasive diagnostics, enabling early intervention and improving patient outcomes.
Our method is based on extracting high-resolution metatranscriptomic (RNA) functional and taxonomic features from saliva samples (rather than genus-level 16S or metagenomic/DNA features), which represents gene expression of active microbial functions in the sample. Second, rather than performing a differential expression analysis of each feature as in most current literature, we perform a machine-learning analysis that captures the inter-dependencies among the thousands of features within the processes and allows us to predict the probability of a cancer signature in a sample. This allows us to identify and connect the most important predictive features that represent active microbial functions along with active microbes to relevant biological themes characteristic of OC. While the results in this discovery study are encouraging, and the method used extracts a meaningful signal with reduced overfitting, we recognize the limitations of the number of samples in the current study, and plan to perform a large multi-site study to validate the signature on a broader scale.
Overall, we believe that the AI/ML-based diagnostic classifier developed and validated in this study opens a new era of non-invasive diagnostics, enabling early intervention and improving patient outcomes, while significantly reducing healthcare costs. Once an early diagnostic test is available at scale, we can routinely improve the accuracy of our test as we collect more “real-world evidence” to further train our machine-learning models. This enables de novo discoveries that will have a great impact and open a new era of precision medicine.
Methods
Study cohorts
For Cohorts A, B, and C, we recruited 71 newly diagnosed treatment-naive patients with OC and OPMD, and collected a saliva sample from each of them at baseline. In addition, we collected 362 saliva samples from 171 non-diseased individuals across all cohorts shown. The exact inclusion and exclusion criteria are described in the ‘Supplementary Note 1’ section of Supplementary Material. Based on histopathological reports, the clinical stages of patients with OC were classified based on the cancer staging system of the American Joint Committee on Cancer58. All patients in Cohorts A, B, and C were HPV negative based on a PCR-based test of their saliva59.
This study was approved by the Queensland University of Technology and University of Queensland Medical Ethical Institutional Boards (HREC no.: 1400000617 and HREC no.: 2017000662 respectively) and the Royal Brisbane and Women’s Hospital (HREC no.: HREC/12/QPAH/381) Ethics Review Board. Written informed consent was obtained from all participants and all of the methods in this study were performed in accordance with the relevant guidelines and regulations.
Sample collection and laboratory analysis
Laboratory analysis of the saliva samples was similar to the metatranscriptomic method designed for large-scale population analysis of stool samples as described previously20 (summarized in Supplementary Fig. 2 in the Supplementary Material) and included sample collection, ambient temperature sample preservation, total RNA extraction, physical removal of ribosomal RNAs, preparation of directional Illumina libraries, and Illumina sequencing. The stability of the RNA stabilizer was tested for up to 28 days at ambient temperature, including shipping. (More details in Supplementary Figs. 2 and 3 in Supplementary Material).
Bioinformatics processing
Paired-end reads were mapped to a catalog of 53,660 microbial genome assemblies spanning archaea, bacteria, fungi, protozoa, and viruses. (We downloaded the complete genomes available in NCBI Reference Sequence Database and used the GenBank sequence database for viral genomes.) Strain-level relative activities were computed from mapped reads via the expectation-maximization (EM) algorithm60. Relative activities at other levels of the taxonomic tree were then computed by aggregation according to the taxonomic rank. Relative activities for biological functions were computed by mapping paired-end reads to a catalog of 52,324,420 microbial genes, quantifying gene-level relative activities with the EM algorithm, and then aggregating gene-level activity by KO annotation61. The identified and quantified active microbial species and KOs for each sample were then provided to the OC classifier. (More details are in the ‘Supplementary Note 2’ section of Supplementary Material).
Descriptive statistical analysis
Standard statistical analyses described below were initially performed to analyze the differential expression of active microbes and active functions between the 58 cases and the 59 healthy controls in Cohort A (Fig. 1). The data were transformed using the CLR transformation62 after imputation of zero values using multiplicative replacement63. We used the two-sided MWU test (p < 0.05 after Benjamini–Hochberg correction for multiple comparisons) and at least twofold difference in means (0.69 in CLR space). It is important to note that this is a descriptive statistical test to analyze features independently for differential expression without taking into account the interactions among features and is thus not suitable for the machine-learning classification method (below).
Mapping KOs to functional categories for presentation
For Fig. 1, the Python module “Bio.KEGG” was used to take as input the KO name and return KO hierarchy at three different levels (level-1 to level-3). For Fig. 3, VFCs, each KO and taxa feature from the ML model was analyzed in the context of expert-assessed directional pathway mechanisms or biologically characterized taxonomic microbial groups (see ‘Supplementary Note 4’ section of Supplementary Material). Subsequently, the VFCs were summarized into broader biological themes based on literature and their relevance to carcinogenesis or OC progression as described in the Discussion and the ‘Supplementary Note 4’ section of Supplementary Material.
Machine-learning (ML) classifier development and cross-validation
The OC binary classifier was trained using the appropriate number of samples from the population in the cohorts described in Table 1. Each sample was annotated as a case (OC or OPMD) or control. The molecular data (microbial species and KOs) derived from the metatranscriptomic analysis of the saliva samples were used as input features for training. For this study, we chose a logistic regression (LR) model since it performs well and is easily interpretable. In particular, we used l2 regularized LR with a regularization parameter of 1, implemented in scikit-learn64. This choice was motivated by low model complexity as protection against overfitting.
We used “LOOCV” to validate both feature selection and model performance. It is conventionally held that in k-fold validation, as k approaches N (i.e., approaches LOOCV), estimator variance decreases due to increasing number of observations and aggregation over a greater number of folds but increases due to increasing nonindependence of the data comprising each fold (e.g.65). Due to the small sample size relative to the number of active microbes and functions, we took precautions to ensure that the features we present are robust to random variation in the data. The following procedure was used:
-
To begin with, the features in our molecular data consist of all detected active microbes (1587 species) and functions (4932 KOs).
-
Data were transformed using the CLR method62. Features with variance less than 25th percentile of the variances of all features were removed as part of data pre-processing and 533 active microbes and 2216 active functions were used for the remaining analysis.
-
For each fold of the LOOCV method, we performed feature selection as follows. Bootstrap sampling of each training set 1000 times provided the sampling distribution of all LR coefficients. We considered features where the 95% CI of this distribution did not cross zero to be significant at p < 0.05, and used these to estimate the model in each iteration of the LOOCV procedure.
-
To obtain a final model for the purposes of follow-on validation or clinical use, we fit an LR model with the 348 features (101 active species and 247 KOs) at the intersection of the models built in each fold of cross validation. This is a conservative choice made to select the features consistently selected across cross validation, and therefore reduce overfitting. We call these 348 features used in the final ML model the metatranscriptomic signature of OC.
Reporting summary
Further information on research design is available in the Nature Research Reporting Summary linked to this article.
Data availability
This research was sponsored by Viome and the authors of the paper who have access to the data are employees or scientific collaborators of Viome who have signed contracts with Viome to be bound by Viome’s privacy policy and access restrictions. The sample data and feature matrix for the main discovery cohort (Cohort A) has been made available at figshare, at https://doi.org/10.6084/m9.figshare.13244243. Additional data can be made available through a Data Transfer Agreement that protects the privacy of participants’ data; interested researchers may request at https://www.viome.com/vri/data-access. The information provided by interested researchers on the dataset request form will be used to generate a Statement of Work (no fee SOW) and a Data Transfer Agreement (DTA). The DTA protects the privacy of the participants’ data, and the SOW outlines the planned use of the summary statistics. The SOW and DTA will need to be signed by your institution first, and then Viome, before data can be shared. If you are collaborating with investigators at multiple institutions and those institutions must also receive copies of Viome summary statistics, please have a PI from each institution fill out the form to ensure all parties receive access to datasets within a similar timeframe. Finally, please note that each signed SOW and DTA allows use of Viome data only by the signatory institution and its personnel. Each institution that wishes to access or use Viome data must have a signed SOW and DTA covering their access to Viome data. Once a valid SOW and a valid DTA are signed off, Viome will transfer data to the researcher for use in the research project described in the SOW.
Code availability
For the oral cancer classifier, we have used standard algorithms such as logistic regression to derive the main results in this research. The major parameterization decisions (e.g., L2 regularization) have been described in the “Methods” section. Statistics and Machine-Learning software was written using standard Python libraries such as scikit-learn, pandas, and numpy.
References
American Society of Clinical Oncology. Head and neck cancer guide. https://www.cancer.net/cancer-types/head-and-neck-cancer/introduction (2019).
World Health Organization. Oral cancer. https://www.who.int/cancer/prevention/diagnosis-screening/oral-cancer/en/ (2020).
Brian, L. et al. Changes in abundance of oral microbiota associated with oral cancer. PLoS ONE 9, e98741 (2014).
Dedhia, R. C., Smith, K. J., Johnson, J. T. & Roberts, M. The cost-effectiveness of community-based screening for oral cancer in high-risk males in the United States: a Markov decision analysis approach. Laryngoscope 121, 952–960 (2011).
Brocklehurst, P. et al. Screening programmes for the early detection and prevention of oral cancer. Cochrane Database Syst. Rev. 11 (2013).
Asio, J., Kamulegeya, A. & Banura, C. Survival and associated factors among patients with oral squamous cell carcinoma (OSCC) in Mulago hospital, Kampala, Uganda. Cancers Head Neck 3, 9 (2018).
American Cancer Society medical and editorial content team. Risk factors for oral cavity and oropharyngeal cancers. https://www.cancer.org/cancer/oral-cavity-and-oropharyngeal-cancer/causes-risks-prevention/risk-factors.html (2018).
Morse, D. E. et al. Smoking and drinking in relation to oral cancer and oral epithelial dysplasia. Cancer Causes Control 18, 919–929 (2007).
National Institutes of Health. Oral cancer incidence (new cases) by age, race, and gender. https://www.nidcr.nih.gov/research/data-statistics/oral-cancer/incidence (2018).
Elinav, E. et al. The cancer microbiome. Nat. Rev. Cancer 19, 371–376 (2019).
Poore, G. D. et al. Microbiome analyses of blood and tissues suggest cancer diagnostic approach. Nature 579, 567–574 (2020).
Al-hebshi, N. N. et al. Inflammatory bacteriome featuring Fusobacterium nucleatum and Pseudomonas aeruginosa identified in association with oral squamous cell carcinoma. Sci. Rep. 7, 1–10 (2017).
Krishnan, K., Chen, T. & Paster, B. J. A practical guide to the oral microbiome and its relation to health and disease. Oral. Dis. 23, 276–286 (2017).
Lim, Y. K. & Punyadeera, C. A pilot study to investigate the feasibility of transporting saliva samples at room temperature with MAWI cell stabilization buffer. Cogent Biol. 4, 1470895 (2018).
Lee, W. et al. Bacterial alterations in salivary microbiota and their association in oral cancer. Sci. Rep. 7, 16540 (2017).
Zhang, L., Liu, Y., Zheng, H. J. & Zhang, C. P. The oral microbiota may have influence on oral cancer. Front. Cell. Infect. Microbiol. 9, 476 (2020).
La Rosa, G. et al. (2020). Association of oral dysbiosis with oral cancer development. Oncol. Lett. 19, 3045–3058 (2020).
Salazar, C. et al. A novel saliva-based microRNA biomarker panel to detect head and neck cancers. Cell. Oncol. 37, 331–338 (2014).
Tang, K. D., Kenny, L., Frazer, I. H. & Punyadeera, C. High‐risk human papillomavirus detection in oropharyngeal cancers: comparison of saliva sampling methods. Head Neck 41, 1484–1489 (2019).
Hatch, A. et al. A robust metatranscriptomic technology for population-scale studies of diet, gut microbiome, and human health. Int. J. Genomics 2019, 1718741 (2019).
Martin, J. L. et al. Evaluation of salivary transcriptome markers for the early detection of oral squamous cell cancer in a prospective blinded trial. SaT 14, 14–0 (2015).
Bouza, M., Gonzalez-Soto, J., Pereiro, R., de Vicente, J. C. & Sanz-Medel, A. Exhaled breath and oral cavity VOCs as potential biomarkers in oral cancer patients. J. Breath. Res. 11, 016015 (2017).
Chen, C., Kuo, T. & Wu, M. Arsenic and cancers. Lancet 331, 414–415 (1988).
Kaci, G. et al. Anti-inflammatory properties of Streptococcus salivarius, a commensal bacterium of the oral cavity and digestive tract. Appl. Environ. Microbiol. 80, 928–934 (2014).
American Cancer Society medical and editorial content team. Cancer treatment & survivorship facts & figures. https://www.cancer.org/research/cancer-facts-statistics/survivor-facts-figures.html (2019).
Lehew, C. W. et al. Assessing oral cancer early detection: clarifying dentists’ practices. J. Public Health Dent. 70, 93–100 (2010).
Pitiphat, W. et al. Factors associated with delay in the diagnosis of oral cancer. J. Dent. Res. 81, 192–197 (2002).
Peacock, Z. S., Pogrel, M. A. & Schmidt, B. L. Exploring the reasons for delay in treatment of oral cancer. J. Am. Dent. Assoc. 139, 1346–1352 (2008).
Panzarella, V. et al. Diagnostic delay in oral squamous cell carcinoma: the role of cognitive and psychological variables. Int. J. Oral. Sci. 6, 39–45 (2014).
EL-Hakim, I. Delay in oral cancer diagnosis: Who is to blame and are we doing enough? Saudi J. Oral. Sci. 3, 56 (2016).
Rodriguez-Archilla, A. Diagnostic delay in oral cancer. Ann. Clin. Res. Trials 2, 2 (2017).
Walsh, T. et al. Clinical assessment to screen for the detection of oral cavity cancer and potentially malignant disorders in apparently healthy adults. Cochrane Database Syst. Rev. 2013, 11 (2013).
Charanya, D. et al. Adjunctive aids for the detection of oral premalignancy. J. Pharm. Bioallied Sci. 8, S13–S19 (2016).
Abdulhameed, H. A., Kujan, O. & Farah, C. S. The utility of oral brush cytology in the early detection of oral cancer and oral potentially malignant disorders: a systematic review. J. Oral. Pathol. Med. 47, 104–116 (2018).
CDx Diagnostics, Inc. What is the OralCDx Brushtest? https://www.cdxdiagnostics.com/what-is-oralcdx-brushtest/ (2020).
Pallagatti, S. et al. Toluidine blue staining as an adjunctive tool for early diagnosis of dysplastic changes in the oral mucosa. J. Clin. Exp. Dent. 5, e187 (2013).
Nagi, R., Reddy-Kantharaj, Y., Rakesh, N., Janardhan-Reddy, S. & Sahu, S. Efficacy of light based detection systems for early detection of oral cancer and oral potentially malignant disorders: systematic review. Med. Oral. Patol. Oral. Cir Bucal 21, e447 (2016).
Lingen, M. W., Kalmar, J. R., Karrison, T. & Speight, P. M. Critical evaluation of diagnostic aids for the detection of oral cancer. Oral. Oncol. 44, 10–22 (2008).
Giovannacci, I., Vescovi, P., Manfredi, M. & Meleti, M. Non-invasive visual tools for diagnosis of oral cancer and dysplasia: a systematic review. Med. Oral. Patol. Oral. Cir. Bucal 21, e305–e315 (2016).
Guerrero-Preston, R. et al. 16S rRNA amplicon sequencing identifies microbiota associated with oral cancer, human papilloma virus infection and surgical treatment. Oncotarget 7, 51320 (2016).
Zhao, H. et al. Variations in oral microbiota associated with oral cancer. Sci. Rep. 7, 1–10 (2017).
Yang, C. et al. Oral microbiota community dynamics associated with oral squamous cell carcinoma staging. Front. Microbiol. 9, 862 (2018).
Knight, R. et al. Best practices for analysing microbiomes. Nat. Rev. Microbiol 16, 410–422 (2018).
Karpiński, T. M. Role of oral microbiota in cancer development. Microorganisms 7, 20 (2019).
Kim, Y. et al. Mucosal and salivary microbiota associated with recurrent aphthous stomatitis. BMC Microbiol. 16, 57 (2016).
Alanazi, S. A. S. et al. Pathogenic features of Streptococcus mutans isolated from dental prosthesis patients and diagnosed cancer patients with dental prosthesis. Microb. Pathogenesis 116, 356–361 (2018).
Nagata, E., De Toledo, A. & Oho, T. Invasion of human aortic endothelial cells by oral viridans group streptococci and induction of inflammatory cytokine production. Mol. Oral. Microbiol. 26, 78–88 (2011).
Conrads, G. Comparing the cariogenic species Streptococcus sobrinus and S. mutans on whole genome level. J. Oral. Microbiol. 6, 26189 (2014).
Utispan, K., Pugdee, K. & Koontongkaew, S. Porphyromonas gingivalis lipopolysaccharide-induced macrophages modulate proliferation and invasion of head and neck cancer cell lines. Biomed. Pharmacother. 101, 988–995 (2018).
Goncalves, M. et al. Effect of LPS on the viability and proliferation of human oral and esophageal cancer cell lines. Braz. Arch. Biol. Technol. 59, e16150485 (2016).
Li, M. et al. SalK/SalR, a two-component signal transduction system, is essential for full virulence of highly invasive Streptococcus suis serotype 2. PLoS ONE 3, e2080 (2008).
Matilla, M. A. & Krell, T. The effect of bacterial chemotaxis on host infection and pathogenicity. FEMS Microbiol. Rev. 42, fux052 (2018).
Goodwin, A. C. et al. Polyamine catabolism contributes to enterotoxigenic Bacteroides fragilis-Induced colon tumorigenesis. Proc. Natl Acad. Sci. USA 108, 15354 (2011).
Palmer, A. J., Ghani, R. A., Kaur, N., Phanstiel, O. & Wallace, H. M. A putrescine–anthracene conjugate: a paradigm for selective drug delivery. Biochem. J. 424, 431–438 (2009).
Moreno-Sánchez, R. et al. PhysiologicaL role of glutamate dehydrogenase in cancer cells. Front. Oncol. 10, 429 (2020).
Spinelli, J. B. et al. Metabolic recycling of ammonia via glutamate dehydrogenase supports breast cancer biomass. Science 358, 941–946 (2017).
Hughes, M. F. Arsenic toxicity and potential mechanisms of action. Toxicol. Lett. 133, 1–16 (2002).
The 8th edition of the American Joint Committee on Cancer/Union for International Cancer Control (AJCC/UICC) tumour-node-metastasis (TNM) staging system. https://www.facs.org/Quality-Programs/Cancer/AJCC (2019).
Tang, K. D. et al. Oral HPV16 prevalence in oral potentially malignant disorders and oral cavity cancers. Biomolecules 10, 223 (2020).
Dempster, A. P., Laird, N. M. & Rubin, D. B. Maximum likelihood from incomplete data via the EM algorithm. R. Stat. Soc. 39, 1–20 (1977).
Kanehisa, M. & Goto, S. KEGG: Kyoto encyclopedia of genes and genomes. Nucleic Acids Res. 28, 27–30 (2000).
Aitchison, J. The statistical analysis of compositional data. J. R. Stat. Soc: Ser. B (Methodol.) 44, 139–160 (1982).
Martín-Fernández, J. A., Josep, A., Barcelo-Vidal, C. & Pawlowsky-Glahn, V. Dealing with zeros and missing values in compositional data sets using nonparametric imputation. Math. Geol. 35, 253–278 (2003).
Pedregosa, F. et al. Scikit-learn: machine learning in Python. J. Mach. Learn. Res. 12, 2825–2830 (2011).
Friedman, J., Trevor, H. & Tibshirani, R. The Elements of Statistical Learning (Springer series in statistics New York, 2001).
Acknowledgements
C.P. is funded by the Cancer Australia grant (APP1145657) and the Garnett Passé and Rodney Williams Foundation.
Author information
Authors and Affiliations
Contributions
G.B., C.P., and M.V. designed the study and wrote the manuscript. C.P. coordinated the sample and clínical data acquisition. R.T., Y.K.L., and K.T. collected samples and managed the sample logistics. R.T. and M.V. performed the lab analysis. F.C., P.J.T., and M.P. developed the bioinformatics pipeline. O.O. developed the machine-learning models, generated visualizations along with S.G., and contributed to writing. H.T. and N.D. guided the data analysis and contributed to writing. A.P. and S.R. interpreted the features and contributed to writing. L.K. recruited the patients and provided clinical data. S.A. interpreted the clinical data and contributed to writing. G.B. guided the analysis and coordinated the project.
Corresponding authors
Ethics declarations
Competing interests
The following authors are/were employees of Viome Inc, a commercial for-profit company, at the time of their contributions: G.B., O.O., R.T., S.R., F.C., P.J.T., S.G., M.P., A.P., H.T., and M.V. For the other authors there is no conflict of interest to the best of our knowledge.
Additional information
Publisher’s note Springer Nature remains neutral with regard to jurisdictional claims in published maps and institutional affiliations.
Supplementary information
Rights and permissions
Open Access This article is licensed under a Creative Commons Attribution 4.0 International License, which permits use, sharing, adaptation, distribution and reproduction in any medium or format, as long as you give appropriate credit to the original author(s) and the source, provide a link to the Creative Commons license, and indicate if changes were made. The images or other third party material in this article are included in the article’s Creative Commons license, unless indicated otherwise in a credit line to the material. If material is not included in the article’s Creative Commons license and your intended use is not permitted by statutory regulation or exceeds the permitted use, you will need to obtain permission directly from the copyright holder. To view a copy of this license, visit http://creativecommons.org/licenses/by/4.0/.
About this article

Cite this article
Banavar, G., Ogundijo, O., Toma, R. et al. The salivary metatranscriptome as an accurate diagnostic indicator of oral cancer. npj Genom. Med. 6, 105 (2021). https://doi.org/10.1038/s41525-021-00257-x
Received:
Accepted:
Published:
DOI: https://doi.org/10.1038/s41525-021-00257-x
