
Abstract
Purpose
Genetic testing is routine practice for individuals with unexplained developmental disabilities and multiple congenital anomalies. However, current testing pathways can be costly and time consuming, and the diagnostic yield low. Genome-wide sequencing, including exome sequencing (ES) and genome sequencing (GS), can improve diagnosis, but at a higher cost. This study aimed to assess the cost-effectiveness of genome-wide sequencing in Ontario, Canada.
Methods
A cost-effectiveness analysis was conducted using a discrete event simulation from a public payer perspective. Six strategies involving ES or GS were compared. Outcomes reported were direct medical costs, number of molecular diagnoses, number of positive findings, and number of active treatment changes.
Results
If ES was used as a second-tier test (after the current first-tier, chromosomal microarray, fails to provide a diagnosis), it would be less costly and more effective than standard testing (CAN$6357 [95% CI: 6179–6520] vs. CAN$8783 per patient [95% CI: 2309–31,123]). If ES was used after standard testing, it would cost an additional CAN$15,228 to identify the genetic diagnosis for one additional patient compared with standard testing. The results remained robust when parameters and assumptions were varied.
Conclusion
ES would likely be cost-saving if used earlier in the diagnostic pathway.
INTRODUCTION
Genetic testing is part of standard-of-care for individuals with unexplained developmental disabilities (DD) and multiple congenital anomalies (MCA).1 These disorders are both clinically and genetically heterogeneous and it can be challenging to establish a molecular diagnosis. It is estimated that 20% to 62% of these individuals remain undiagnosed after comprehensive clinical assessment.2 A genetic diagnosis can be key to understanding the cause and expected natural history of the condition, avoiding unnecessary testing, optimizing management, and facilitating appropriate support systems (including connecting families to disease-specific support groups).3,4
Current guidelines recommend taking a stepwise approach when a genetic cause is suspected to explain the findings of DD and/or MCA in patient.3,5,6 Chromosomal microarray (CMA) is usually used as a first-tier test and the addition of fragile X syndrome testing is recommended as first-tier in people with DD. If no diagnosis is established, and depending on the clinical presentation, targeted single-gene tests or gene panels may be used to evaluate single-nucleotide variants (SNVs) and small insertions and deletions (indel) as potentially disease-causing. Biochemical/metabolic workups and neuroimaging may also be employed as part of the diagnostic care pathway. Unfortunately, the testing pathway can be both costly and time consuming, and the diagnostic yield low.1
Exome sequencing (ES) and genome sequencing (GS) are newer methods for diagnosing genetic disorders and can provide a higher detection rate than CMA.7 ES can detect SNVs and indel variants but at this time has limited ability to detect copy-number variations (CNVs) and complex structural variations.8 GS has the potential to capture all classes of genomic variations in a single test. Although ES and GS are promising technologies, there are limitations and challenges for their use in clinical practice. Genome-wide sequencing can result in variants of unknown significance (VUS) and interpreting and acting upon these variants is very challenging. In addition, depending on local protocols, sequencing can generate secondary findings that are medically actionable but unrelated to the primary purpose of testing. Return of secondary findings may be beneficial to prevent or better manage certain health conditions (e.g., hereditary breast and ovarian cancer syndrome, Lynch syndrome, and familial hypercholesterolemia), but they may also increase the downstream health-care costs associated with diagnostic workup, surveillance, and prophylactic management.
In recent years, economic evidence for genome-wide sequencing9,10,11,12,13,14,15,16 is starting to emerge to inform funding decisions, as this new technology is being increasingly sought in clinical practice. However, there were very few model-based economic evaluations,9,10 and most studies were based on cohort studies with small sample sizes.11,12,13,14,15,16 The definition of standard-of-care diagnostic testing varied across studies, and genome-wide sequencing strategies also varied from one study to another, making it difficult to compare the results. Furthermore, very few studies addressed when in the diagnostic pathway genome-wide sequencing should be used (e.g., first-tier, second-tier, or after standard testing). The study objective was to assess the cost-effectiveness of ES or GS used at different timepoints (tiers) in the diagnostic pathway in people with unexplained DD and MCA using an economic model.
MATERIALS AND METHODS
A cost-effectiveness analysis was constructed to predict the costs and outcomes associated with different genomic testing strategies. The following diagnostic outcomes were used to measure the effectiveness: number of molecular diagnoses (primary findings only, i.e., genetic variants directed related to DD and MCA), number of positive genetic findings (including primary and secondary findings), and number of people whose active clinical management was changed by a diagnosis, defined as modifications to medications, procedures or treatment. To predict the short-term impact of different testing strategies on costs and outcomes, a three-year time horizon was used, starting from the patient’s first appointment with a medical geneticist. If a positive result was not reported within the time horizon due to delays within the health-care system, such as wait time to see a medical geneticist, it was treated as a negative finding. A longer time horizon was not used because there is limited evidence on the long-term impact of genome-wide sequencing on patient management, use of health resources, and health outcomes. The analysis was conducted from a Canadian public health-care payer perspective. Costs and outcomes were discounted at 1.5% per year.17
Genetic testing strategies
Seven testing strategies were compared:
-
1.
Standard testing: conventional testing without genome-wide sequencing (i.e., first-tier CMA ± fragile X ± second-tier targeted single-gene tests or gene panels) (Fig. 1).
Fig. 1: Standard testing pathway and current testing pathway with exome sequencing (ES). 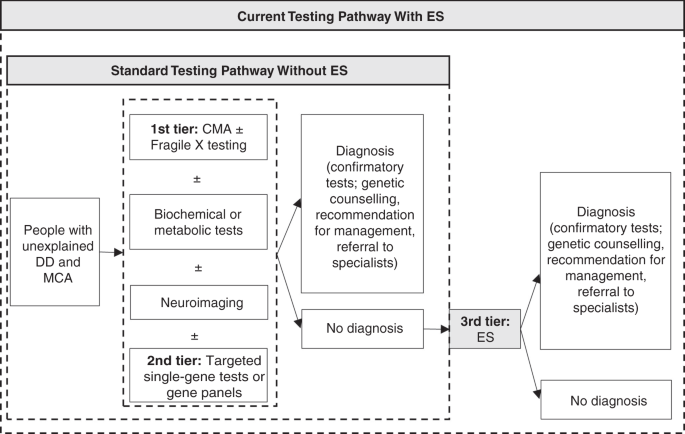
CMA chromosomal microarray, DD developmental disability, MCA multiple congenital anomalies.
-
2.
ES after standard testing: using ES as third-tier after standard testing fails to provide a diagnosis.
-
3.
ES as second-tier: using ES after the current first-tier test, CMA, fails to provide a diagnosis.
-
4.
ES alone as first-tier: using ES as first-tier and then CMA as second-tier if there is no diagnosis.
-
5.
ES + CMA as first-tier: using both tests concurrently as first-tier.
-
6.
GS after standard testing: using GS as third-tier after standard testing fails to provide a diagnosis.
-
7.
GS as first-tier: using GS as first-tier.

For all testing strategies, it was assumed that trio testing (in proband and unaffected parents) was used 90% of the time and the remaining 10% was proband only based on Ontario data.
Model structure
A discrete event simulation model was constructed to represent patients at an individual level and account for the differences between testing strategies in wait time for genetic services and for test results (Fig. 2). A hypothetical cohort of 1000 patients with unexplained DD and/or MCA was simulated. Each simulated patient was assigned to have either DD (with or without MCA) or MCA only. If the patient has MCA only, he/she would not receive fragile X testing. Wait times and test turnaround time were randomly generated from distributions estimated from published literature or in consultation with clinical experts.

DD developmental disability, ES exome sequencing, MCA multiple congenital anomalies, VUS variants of uncertain significance.
In the model, the diagnostic pathway was represented by a series of sequential events. First, the patient would receive the initial pretest genetic services (visits with a medical geneticist and a genetic counselor). Next, samples would be taken from the patient (proband) and both parents (if available and if applicable) and sent to the laboratory for genetic testing. The test result would be returned to the ordering physician within a few weeks, depending on the turnaround time of the genetic test. Each patient could receive either a positive or negative result. For genome-wide sequencing, positive results could include primary findings only, secondary findings only, or both; negative results could include uncertain results (i.e., VUS) or clear null findings (i.e., likely benign variants and known benign variants). Results would be discussed with the patient’s family either in a face-to-face meeting (for positive or uncertain results) or in a telephone call (for clear null findings). If a patient had a positive result, he/she would exit the model after receiving post-test genetic services. If a patient had a negative result, he/she would continue with further genetic tests until the end of the testing strategy. The model was developed using TreeAge Pro 2019 (TreeAge Software, Williamstown, MA, USA).
Model assumptions
The unit of analysis was each patient with DD and/or MCA. Costs of sequencing and confirmatory testing in parents were assigned to the patient for the purpose of analysis, and the consequences in parents were not considered. Currently it is difficult to detect fragile X syndrome reliably with genome-wide sequencing.18 Therefore, it was assumed that at this time fragile X syndrome cannot be detected by CMA, ES, or GS. The cost of fragile X testing was included for individuals with DD, but the diagnostic yield from fragile X testing was not counted in the outcome since it was very small on its own.19 Similarly, since the diagnostic yields of biochemical/metabolic tests and neuroimaging alone are very small (<1–5% and 0.2–2.2%, respectively),3 their diagnostic yields were not counted in the outcome and only costs of these tests were included. It was assumed that invasive diagnostic procedures such as muscle and skin biopsies could be averted by genome-wide sequencing. Finally, while the costs of returning secondary findings has been included as post-test genetic services (genetic consultation and counseling), due to the inherent challenges of modeling the benefits and downstream costs associated with unpredictable secondary findings, they were excluded from the analysis.
Model parameters
Table 1 presents the clinical parameters, obtained from a systematic review of the clinical literature.20 The diagnostic yields of ES and GS were determined by tier. The diagnostic yield of ES after standard testing (third-tier) was estimated to be 0.33 (95% confidence interval [CI]: 0.30, 0.37, n = 6,091) based on pooled estimates of 19 studies, and the diagnostic yield of ES as first-tier was estimated to be 0.37 (95% CI: 0.27, 0.49, n = 706) based on five studies. Since only two studies evaluated the use of ES as second-tier, the diagnostic yield of second-tier ES was assumed to be between the yields of first- and third-tier ES (0.35). The diagnostic yield of GS after standard testing was estimated to be 0.32 (95% CI: 0.24, 0.42, n = 353) based on four studies, and the diagnostic yield of GS as first-tier was estimated to be 0.46 (95% CI: 0.36, 0.57, n = 295) based on five studies.
Diagnostic yields of proband and trio testing could not be reliably estimated separately because many of the included studies used a mix of proband and trio testing, and some did not report clearly whether proband or trio testing was used. For the 34 included studies of ES, the proportion of trio tests was approximately 80%, which is close to the estimated percentage of trio testing in Ontario (90%). Therefore, the diagnostic yields of genome-wide sequencing were not adjusted.
A total of nine studies that included genome-wide sequencing (ES or GS) and standard testing were identified. Based on these studies, the weighted average yield of standard testing was estimated to be 0.21 (95% CI: 0.14, 0.29, n = 992).20 The diagnostic yield of CMA in the target population was estimated using studies systematically identified by Miller et al.1 (see Figure S1). The weighted average yield of CMA was 0.10 (95% CI: 0.09–0.12, n = 21,698, 33 studies), and this is consistent with other published studies in this patient population.3,7,21 For concurrent testing with ES and CMA, due to limited data, the yield was assumed to be the sum of ES and CMA since they detect different types of genetic variations and are considered complementary to each other.
The likelihood of identifying a VUS was found to be 17% based on pooled estimates of five ES and GS studies (95% CI: 0.10, 0.26, n = 1996). The yield of medically actionable secondary findings was estimated to be 7% based on 14 studies (95% CI: 0.04, 0.10, n = 4576). For clinical utility, it was estimated that 16.7% of people who were diagnosed had a change in active clinical management. Test turnaround time and wait time for post-test genetic services were obtained from clinical experts and laboratory websites.
Table 2 presents the resource use and cost parameters. The following types of costs were included: pre- and post-test genetic consultation and genetic counseling, and cost of genetic tests (e.g., CMA, ES, GS, fragile X testing, targeted single-gene tests and gene panels) and nongenetic tests and procedures (e.g., biochemical/metabolic workup, neuroimaging, invasive tests and procedures, echocardiogram, electroencephalogram). All cost items are expressed in 2019 Canadian dollars. The cost of ES was estimated based on the average price paid by the Out-of-Country Prior Approval Program as ES is currently funded through this program. The expected costs of conducting ES and GS in local laboratories were obtained from a recently published Ontario microcosting study by Jegathisawaran et al.9 Using a bottom-up approach, the microcosting study captured all relevant cost components from blood draw to returning laboratory results back to the ordering physician. The cost of GS was estimated based on the Illumina HiSeq X™ platform with a 30–45× read depth. It should be noted that the specific equipment and protocol used by the laboratory may impact both yield and cost of ES and GS. For the cost of the comparator (standard testing), because the patient population is very heterogeneous and there is also variation in how clinicians order genetic tests, it would be difficult to derive a single estimate of the total costs. Therefore, the cost of standard testing was estimated from the literature based on real-world Ontario data.22
Analysis
For the reference case, probabilistic analysis was conducted to capture parameter uncertainty. When possible, distributions around input parameters were specified using the mean and standard deviation. Selected cost parameters were characterized by lognormal or normal distributions, and probabilities were characterized by beta distributions. The expected values of costs and outcomes for each testing strategy were calculated based on a total of 1,000,000 simulations. The probability of each testing strategy being cost-effective was presented over a range of thresholds on a cost-effectiveness acceptability curve (Figure S2). Structural and parameter uncertainties were also addressed by conducting a series of probabilistic scenario analyses (Table S1).
RESULTS
The results showed that early use of genome-wide sequencing in the diagnostic pathway could save on costs and improve diagnostic yield compared to standard testing (Table 3). Four genome-wide testing strategies had lower cost and higher diagnostic yield than standard testing (CAN$8783 per patient). ES as second-tier (after patients have no diagnosis from CMA alone) was the least costly testing strategy (CAN$6357 per patient), followed by ES alone as first-tier (CAN$6755 per patient), ES + CMA as first-tier (CAN$6985 per patient), and GS as first-tier (CAN$7811 per patient). Using ES or GS after standard testing were the most costly strategies, which cost CAN$12,041 and CAN$12,958 per patient, respectively. For every 1000 people tested, ES + CMA as first-tier led to the highest number of molecular diagnoses (466), positive findings (515), and active treatment changes (87) within the model time horizon (3 years). Standard testing resulted in the lowest number of molecular diagnoses (185), positive findings (185), and active treatment changes (31). ES + CMA as first-tier was considered to have absolute dominance over several strategies (i.e., over GS as first-tier, standard testing, ES after standard testing, and GS after standard testing) because it was less costly and more effective. ES alone as first-tier was less cost-effective compared with ES + CMA as first-tier. Compared with ES as second-tier after CMA alone, ES + CMA as first-tier demonstrated an incremental cost of CAN$11,831 per additional molecular diagnosis, CAN$10,848 per additional positive finding, and CAN$64,082 per active treatment change.
Results of the scenario analyses are presented in Table S1. The results remained robust when parameters and assumptions were changed, including time horizon, discount rate, proportion of trios, diagnostic yield of standard testing, cost of standard testing, cost of post-test activities, unit price of electroencephalogram, and rate of secondary findings.
DISCUSSION
Clinical practice is rapidly transforming to incorporate the use of genome-wide sequencing. This analysis explored the cost-effectiveness of using ES/GS at various timepoints in the diagnostic testing pathway. All strategies involving earlier use of genome-wide sequencing were found to be less costly and more effective compared with standard testing.
The costs of ES and GS were high relative to other genetic tests in the diagnostic pathway, such as CMA. However, the cumulative cost of the standard testing approach is high, and associated with a prolonged time to diagnosis and a low yield. ES as second-tier was the least costly testing strategy, and ES + CMA as first-tier had the highest diagnostic yield among all strategies.
A significant benefit of using genome-wide sequencing earlier in the diagnostic pathway is that patients may receive a more timely diagnosis. Currently used testing approaches can take many months and sometimes even years to reach a diagnosis. Oei et al. found that in children with an elusive diagnosis requiring complex care undergoing standard testing in Ontario, the majority used a high volume of genetic tests (median of 4) over a median of more than 2 years, and most remained undiagnosed.22 Children with no genetic diagnosis received a greater proportion of sequence-level testing (e.g., single-gene or gene panel tests). Standard testing is usually conducted in a stepwise manner and requires the clinician to make diagnostic hypotheses regarding putative candidate genes based on the patient’s clinical symptoms. Genome-wide sequencing, on the contrary, is a broader approach and if used early in the diagnostic pathway, time to diagnosis can be shortened in some patients. This analysis showed that when the time horizon was shortened to one year, fewer people undergoing standard testing would receive a molecular diagnosis (85 fewer molecular diagnoses in every 1000 people tested compared to the reference case). However, for testing strategies involving early use of ES/GS, the number of people who received a molecular diagnosis remained the same.
The findings clearly show that genome-wide sequencing, applied to appropriate individuals and ordered and interpreted by medical specialists, can save both time and resources for individuals and their families. This is consistent with results from economic analyses based on cohort studies.11,12,13,14,15,16 Because ES is not currently used as a first-tier diagnostic test,23 averted testing is less relevant as a measure of clinical utility because most of the clinical investigations have already occurred. Also, metabolic and imaging tests are usually used together with genetic testing to fully understand the disease. Compared with some published studies, which assumed a significant portion of nongenetic tests to be averted by genome-wide sequencing,11,12,13,14,15 this analysis was very conservative and assumed that only invasive procedures, such as skin or muscle biopsy (in 2.5% of the target population), could be averted. Nevertheless, strategies involving earlier use of genome-wide sequencing were found to be cost-saving compared with standard testing because of other genetic tests avoided.
Overall, the cost-effectiveness results were most sensitive to the cost of ES or GS. The cost of ES or GS varies based on many factors, such as where the test is conducted (Ontario vs. elsewhere), sequencing platforms (NovaSeq 6000 vs. HiSeq X vs. HiSeq 2500 vs. NextSeq 550, etc.), and total laboratory test volume and capacity. The unit cost of ES and GS could be potentially reduced by achieving an economy of scale that maximizes patient throughput. However, Jegathisawaran et al. found that while there was considerable cost reduction for proband testing when the total test volume doubled (13.3% for ES on the HiSeq 2500 platform and 12% for GS on the HiSeq X platform), there was minimal cost reduction for trios at increasing test volumes (1.6% for GS on the HiSeq X platform).24 This is because trio testing already increased the number of tests by three factors (from proband only to proband plus two parents). The relatively minimal cost reduction for trios was attributable to its equipment and follow-up costs constituting a smaller part of total costs compared with the three-factor increase in the cost of reagents and computation over singleton testing. Finally, due to advances in sequencing technology, the cost of ES/GS has continued to drop;25 it is uncertain whether the cost of ES/GS will continue to drop in the next few years.
This analysis presented herein has several strengths. First, it was based on high-quality Ontario costing data. The precise costs associated with CMA, ES, and GS (proband and trio) in Ontario were obtained from a recently updated microcosting study in the target population. The cost of standard testing was also estimated based on several Ontario studies21,22,26 and inputs from clinical experts. Second, this analysis included a comprehensive list of possible testing strategies involving ES/GS to help decision makers determine the optimal positioning of ES/GS in the diagnostic care pathway. Although the most common testing strategies involving ES/GS were considered, there are likely other testing strategies, such as performing GS after ES, that could be used in clinical practice but require evaluation. Finally, compared with most published economic studies, which considered proband testing only, this analysis evaluated trio test costs, which reflects recommended clinical practice. Traditionally, ES and GS have been conducted with probands only due to the high cost of ES/GS. However, the use of trio testing (including the two biological parents) is on the rise in recent years since this sequencing method enhances both the speed and likelihood of accurate diagnosis.27
There were some important limitations to this analysis. First, the long-term costs and consequences related to primary or secondary findings were not modeled due to a lack of data. It is uncertain what effect these omissions may have on the results. A recent Ontario study by Hayeems et al. described the type and cost of health-care activities in a cohort of children with developmental delay one year after receiving the CMA and GS results.28 They found that in complex pediatric care, post-test activities were mainly driven by the child’s ongoing care (88.6%), rather than by CMA or GS results. The mean post-test cost was CAN$136 (median $0, range $0–$3595) for CMA if there is no diagnosis, CAN$77 for GS if there is no diagnosis (median $0, range $0–$4826), and CAN$180 for diagnostic GS (median $0, range $0–$1212). These post-test costs from the Hayeems study were included in a scenario analysis and the cost-effectiveness results remained similar. Second, in this analysis clinical utility was defined as a change in active clinical management (e.g., modifications to medications, procedures or treatment) as a result of having a diagnosis. In the literature, the definition of what constituted a clinical management activity and what was reported varied. Modifications to medications, procedures, or treatment were grouped together as these activities are expected to have a short-term effect on patient outcomes. Those activities expected to have a longer-term effect on health, such as referral to specialists, surveillance, or lifestyle changes, were not included. This captures clinical utility for diagnosed individuals only, but not for undiagnosed individuals (e.g., further testing avoided due to ES/GS). Third, effectiveness was not measured using quality-adjusted life years (QALYs) (a universal outcome measure), but instead clinical outcomes such as the number of molecular diagnoses, positive findings, and active treatment change. Without a commonly used budget allocation threshold for these outcomes, it may be difficult to interpret the cost-effectiveness results and compare them with economic evaluations of other health technologies. However, QALYs could not be used as an outcome measure because data required to estimate QALYs are seldom available for genomic technologies. Fourth, in some cases, clinicians may request reanalysis in 1 year if ES is unrevealing, i.e., the patient’s clinical presentation is still not explained after clinical ES and new information on pathogenic variants may have become available. However, reanalysis was not considered in this model as it is not done routinely. Including reanalysis will likely make ES and GS more costly compared with standard testing but potentially cost-effective compared with single-analysis ES or GS since the cost of reanalysis is lower and more diagnoses will likely be identified as more is learned about causal variants in this patient population. Also, for concurrent testing with ES and CMA, due to limited data, the yield was assumed to be the sum of ES and CMA since they detect different types of genetic variations and are considered complementary to each other. However, as ES is increasingly able to detect CNVs, the diagnostic yield of ES may overlap with that of CMA. Studies have found that using ES to detect clinically relevant CNVs can increase the yield by 1.6–2%.29,30 The diagnostic yield of GS was also estimated based on the current available literature. However, since only a limited number of GS studies have been published, the cost-effectiveness results may need to be re-evaluated in the near future as new evidence becomes available. Finally, while the availability of Ontario data has facilitated this analysis, region- and country-specific differences in practice patterns and unit prices would need to be taken into consideration when generalizing the results to other settings.
Conclusion
The study results indicated that compared with standard testing alone, incorporating ES after standard testing increased diagnostic yield at an additional cost. Early use of ES yielded more diagnoses at a lower cost compared with late use of ES or standard testing alone. Early use of ES/GS could enable more timely diagnosis for patients with unexplained DD and MCA.
References
Miller DT, Adam MP, Aradhya S, Biesecker LG, Brothman AR, Carter NP, et al. Consensus statement: chromosomal microarray is a first-tier clinical diagnostic test for individuals with developmental disabilities or congenital anomalies. Am J Hum Genet. 2010;86:749–64.
Jimenez-Gomez A, Standridge SM. A refined approach to evaluating global developmental delay for the international medical community. Pediatr Neurol. 2014;51:198–206.
Bélanger SA, Caron J. Evaluation of the child with global developmental delay and intellectual disability. Paediatr Child Health. 2018;23:403–10.
Sun F, Oristaglio J, Levy SE, Hakonarson H, Sullivan N, Fontanarosa J, et al. AHRQ comparative effectiveness technical briefs. Genetic testing for developmental disabilities, intellectual disability, and autism spectrum disorder. Rockville, MD: US Agency for Healthcare Research and Quality; 2015.
Moeschler JB, Shevell M. Comprehensive evaluation of the child with intellectual disability or global developmental delays. Pediatrics. 2014;134:e903–18.
Michelson DJ, Shevell MI, Sherr EH, Moeschler JB, Gropman AL, Ashwal S. Evidence report: Genetic and metabolic testing on children with global developmental delay: report of the Quality Standards Subcommittee of the American Academy of Neurology and the Practice Committee of the Child Neurology Society. Neurology. 2011;77:1629–35.
Clark MM, Stark Z, Farnaes L, Tan TY, White SM, Dimmock D, et al. Meta-analysis of the diagnostic and clinical utility of genome and exome sequencing and chromosomal microarray in children with suspected genetic diseases. NPJ Genom Med. 2018;3:16.
Genetic Testing Advisory Committee. Use of genome‐wide sequencing for undiagnosed rare genetic diseases in Ontario. Ontario Ministry of Health and Long-Term Care. December 2016. http://www.health.gov.on.ca/en/pro/programs/gtac/docs/gtac_report_use_of_gws_for_undiagnosed_rare_genetic_diseases.pdf. Accessed 15 January 2019.
Jegathisawaran J, Tsiplova K, Ungar WJ. Supplement—a microcosting and cost-consequence analysis of genomic testing strategies (including trios) in children with congenital anomalies and developmental delay: an update. The Hospital for Sick Children Technology Assessment at SickKids (TASK). 2019. http://lab.research.sickkids.ca/task/wp-content/uploads/sites/66/2019/02/CMA-DD-Supplement-A_2018-01_FINAL.pdf. Accessed 22 February 2019.
Dragojlovic N, Elliott AM, Adam S, van Karnebeek C, Lehman A, Mwenifumbo JC, et al. The cost and diagnostic yield of exome sequencing for children with suspected genetic disorders: a benchmarking study. Genet Med. 2018;20:1013–21.
Ewans LJ, Schofield D, Shrestha R, Zhu Y, Gayevskiy V, Ying K, et al. Whole-exome sequencing reanalysis at 12 months boosts diagnosis and is cost-effective when applied early in Mendelian disorders. Genet Med. 2018;29:29.
Tan TY, Dillon OJ, Stark Z, Schofield D, Alam K, Shrestha R, et al. Diagnostic impact and cost-effectiveness of whole-exome sequencing for ambulant children with suspected monogenic conditions. JAMA Pediatr. 2017;171:855–62.
Stark Z, Schofield D, Alam K, Wilson W, Mupfeki N, Macciocca I, et al. Prospective comparison of the cost-effectiveness of clinical whole-exome sequencing with that of usual care overwhelmingly supports early use and reimbursement. Genet Med. 2017;19:867–74.
Schofield D, Alam K, Douglas L, Shrestha R, MacArthur DG, Davis M, et al. Cost-effectiveness of massively parallel sequencing for diagnosis of paediatric muscle diseases. NPJ Genom Med. 2017;2:4.
Vissers LELM, van Nimwegen KJM, Schieving JH, Kamsteeg E-J, Kleefstra T, Yntema HG, et al. A clinical utility study of exome sequencing versus conventional genetic testing in pediatric neurology. Genet Med. 2017;19:1055–63.
Monroe GR, Frederix GW, Savelberg SM, de Vries TI, Duran KJ, van der Smagt JJ, et al. Effectiveness of whole-exome sequencing and costs of the traditional diagnostic trajectory in children with intellectual disability. Genet Med. 2016;18:949–56.
Guidelines for the economic evaluation of health technologies: Canada. 4th ed. Ottawa: Canadian Agency for Drugs and Technologies in Health; 2017.
Liu Q, Zhang P, Wang D, Gu W, Wang K. Interrogating the “unsequenceable” genomic trinucleotide repeat disorders by long-read sequencing. Genome Med. 2017;9:65.
Yuen T, Carter MT, Szatmari P, Ungar WJ. Cost-effectiveness of genome and exome sequencing in children diagnosed with autism spectrum disorder. Appl Health Econ Health Policy. 2018;16:481–93.
Ontario Health (Quality). Genome-wide sequencing for unexplained developmental disabilities or multiple congenital anomalies: a health technology assessment. Ont Health Technol Assess Ser. 2020;20:1–178.
Stavropoulos DJ, Merico D, Jobling R, Bowdin S, Monfared N, Thiruvahindrapuram B, et al. Whole genome sequencing expands diagnostic utility and improves clinical management in pediatric medicine. NPJ Genom Med. 2016;1:15012.
Oei K, Hayeems RZ, Ungar WJ, Cohn RD, Cohen E. Genetic testing among children in a complex care program. Children (Basel, Switzerland). 2017;4:42.
Srivastava S, Love-Nichols JA, Dies KA, Ledbetter DH, Martin CL, Chung WK, et al. Meta-analysis and multidisciplinary consensus statement: exome sequencing is a first-tier clinical diagnostic test for individuals with neurodevelopmental disorders. Genet Med. 2019;21:2413–21.
Jegathisawaran J, Tsiplova K, Hayeems R, Ungar WJ. Determining accurate costs for genomic sequencing technologies-a necessary prerequisite. J Community Genet. 2020;11:235–238.
National Human Genome Research Institute. The cost of sequencing a human genome. [cited 2019 May 27]. https://www.genome.gov/about-genomics/fact-sheets/Sequencing-Human-Genome-cost.
Lionel AC, Costain G, Monfared N, Walker S, Reuter MS, Hosseini SM, et al. Improved diagnostic yield compared with targeted gene sequencing panels suggests a role for whole-genome sequencing as a first-tier genetic test. Genet Med. 2017;20:435.
Wright CF, Fitzgerald TW, Jones WD, Clayton S, McRae JF, van Kogelenberg M, et al. Genetic diagnosis of developmental disorders in the DDD study: a scalable analysis of genome-wide research data. Lancet. 2015;385:1305–14.
Hayeems RZ, Bhawra J, Tsiplova K, Meyn MS, Monfared N, Bowdin S, et al. Care and cost consequences of pediatric whole genome sequencing compared to chromosome microarray. Eur J Hum Genet. 2017;25:1303–12.
Pfundt R, Del Rosario M, Vissers L, Kwint MP, Janssen IM, de Leeuw N, et al. Detection of clinically relevant copy-number variants by exome sequencing in a large cohort of genetic disorders. Genet Med. 2017;19:667–75.
Marchuk DS, Crooks K, Strande N, Kaiser-Rogers K, Milko LV, Brandt A, et al. Increasing the diagnostic yield of exome sequencing by copy number variant analysis. PLoS one. 2018;13:e0209185.
Baldridge D, Heeley J, Vineyard M, Manwaring L, Toler TL, Fassi E, et al. The Exome Clinic and the role of medical genetics expertise in the interpretation of exome sequencing results. Genet Med. 2017;19:1040–8.
GeneDx. Clinical genomics. 2018. https://www.genedx.com/test-catalog/medical-specialty/xomedx/. Accessed 28 February 2019.
Baylor Genetics Laboratories. Medical genetics test details. 2019. https://www.bcm.edu/research/medical-genetics-labs/test_detail.cfm?testcode=1800. Accessed 28 February 2019.
Rosenberg T, Jacobs HK, Thompson R, Horne JM. Cost-effectiveness of neonatal screening for Duchenne muscular dystrophy-how does this compare to existing neonatal screening for metabolic disorders? Soc Sci Med. 1993;37:541–7.
Joshi C, Kolbe DL, Mansilla MA, Mason SO, Smith RJ, Campbell CA. Reducing the cost of the diagnostic odyssey in early onset epileptic encephalopathies. BioMed Res Int. 2016;2016:6421039.
Medical Advisory Secretariat. Use of contrast agents with echocardiography in patients with suboptimal echocardiography: an evidence-based analysis. Ont Health Technol Assess Ser. 2010;10:1–17.
Green RM, Messick WJ, Ricotta JJ, Charlton MH, Satran R, McBride MM, et al. Benefits, shortcomings, and costs of EEG monitoring. Ann Surg. 1985;201:785–92.
Acknowledgements
The research was conducted with in-kind support from Health Quality Ontario. The opinions expressed in this publication do not necessarily represent the opinions of Health Quality Ontario (now part of Ontario Health), a government agency that supported the completion of this work. We are grateful to June Carroll, Jordan Lerner-Ellis, Robin Hayeems, Kate Tsiplova, and Jathishinie Jegathisawaran for sharing their clinical and technical expertise during the development of this analysis. We are also thankful for Olga Gajic for conducting the model validation. Wendy J. Ungar is supported by a Canada Research Chair in Economic Evaluation and Technology Assessment in Child Health. Kym M. Boycott is supported by a Canada Research Chair in Rare Disease Precision Health. Jathishinie Jegathisawaran, Kate Tsiplova, Olga Gajic, Jordan Lerner-Ellis, Robin Hayeems, June Carroll.
Author information
Authors and Affiliations
Corresponding author
Ethics declarations
Disclosure
K.M.B. and W.J.U. are receiving funding from the Ontario Ministry of Health and Genome Canada to examine the implementation of genome-wide sequencing (GWS) in Ontario. W.J.U. chairs the Ontario Genetics Advisory Committee but did not participate in funding deliberations on GWS. The other authors declare no conflicts of interest.
Additional information
Publisher’s note Springer Nature remains neutral with regard to jurisdictional claims in published maps and institutional affiliations.
Supplementary information
Rights and permissions
About this article

Cite this article
Li, C., Vandersluis, S., Holubowich, C. et al. Cost-effectiveness of genome-wide sequencing for unexplained developmental disabilities and multiple congenital anomalies. Genet Med 23, 451–460 (2021). https://doi.org/10.1038/s41436-020-01012-w
Received:
Revised:
Accepted:
Published:
Issue Date:
DOI: https://doi.org/10.1038/s41436-020-01012-w
Keywords
This article is cited by
-
Retrospective file review shows limited genetic services fail most patients – an argument for the implementation of exome sequencing as a first-tier test in resource-constrained settings
Orphanet Journal of Rare Diseases (2023)
-
Challenges and recommendations to increasing the use of exome sequencing and whole genome sequencing for diagnosing rare diseases in Brazil: an expert perspective
International Journal for Equity in Health (2023)
-
Genomic newborn screening for rare diseases
Nature Reviews Genetics (2023)
-
Bayesian cost-effectiveness analysis of Whole genome sequencing versus Whole exome sequencing in a pediatric population with suspected genetic disorders
The European Journal of Health Economics (2023)
-
Applying the Clinician-reported Genetic testing Utility InDEx (C-GUIDE) to genome sequencing: further evidence of validity
European Journal of Human Genetics (2022)
