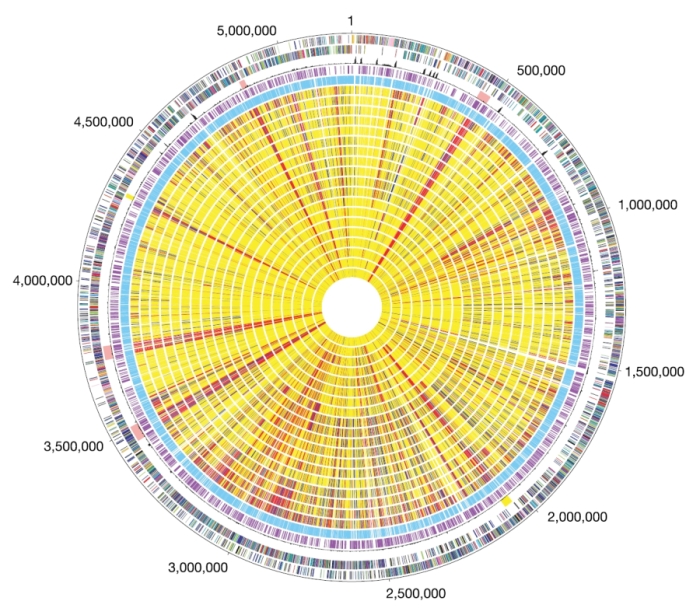
Circular representation of the B. anthracis chromosome and comparative genome hybridizations of B. cereus group strains.
Outer circle, predicted coding regions on the plus strand colour-coded by role categories. Circle 2, predicted coding regions on the minus strand colour-coded by role categories. Circle 3, atypical nucleotide composition curve. Salmon colour, phage regions; yellow, other unique regions located around positions 2.0 and 4.3 Mb. Circle 4, genes not represented on the array. Circle 5, genes present on the array. Genes were classified into three groups: genes present in the query strain (shown yellow), genes absent in the query strain (red), and diverged genes (blue). Missing data are in grey.
This image is linked to the following Scitable pages:


Comments
CloseComments
Please Post Your Comment