Volume 32
-
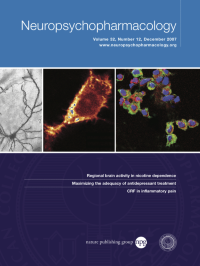
No. 12 December 2007
The cover figure shows CRF receptors on the cell membrane and opioid peptides (Endorphin, Met-Enkephalin) in the cytoplasm of immune cells migrated into inflamed tissue. The cell nucleus is counterstained with DAPI. Courtesy of Prof Shaaban A Mousa, Dr CP Bopaiah, Dr Jan F Richter, Ms Reine S Yamdeu, Prof Michael Schäfer.
-
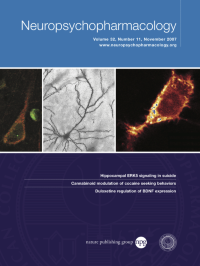
No. 11 November 2007
Confocal microscopy image of HEK293 cells showing transfected human cannabinoid CB1 receptor fused to yellow fluorescent protein. Figure Courtesy of Paulina Carriba, Oskar Ortiz, Kshitij Patkar, Zuzana Justinova, Jessica Stroik, Andrea Themann, Christa Müller, Anima S Woods, Bruce T Hope, Francisco Ciruela, Vicent Casadó , Enric I Canela, Carme Lluis, Steven R Goldberg, Rosario Moratalla, Rafael Franco and Sergi Ferré.
-
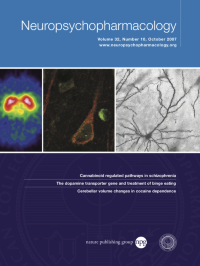
No. 10 October 2007
Pyramidal neuron in the prefrontal cortex of the rat stained with the Golgi-Cox method. Image is a composite stack of 10 images. Picture courtesy of Drs. Emma Perez-Costas, Miguel Melendez-Ferro, and Rosalinda Roberts from the Department of Psychiatry, University of Alabama at Birmingham.
-
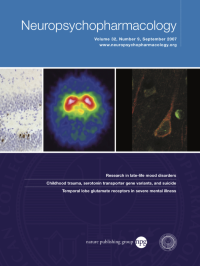
No. 9 September 2007
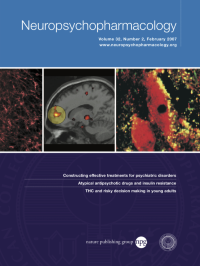
Co-expression of the serotonin 5-HT2A receptor (red) and the p90 ribosomal S6 kinase 2 (green) in cortical neurons. Bonnie Garcia, Douglas J Sheffler, Bryan L Roth, and Ariel Y Deutch, Vanderbilt University, Nashville, TN and University of North Carolina, Chapel Hill, NC.
-
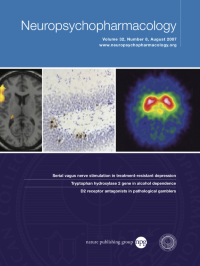
No. 8 August 2007
Axial [123I]-β-CIT SPECT images at the level of the striatum (left) and cerebellum (right) with ROIs in the thalamus (left) and the cerebellar hemispheres (right). Image acquisition 4 h post-injection. The level of radioactivity is color coded from black (low) through green, yellow, red, and white (high) and scaled to the maximum of the study. [Neuropsychopharmacology, 2007, 32, 1661–1668]
-
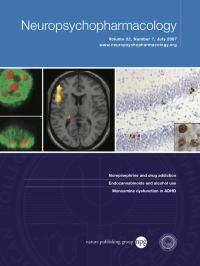
No. 7 July 2007
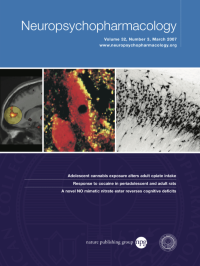
Representative examples of BrdU-labeled cells in the dentate gyrus (a) and in the PFC (b) from sections used for cell quantification. Dentate gyrus: phenotypic analysis with double-labeling revealed that majority of the newborn cells acquired neuronal phenotype (c and g). Representative examples of colocalization of BrdU positivity with the neuronal marker NeuN (c) and the astrocytic marker GFAP (d). PFC: We found no evidence of neurogenesis in the mPFC, instead the newly generated cells differentiated mainly into NG2-positive glia and to a minor portion into endothelial cells (e, f and h). Examples of double labeling of BrdU-positive cells with the glial marker NG2, a marker for synantocytes and oligodendrocyte precursor cells (e) and double labeling of BrdU-positive cells with the endothelial cell marker RECA-1 (f). Scale bar: 100 μm (a and b), 10 μm (c–f), and in insets of a and b. [Neuropsychopharmacology, 2007, 32, 1490–1503]
-
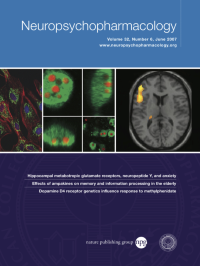
No. 6 June 2007
Nonsmokers (n=13) showed greater increases in BOLD signal from the rest condition in the left inferior frontal gyrus and presupplementary cortex in the incongruent than in the congruent condition. Colors superimposed on the gray scale image, from the single subject T1 brain template of SPM2, indicate values of t according to the color bar. Voxel level height threshold p<0.001, uncorrected. Abbreviations: IFG: inferior frontal gyrus, L: left, pre-SMA: presupplementary motor area, R: right. [Neuropsychopharmacology, 2007, 32, 1421–1428]
-
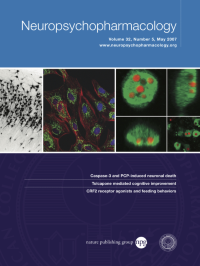
No. 5 May 2007
Confocal images (xy, yz and xz planes) of phencyclidine-induced apoptosis in the hippocampus of a PN7 rat nine hrs after administration (10 mg/kg). Caspase-3 immunoreactivity (green) is largely confined to the cytoplasm surrounding a multifragmented nucleus (red) in which cleaved DNA is visualized using terminal d-UTP nick-end labeling (TUNEL). The lower right panel shows similar caspase-3 and TUNEL staining of layer II–IV parietal cortex neurons 12 hrs after addition of 3 μM PCP to cultured cortical slices. Refer to figures 4f and 7f for additional details. [Neuropsychopharmacology, 2007, 32, 1178–1194]
-
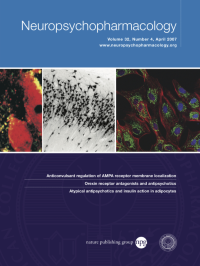
No. 4 April 2007
Immature Schwann cells cultured from neonatal rats are used to investigate the ways in which peripheral nerves mature and respond to injury. The elaborate mitochondrial networks of immature Schwann cells are visible with immunocytochemistry for cytochrome c (green), and the cytoskeletal structure is revealed with the actin counterstain Phalloidin (red). Mitochondria concentrate around the necleus (DAPI counterstain; blue) and radiate throughout the proximal cell body, Courtesy of Rita M Cowell and James W Russell.