
Volume 123 Issue 5, November 2019
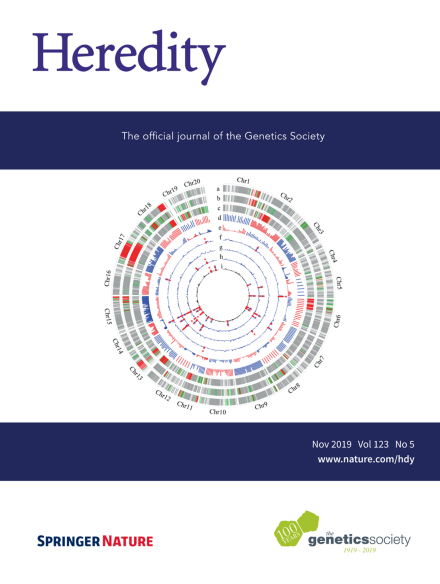
Cover image“‘Effect of marker segregation distortion on linkage map construction and QTL mapping in soybean. a–c: linkage maps including very significantly distorted markers, respectively, in allthe recombinant inbred lines (RILs) (a), orthogonal cross RILs (b) and reciprocal cross RILs (c) from the cross between LSZZH and NN493-1. The significantly distorted markers at the 0.05 and 0.01 probability levels were marked by green and red colors, respectively; d: the collinearity of soybean linkage maps with reference genome (Williams 82). Each Spearman correlation coefficient was calculated from 30 markers; e: recombinant fractions of intervals on all the chromosomes. Each chromosome was uniformly partitioned into twenty intervals; f-i: mapping quantitative trait loci (QTLs) for seed linoleic acid content in soybean, measured in Wuhan 2014 (f), Ezhou 2015 (g), Nanjing 2015 (h) and their BLUP values (i), in all the RILs using genome-wide composite interval mapping (GCIM). The linkage maps used in this study included very significantly distorted markers. The stars with blue and red colors indicate the existence of lipid metabolism related genes and the previously reported QTLs around the QTLs detected in this study, respectively’, copyright [Yuan-Ming Zhang, Huazhong Agricultural University], used with kind permission [Yuan-Ming Zhang, Huazhong Agricultural University]”. For more information, see article 10.1038/s41437-019-0238-7, page 579–592.
Article
-
Advertisement
