Figures, tables and video
From the following article
Gastroesophageal reflux monitoring: pH and impedance
Radu Tutuian and Donald O. Castell
GI Motility online (2006)
doi:10.1038/gimo31
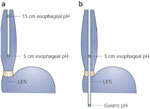
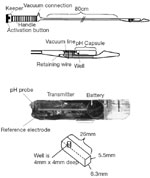
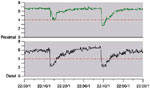
Figure 3
Reflux episode identified by pH monitoring as a rapid drop in pH from above to below 4.0 distally longer than proximal.
Full size figure and legend (22K)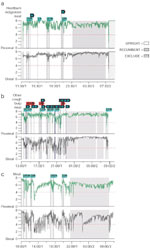
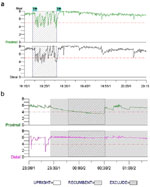
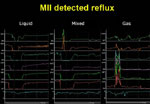
Figure 6
Impedance changes produced by liquid, mixed, or gas boluses.
Full size figure and legend (51K)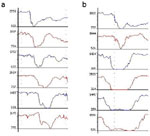
Figure 7
Direction of intraluminal bolus movement as detected by multichannel intraluminal impedance.
Full size figure and legend (38K)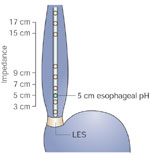
Figure 8
Combined multichannel intraluminal impedance and pH catheter.
Full size figure and legend (34K)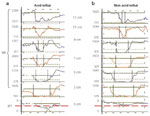
Figure 9
Gastroesophageal reflux detected by combined multichannel intraluminal impedance and pH (MII-pH) monitoring.
Full size figure and legend (131K)
Figure 10
Suggested diagnostic gastroesophageal reflux disease (GERD) algorithm.
Full size figure and legend (31K)