
Abstract
An investigation into fine-scale European population structure was carried out using high-density genetic variation on nearly 6000 individuals originating from across Europe. The individuals were collected as control samples and were genotyped with more than 300 000 SNPs in genome-wide association studies using the Illumina Infinium platform. A major East–West gradient from Russian (Moscow) samples to Spanish samples was identified as the first principal component (PC) of the genetic diversity. The second PC identified a North–South gradient from Norway and Sweden to Romania and Spain. Variation of frequencies at markers in three separate genomic regions, surrounding LCT, HLA and HERC2, were strongly associated with this gradient. The next 18 PCs also accounted for a significant proportion of genetic diversity observed in the sample. We present a method to predict the ethnic origin of samples by comparing the sample genotypes with those from a reference set of samples of known origin. These predictions can be performed using just summary information on the known samples, and individual genotype data are not required. We discuss issues raised by these data and analyses for association studies including the matching of case-only cohorts to appropriate pre-collected control samples for genome-wide association studies.
Introduction
The genetic structure of populations is very important both from the population genetics viewpoint of understanding past and current relationships between populations, and from the genetic epidemiological viewpoint of avoiding spurious associations between diseases and genetic markers caused by differences in the population structure of cases and controls in association studies.1, 2, 3 This study was undertaken to address both of these aspects, to describe the relationships between approximately 6000 European control samples from 13 different populations ranging geographically from Spain to Russia using data on 300k SNPs, and to provide guidelines for the use of these and other pre-collected European control samples in genome-wide association studies when only cases have been collected.
There are several recent studies that address similar questions about the relationships between European populations.4, 5, 6, 7 This study can be distinguished from these earlier studies in part by the type and quantity of the data used for the analysis. All samples studied were typed on the same set of >300 000 SNPs. Most of the population studies had >100 samples (the minimum having 76 samples), with the median number of samples per population being 374 and the maximum being >1300. All samples were from current European residents, which could be expected to give clearer results than using individuals of European descent who are more likely to show the evidence of recent admixture. In addition, the large number of different populations spread geographically over a large part of Europe allows more information to be obtained about genetic differences across the continent than if only a small number of very different populations were sampled.
The most common methods used by these studies on human population structure are clustering approaches8, 9 or principal component analysis (PCA).10, 11 The clustering approaches work on the basis of the presence of distinct genetic groups, and the probability of group membership of samples or, at a finer level, of chromosome blocks, can be estimated. These approaches and, in particular, the Bayesian clustering methods8 have been widely used in population genetic studies because of the detailed information they provide on group membership and individual admixture. However, these approaches tend to be computationally intensive, and are in practice not suited to the large numbers of markers present in genome-wide data sets. A second problem with the cluster-based methods is that they work best when the study population is a mixture of distinct populations that is, European, African and Asian, and are less well suited to the situation where sample populations are overlapping. New implementations are making the computational aspect less of a problem;12 however, the difficulty with overlapping populations makes these approaches inappropriate for this study where the aim is to describe the relationships between a set of closely related populations within Europe. The PCA approach was therefore mainly used for this study, as it is possible to apply the technique to large data sets with many thousands of individuals and hundreds of thousands of markers, and with overlapping populations.
Materials and methods
The study was performed using control samples collected and genotyped for association or population studies; no genotyping was performed specifically for this study. For all studies, permission to use the samples was obtained from the original investigators. All samples were genotyped on the Illumina HumanHap 300 arrays or on its derivatives.
A total of 5847 individuals from across Europe, all genotyped on >300 000 SNPs, were used for the study. The samples came from 13 different countries, with sample origin being taken as the geographic location where the sample was collected, and consisted of eight sample sets. In addition to these samples, the 210 unrelated HapMap13 population samples: 60 CEPH samples (parents), Utah residents with ancestry from northern and western Europe (CEU), 60 Yoruba samples (parents) from Ibadan, Nigeria (YRI), 45 Han-Chinese samples from Beijing, China (CHB) and 45 Japanese samples from Tokyo, Japan (JPT), were included in the analyses. The first sample set contained 2016 control individuals from six different eastern European populations collected for a GWA (Genome-Wide Association) study on lung cancer;14 620 from Poland, 560 from Russia, 374 from the Czech Republic, 209 from Hungary, 145 from Slovakia and 108 from Romania. The next set contained 1228 population samples from France. The third set had 1385 samples from the UK 1958 Birth Cohort from the Wellcome Trust Case Control Consortium.15, 16 The fourth set had 506 German and 52 UK control samples from a GWA study on Asthma.17 The fifth set had 234 Belgian control samples from the GWA on Crohn's disease.18 The sixth set had 95 Swedish population samples from the Uppsala Family Study.19 The seventh set had 108 Norwegian control samples. The final set had 147 additional German population samples20 and 76 Spanish control samples.
All samples were passed through the standard QC procedures followed at the Centre National de Genotypage for GWA studies. Samples with genotyping success rates <95% were removed, as were male samples with >0.5% or female samples with <20% heterozygous markers on the X chromosome. A check for closely related individuals was carried out within each study population by calculating average IBS (identity by state) scores for all pairs of individuals. Each marker that was successfully typed for the two individuals was scored as 0, 1 or 2 depending on the number of alleles in common between the samples. The mean and standard deviation of this score for all autosomal markers were calculated for each pair, and a scatter plot produced of the mean against the standard deviation. Outlying points owing to related pairs were identified and the relevant individuals were excluded. Apart from the family-based studies (the Spanish cohort and the small UK cohort (52 samples)), only a small percentage of individuals (0–1%) had to be removed from each cohort because of close relatedness. In addition to identifying related pairs, the IBS analysis can also detect individuals who are ‘less’ related to the rest of the population than would be expected if the samples were homogenous. This is because of the individuals in question having either a different ethnic background or a problem in the quality of their genotypes. Such individuals were also excluded from further analyses. The sample numbers reported above are the final numbers used for the analyses after all QC steps were completed.
All samples used in the study were unrelated; in the case that the original data contained related individuals, an unrelated subset was selected using the IBS analysis to identify unrelated pairs. For the Spanish samples, which consisted of extended families, a graph was constructed with samples as nodes and edges joining unrelated samples (as estimated from the IBS analysis). A maximal unrelated set of individuals was then found as the maximal clique from this graph, a problem for which efficient approximation algorithms exist.21
Five marker panels were used for the statistical analyses. Panel 1 contained 129 673 autosomal SNPs selected from the Illumina HumanHap 300 panel to have a very high genotyping success rates (≥98%) and high informativity (minor allele frequency (MAF)≥0.05). In addition, SNPs in linkage disequilibrium (LD) (r2≥0.1) with other SNPs on the panel were removed. To investigate the effect of the marker allele frequency spectrum on the analyses, a panel of low-frequency SNPs (panel 2) and common SNPs (panel 3) were selected as having success rates ≥95% and with the low-frequency SNP panel having 0<MAF<0.05, and the common SNP panel having MAF>0.485. The cutoff for the common SNP panel was selected to give a similar number of markers in both panels (8412 low-frequency SNPs and 8734 common SNPs). Panel 4 was constructed by selecting markers that were significantly correlated with the population membership to produce an estimate of a minimal marker panel to distinguish the different European populations; this panel contained 391 SNPs. The final panel, panel 5, contained 48 587 SNPs and was constructed from the intersection between the autosomal markers from the Affymetrix Mapping 500k and Illumina HumanHap 300 panels, selected to have success rates ≥95% and MAF≥0.01.
Detecting population differences
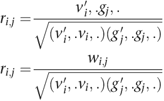
The relationship between the different populations was initially investigated by calculating the Fst statistic for each pair of populations using the markers in panel 1. The population structure was then investigated in more detail using PCA on the individual samples. Following Patterson et al,10 a scaled genotype matrix G was generated with rows indexed by individuals and columns by polymorphic (autosomal) SNPs; hence, G is of size n × m where m is the number of SNPs and n is the number of individuals. Each element gi,j contains the normalized genotype for individual i at marker j, and is calculated from the frequency of variant alleles (0, 0.5 or 1) xi,j for an individual genotype by subtracting the variant allele frequency pj and dividing by the standard deviation. In the case of missing genotype data, the corresponding element was set to zero that is, to the population mean for the marker.
The matrix A of size n × n was then constructed as:

and the eigenvalues and eigenvectors (principal components (PCs)) of A calculated. A has a maximum of n−1 non-zero eigenvalues, but we considered only the k largest eigenvalues and associated vectors. Both PCA and Fst statistics were calculated using the EIGENSTRAT10, 22 software package.
Identification of SNPs or genomic regions that were correlated with a given PCs used the SNP weights, which were calculated as follows: let L be a diagonal k × k matrix where diagonal element Li is the ith largest eigenvalue, and V be the n × k matrix containing the k PCs associated with the eigenvalues in L. Let W be the k × m matrix of SNP weights for each component:

Rather than directly using the SNP weights in W, the correlations ri,j for PCs i and SNP j between the genotype vectors and individual component weights were calculated as follows: let vi be the ith column of V and, therefore, the vector of component weights for PCs i, and gj the jth column of G and, therefore, the vector of normalized genotypes for SNP j. The correlation ri,j was then calculated as:
The significance of the correlations was assessed by calculating the test statistic (n−1)ri,j2, which has a χ12 distribution under the null hypothesis of no correlation. Note that this is equivalent (up to a factor of (n−1)/n) to the commonly used score test for the association of a quantitative trait with the PCs as the outcome variable. The EIGENSTRAT package was used to calculate the SNP weights for each eigenvector.
It is interesting to consider the minimum number of markers required to reproduce the most important set of components (ie, those corresponding to the largest eigenvalues and, therefore, explaining most of the variance). For a given component, the correlations between the SNPs and the component can be used to select a small set of SNPs that can accurately predict the component weights.
A simple step-up strategy was used, adding markers to the model one at a time and selecting at each step the marker with the highest residual correlation that was not already in the model, until no markers with test statistics over the genome-wide significance level remained. To model multiple components (ie, the k largest), this procedure was carried out sequentially, starting with the largest component. This strategy was intended to obtain a small (although not necessarily minimal) set of markers that can recover the largest features detected by the PCA using marker panel 1. This method was used to select a set of 391 markers (panel 4) that were significantly correlated with the first two components from the PCA (using panel 1) of the European populations.
An investigation into possible differences in the LD patterns between populations was then carried out by estimating the extent of LD as measured by r2 as a function of physical distance in the different populations. Using the markers in panel 1, estimates of r2 for all pairs of markers closer than 10 Mb apart were obtained from the maximum likelihood (ML) estimates of the pairwise haplotype frequencies. For computational efficiency, only observations where both markers were typed were used, which allows a closed form solution for the ML estimates. Pairs of markers were grouped into bins of width 1 kb on the basis of the distance between them, and an average r2 was calculated for each bin.
Predicting sample origin
Methods such as PCA or Bayesian clustering approaches,8, 9 which can be used to show the population substructure, can also be used to predict the genetic origin of unknown samples given their data. For example, if the PCA on a set of samples of known origin showed a separation between the samples from different origins, then it is possible to take samples of unknown origin and find the population with which they have the closest resemblance.
This can be carried out by performing a PCA on all samples, both of known and unknown origin. Using the known samples only, country-specific mean and variances for each PC showing a separation between the countries are calculated, and, using these, the relative probability of a new sample being in each of the possible candidate populations is calculated for each component used in the model assuming independent normal distributions for the weights from each component. These relative probabilities for each population are then multiplied across components to give the final probability distribution.
To show this method, the country of origin of 20% of the sample was ignored to form a test group and the remaining 80% of the sample was used to estimate the country-specific means and variances for the four most significant PCs. The probability of membership to each target population for each member of the test group was then calculated on the basis of this model.
The same analysis was also performed using the Bayesian clustering program STRUCTURE,8 in which 80% of the model was marked as having a known origin and 20% was of unknown origin, and hence the origin had to be predicted. STRUCTURE is a Markov chain Monte Carlo (MCMC) sampling-based approach, and is computationally more intensive than the PCA approaches when used with large numbers of markers. It was not possible to run the analysis using the full set of markers, and instead both the PCA-based approach and STRUCTURE were run using the ‘minimal’ set of 391 markers, selected for their ability to predict the first two PCs in the European analysis. The STRUCTURE analysis was run for 100 000 iterations with 10 000 iterations of burn-in, and visual inspection of the likelihood at each sampling iteration indicated that convergence was reached after ∼20 000 iterations. The output from the STRUCTURE analysis is an estimated posterior probability distribution across the possible populations for each unknown sample, which can be compared with the probabilities obtained from the PCA approach.
One drawback of both approaches described above to predict sample origins is that if a sample comes from a country that is not represented in the original data set, it will still be classified as being a member of one of the original countries. To avoid this, some means of evaluating model fit must be used to identify samples that do not come from any of the proposed possibilities. A simple approach is to calculate a distance measure di for individual i from a sample to the center of the population to which they have been assigned:
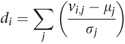
where vi,j is the component weight for individual i at component j, and μj and σj are the mean and standard deviation of component j for the population assigned to individual i.
Although this classification procedure is very useful, there is a drawback in that it is necessary to perform the PCA using both the known and unknown samples, which is computationally intensive, as it will require that the PCA be re-run each time new samples need to be processed. In addition, this requires access to the individual genotype data for the known samples, which may not always be available. However, given the SNP weight matrix W, the eigenvalues and the allele frequencies from the original population used for the PCA, we can calculate a normalized genotype matrix H for the new samples, using the allele frequencies from the original population to perform the normalization. Given W, L (the diagonal matrix with the eigenvalues on the diagonal) and the original genotype matrix G, the eigenvector matrix V for the original samples can be calculated as follows.
From the properties of eigen decompositions, we can write

Given that A=(1/n) GG′, we can substitute for A to give:
The matrix of SNP weights, W, was defined as W=V′G, so we can re-write this as:
The transpose of V can then be obtained from:
This is not interesting in itself, as we already needed V to calculate the SNP weights W. However, if we replace G by H, the normalized genotype matrix for the new samples, then it is possible to calculate Q, a vector of ‘pseudo-eigenvectors’ for the new samples:

The assumption here is that if we had performed the joint PCA with the new and old samples together, the significant components (and the SNP weights associated with them) would be close to those calculated in the original PCA with only the old samples.
To test this, the above procedure was carried out for the 210 HapMap samples from all four populations, estimating the eigenvectors for the HapMap samples based on the SNP weights and eigenvalues calculated from the European control samples. All European control samples were then used as the training set for the population classification of the HapMap samples.
Results
Table 1 shows the Fst statistic calculated using marker panel 1 for all population pairs using the 5847 European samples along with the 210 HapMap samples. Not unexpectedly, the differences between the African, Asian and European populations are much greater than the differences seen within Europe. However, substructure within Europe is clearly indicated by Table 1. Note that although the values of Fst between the European populations are small (from 0.006 between Spanish and Russian samples down to 0.00008 between Czech and Slovak samples), the standard errors of the estimates are such that these are all significantly different from zero with P<0.05.
A PCA was performed on the same set of samples and on the same marker panel. The first 110 PCs were significant at the 5% level as evaluated using the Tracy–Widom test on the eigenvalues.10 However, the first few components stand out from the others, with the graph of percentage of variance contributed per component flattening out after the first four (Figure 1).

The percentage variance contributed by the first 25 PCs from the PCA of the European and HapMap populations combined and from the European populations alone.
Scatter plots of the first two components (Figure 2a) show that these components explain the main differences between the Asian, European and African samples. Focusing just on the European samples (Figure 2b) shows some within-European structure, with Russian, UK and Spanish samples marking the ‘east’, ‘north-west’ and ‘south-west’ extremes of the European cluster. There is, however, no clear separation of the individual countries on this plot.

The scatter plot of the first two PCs from the PCA of the European and HapMap populations combined showing (a) all samples and (b) European samples only.
Repeating the PCA analysis omitting the African and Asian HapMap samples, it is possible to get a clearer view of the within Europe variation. With the European samples only, the number of significant PCs stayed at almost the same level (107 vs 110), with the first two PCs contributing 6.0 and 2.3%, respectively, of the variance because of the significant PCs (0.21 and 0.08% of the variance because of all components) (Figure 1). The scatter plot of the first two components (Figure 3) show a clear East–West and North–South gradient respectively, with a striking correlation between the geographic position of the countries and the position of the samples from each country on the PCA plot. Interestingly, the first two components of the European-only PCA are almost identical to components 3 and 4 from the PCA, including all four HapMap cohorts (the absolute value of the correlations between the relevant components from the two analyses are both 0.999, data not shown).

The scatter plot of the first two PCs from the PCA of the European populations only.
From the PCA with all samples, the first two components contribute >32% of the variance because of the 110 significant components. We can therefore estimate that roughly a third of the genetic variance in the samples is because of differences between the Asian, African and European samples, despite the much larger numbers of European samples when compared with Africa and Asia. It is important, however, not to regard the variation within Europe as insignificant as Figure 3 shows that there is a considerable European substructure.
The correlations between the SNPs and the largest components showed that large numbers of markers on all chromosomes were significantly correlated with the components. There were, however, some genomic regions that stood out. The SNP with the highest χ2 for the first PC (showing an East–West gradient) was in the region of lactase (LCT), although there was a broad support for this component on all chromosomes (Figure 4a). The second PC (with the North–South gradient), however, had three genomic regions that stood out as being highly correlated to the PC (Figure 5b): LCT, HLA and HERC2 (which is associated with iris color,23, 24, 25). Although the SNP test statistics indicate genomic regions that are more important than others in producing the gradients seen in Figure 3, it should be noted that there are >24 000 SNPs scattered throughout the genome that achieve genome-wide significance level for correlation with the first two components (χ2≥26 for a genome-wide error rate of 0.05 after Bonferroni correction for multiple tests), with >20 000 of these being for component 1. Indeed, the three genomic regions discussed above are not necessary to produce the pattern in Figure 3. To show this, the above PCA analysis was repeated after removing all markers from panel 1 within 10 Mb of each of LCT, HLA and HERC2, and the correlations between the first two PCs from the full marker panel analysis and the corresponding PCs from the reduced marker panel analysis were both ≥0.995 (Table 3). The scatter plot of the first two PCs from the reduced marker panel analysis was almost identical to Figure 3 (data not shown), as would be expected given the high correlations between the PC weights. This is not surprising as even after removing the markers within 10 Mb of the obvious peaks in Figure 4, the number of markers that achieve global significance only dropped by ∼800.

Graph showing the association along the genome with the first and second PCs (panels a and b, respectively).

The scatter plots of the first two PCs from the PCA of the European populations using (a) the low frquency marker panel, (b) the common marker panel and (c) the minimal 391 marker panel.
A recent study using PCA on GWA data in European samples5 observed a PC that appeared to be largely because of an inversion at around location 9 Mb on chromosome 8p. This region has been identified earlier26, 27 as containing an inversion, and has LD extending over a 4 Mb region around the inversion in the samples used for this study. The effects of this inversion were less apparent in this study because of the exclusion of markers in strong LD from the marker panel; before this filtering being applied the same observation was made of three clusters in a PC (fifth PC from an analysis with European samples only) strongly linked to chromosome 8p (data not shown). It should be noted that the division of samples into the three clusters was independent of population origin, indicating that the frequency of the inversion does not vary greatly between the European populations in this study.
A large case–control study15 on UK samples identified markers in 12 autosomal regions showing large allele frequency differences between individuals from 12 different UK regions. Of these 12 genomic regions, seven contain SNPs that were significantly associated with PCs 1 or 2 in this study, and a further four regions show SNPs that were just under the threshold for global significance (Table 2). This study therefore detected 11 out of 12 of the genomic regions identified as correlating with geographic regions within the United Kingdom as involved in East–West and North–South gradients covering all of Europe. In addition, this study finds many more regions correlated with these gradients. It is likely that the larger geographical spread of the samples used in this study gives increased power to detect such regions compared with earlier studies.
The PCA on the European samples only was repeated using the low-frequency and common SNP panels (panels 2 and 3) to investigate the effect of the marker allele frequency spectrum on the detected population structure. The plots of the first two PCs from the PCA using these two panels can be seen in Figures 5a and b. It can be seen that although the separation of the countries is less clear than with the full panel, both the low-frequency SNP and common SNP panels give the same overall picture with the first two components corresponding to an East–West and North–South geographic axis. The correlations between the larger PCs from the different marker panels range from 0.8 to 0.95 (Table 3), and again indicate that, at least for the first two components, the smaller panels are capturing much of the information. This does not, however, extend to the smaller components; the PCA with the low-frequency and high-frequency panels had only six and two significant PCs, respectively, compared with 107 with the full marker panel.
The PCA using the European samples was repeated using panel 4, with just 391 markers selected to predict just the first two PCs from the original European PCA. The scatter plot of the first two components (Figure 5c) shows that the general features of the two gradients in Figure 4 are recovered, but with a significant loss of resolution. The absolute value of the correlations between the first two components from the full panel and the ‘minimal’ panel were 0.95 and 0.80.
The final PCA was performed on the same set of European samples using marker panel 5, which had 48 587 SNPs that were in common between the Infinium Hapmap300k panel and the Affymetrix 500k panel. The correlations between the first PCs and second PCs from the two analyses were 0.99 and 0.98, and the scatter plots of the first two PCs were visually almost identical to Figure 3 (not shown), showing that a panel selected from the intersection between the two common genotyping platforms for Illumina and Affymetrix can detect most of the detail detected using all markers in panel 1.
Although the genetic variation within Europe is less than the variation between samples from different continents (Table 1), the variation within individual countries is still great enough to potentially give false-positive results in association studies if not taken into account. For example, there were 252 samples from Dresden and 222 samples from Munich among the samples analyzed that were plotted together as German samples. Figure 6 shows the plots of the first two PCs showing the distribution of the samples from these two cities. A case–control study drawing cases from Dresden and controls from Munich is at risk of false-positive results because of the differences between samples from the two cities. Considering the Dresden and Munich samples as cases and controls, respectively, the median single marker χ2 statistic is 0.493 compared with an expected 0.456; hence the Genomic control lambda parameter28, 29 is 1.08 indicating an inflation that would need to be accounted for in an association study. This indicates that even if both cases and controls are collected from within a single country, it might be necessary to make corrections for population stratification. This effect would be much stronger if samples were collected from different countries, even if all samples were correctly classified as being European/Caucasian.

The scatter plot of the first two PCs of the European populations highlighting the samples from Dresden and Munich.
The extent of LD as a function of distance in the sample populations was investigated using the r2 measure in different populations. It is known that there is a bias in the estimation of LD with low sample sizes;30, 31 small sample sizes lead to an overestimation of r2 when LD is low. This bias can be seen in Figure 7a, which shows the decay curves estimated from subsets of 25, 50, 100, 500 and 1000 samples selected from the French cohort. The smaller sample sizes show a slower decay, which is because of an overestimation of r2 when LD is low with small sample sizes. The curves for 500 and 1000 samples are very close, showing that this effect is small for larger samples. To avoid the sample size effect from influencing the population comparison, only the five largest populations (UK, France, Germany, Poland and Russia) were examined in detail for LD, with a random subset of 500 samples being taken from each population to equalize the sample sizes. The estimated decay curves show little difference between the five populations (Figure 7c and d), and the empirical 95% distributions of the LD estimates are large such that the differences are not significant (data not shown). More variance was seen between different chromosomes than between the different populations; for example, chromosome 22 shows a faster decay in LD with distance than most of the other chromosomes. This is shown in Figure 7b for the French population, but the same holds true for the other populations.

Graphs showing the decay in LD as a function of genomic distance for (a) differently sized subsets of the French cohort, (b) chromosomes 6 and 22 from the French cohort, (c) and (d) random subsets of size 500 from the five largest cohorts.
Predicting sample origin
The method to predict the origin of unknown samples using the PCA was tested with the European samples by using 80% of the samples selected at random to generate a model for the populations, and using this to predict the relative probabilities of population membership for the remaining 20% of the samples.
A summary of this analysis is presented in Table 4, which shows the relative probabilities of samples being in a given target population, averaged over all test samples originating from each population. In all cases (averaged over samples with the same origin), the target population with the highest posterior probability is that corresponding to the origin of the sample, with neighboring countries typically having the next highest probabilities. For example, for test samples from UK, the posterior probability of a UK origin was 0.95 with the next highest scoring target populations being Belgian, German and French; the probability for Slovak samples being Slovak was 0.45, whereas the probability of the Slovak samples being either Czech or Hungarian was 0.47.
Table 4 also shows the median and empirical 95% CI of the distance measure for test samples from each origin population. The distance measure is a measure of the distance in standard deviations from a sample to the center of the closest matching population. The median distance measure for all groups is low, as is to be expected since an appropriate target population is available for each test sample. This will not always be the case, and it can arise that a test sample may come from a population not represented in the training set. To test the behavior of the method in this case, a second analysis was performed taking each population in turn, removing the samples belonging to the test population from the training set, generating the model for the remaining populations, and then estimating the probabilities of population membership from the resulting model. The results for this analysis are shown in Table 5. The European samples all show the highest posterior probabilities for populations geographically close to the ‘true’ origin, with the median distance measure still being low (although higher than shown in Table 4). This indicates that the method works even when there is not an exact population match present in the training set.
Having to re-run the PCA with both old and new samples together has the disadvantages of being computationally intensive, especially if the training set is large, and requires that the individual genotypes of all individuals in the training set are available, which may not always be the case. Using the approach outlined here to estimate the component weights for new samples, the origins of the HapMap samples were estimated using the European samples as the training set. The results of this analysis are also given in Table 5. The HapMap CEU samples have, on average, a probability of 0.72 of being from the United Kingdom, with Germany and Belgium and, to a lesser extent, Norway and Sweden, accounting for the remaining cases. None of the HapMap CEU samples appeared to have a non-European origin. For the other HapMap populations, the classification procedure assigned 100% of the YRI samples to France, and almost 100% of the CHB and JPT samples to Russia. However, the distribution of the distance measure for the four populations was quite different. For the CEU samples, the median and 95% CI of the distance measure were 0.41 (0.11–1.01), whereas for the YRI, CHB and JPT populations, the median and 95% CIs were 19.3 (18.0–20.6), 17.7 (15.9–19.3) and 18.0 (15.4–19.6), respectively. Therefore, although attempting to classify the origin of a sample that comes from a population not contained in the original PCA can give a false classification, the distance measure makes it clear that the sample is far from the other known members of that population.
To compare the PCA-based method with existing Bayesian clustering methods, a similar analysis to that above was performed using the program STRUCTURE.8 To avoid the computational difficulties of running STRUCTURE with marker panel 1, both the PCA-based method and STRUCTURE were run using the 391 marker panel (panel 4). The results of these analyses are presented in Table 6. It can be seen that while the PCA method with panel 4 did not perform as well as the full panel, over all test samples the true country of origin always had the highest posterior probability, and the posterior was concentrated in the true country of origin and close neighbors. For example, the average probability that UK test samples were classified as being from the United Kingdom was 55% rather than 92% with the full panel. However, the smaller panel assigned a high probability to a larger region around the true country of origin. For example, the probability of the UK samples being French, Belgian, UK or Norwegian was >93%.
STRUCTURE also correctly identified the true region for the unknown samples (Table 6). However, it performed less well than the PCA approach in that the probability distribution for all populations was more diffuse, with a lower probability assigned to the true country of origin. Taking the same example as for the PCA approach, the probability of UK samples being assigned to the United Kingdom was just 24%, and their probability of being either French, Belgian, UK or Norwegian was 61%.
For a final example, we return to the German samples that were discussed earlier. These samples were a part of an Asthma GWA study17 and in addition to the control samples used in this study, there were also 676 German cases. The above procedure was used to generate the component weights for the case samples without running the PCA with the case samples included, allowing the case samples to be added to the plot in Figure 6. The sample classification was also performed; this predicted that 60% of the case samples were German with the others coming from other central or western countries, which is close to the figure for the German controls in Table 4. The plot of the first two components for the control samples and the case samples is shown in Figure 8, and confirms the classification results.

The scatter plot of the first two PCs of the European populations including the (German) Asthma cases using their estimated component weights.
Discussion
For case–control studies to be effective, it is important in general that the cases and controls are matched as far as possible with respect to their genetic backgrounds. A striking feature of the samples used for this study is how well the geographic origin of the samples appears to correlate with the genetic origin, so that separating the samples by country of origin or on the basis of genetic measures gives similar results. The only major deviation from this pattern is with the Romanian samples that appear to be closer to the Spanish samples (further ‘west’) than their geographic position would indicate. This could be because of the historical close ties between Romania and Italy, but further studies would be required to confirm this. The relatively compact form of most of the individual country clusters in Figure 3 and the overall compact nature of the pan-European cluster in Figure 2 show the high quality of the geographic origin information in its ability to predict genetic relatedness. This is not always the case, and in situations where sample origin information is unreliable or missing, the ability to use the genetic information to match cases and controls would be very valuable.
The fine population structure within Europe, which can be detected using PCA techniques (Figure 3), is notable for the close correspondence with the geographical location of the sample origins. The two largest PCs from the European-only analysis are closely correlated with an East–West and a North–South geographic gradient, respectively. The presence of a North–South gradient with which LCT is associated has been reported in several European studies using whole genome data, and a strong East–West gradient has also been reported in earlier studies.7, 11 Although it is interesting that the regions most highly associated with the North–South gradient are LCT, HLA and HERC2, it must be noted that these are just extreme examples of regions being associated with the gradient, and removing these regions had no discernible effect on the plot of the first two PCs.
It should be noted that explaining the observed gradients in terms of human population history is problematic. What is clear from the results is that there is a strong correlation between genetic and physical proximity, but there are several possible reasons why this should be the case.32 Making inferences about population history from the data presented here is also difficult as there has been an ascertainment bias in the selection of SNPs, notably toward common SNPs, which can bias any conclusions drawn from the data.33 However, the main conclusion of this study – that there is a strong correlation between genetic and physical proximity that can be used to ‘map’ unknown samples – is not dependent on the frequency spectrum of allele frequencies as shown by our tests with the low allele frequency and high allele frequency marker panels.
In order that the approaches described here for identifying sample origins or matching controls to cases be useful, it would be necessary that both the reference set of samples and the test set are genotyped for the set of markers used for the original PCA. We have shown that the two gradients are detected with much smaller number markers (391 instead of 129 673 used for the original analysis). However, reducing the number of SNPs does reduce the resolution to detect population structure, and many fewer significant components are found. In addition, the panel with 391 markers did not perform as well at predicting sample origin (Table 6); the reason for which is clear when the increased overlap between countries is seen in Figure 5.
The PCA-based approach, however, appeared to work better than the Bayesian clustering approach implemented in STRUCTURE when applied to the same panel of 391 markers (Table 6). In addition, the STRUCTURE analysis with panel 4 (391 markers) required 3 days of computing time (3 GHz Athlon processor) as opposed to several hours for the PCA approach, and this drops to minutes if the method for approximating the component weights for new samples is used. This makes the PCA approach more practical as a routine part of QC or statistical analysis workflows.
A point to note is that the panel made exclusively of markers with MAF<=0.05 performed slightly worse than an equivalently sized panel of exclusively very common markers (MAF≥0.485), measured by the correlation between the first two components of the reduced marker sets and those from the full marker set, but the PCA with the low-frequency marker panel detected more significant components (6 vs 2 for the common marker panel).
Although the question of the minimum number of markers required to detect the first n components is an interesting one,6, 34 we are more concerned with samples genotyped for GWA studies, and these are typically typed, at least initially, on one of the standard panels such as the Illumina HumanHap 300 or Affymetrix Mapping 500k marker sets. The PCA that we performed with a marker set formed from the intersection between the Illumina HumanHap 300 and Affymetrix Mapping 500k panels is therefore particularly interesting as it shows that a common panel is almost equally good at detecting the first few components as the full 129 673 SNP panel; therefore, at least for purposes of identifying sample origins, samples typed on either platform can be included in the same analyses.
The results of this study are encouraging for the use of shared control samples in European case–control studies. With or without the origin of the samples, it is possible to locate a set of case samples on a genetic origin map such as Figure 3 on the basis of their genotypes, and use this information to select a suitable set of control samples for the study. Any residual discrepancies between the cases and controls owing to imperfect matching can be corrected for by performing a PCA on the cases and selected control samples and correcting for the diversity detected through the PCs.22
The example given of the asthma cases illustrates how this approach could be used in practice. If the cases were of unknown origin, Figure 8 or the classification approach allows a quick identification of suitable control samples. Even if the sample origins were known, in this case it would have been possible to use additional controls from other populations such as the United Kingdom, French or Belgian to augment the power of the study and, potentially, reduce false positives by better matching of controls to the cases. For example, the original German samples for the Asthma study (673 controls and 676 cases) were used to replicate an association signal on chromosome 17.17 The top SNP from the initial analysis on chromosome 17 was rs7216389, and a χ2-test of association for this marker with the German Asthma data set gives an uncorrected P-value of 1.9E−7, which improves to 3.1E−9 if an adjustment is made for population structure by regressing on the significant PCs.22 The analysis of sample origins indicates that Belgium and Czech samples are the closest match to the German samples. Performing the analysis using the Belgium and Czech samples as addition controls improves the corrected and uncorrected P-values to 1.3E−8 and 3.1E−10, respectively. Note that the correction for population structure reduces the GC lambda value from 1.1 to 1.0 in the original analysis and from 1.14 to 1.0 in the analysis with the Belgium and Czech samples. Although in this case sufficient control samples were available from the original study, it can be seen how using the methods described in this paper to identify suitable pre-genotyped controls could significantly increase the power for association studies.
In this study, we described how new genotyped samples can be located on a pre-existing plot of PCs without requiring to perform the PCA for all samples together, and without needing the individual genotypes of the original data set. This approach has obvious practical advantages over performing a new PCA, but there are potential pitfalls. The main pitfall is applying this technique to a new set of samples that are sufficiently distinct from the training set such that the original PCA is no longer a close approximation to the joint PCA of the old and new samples together. The extreme example discussed in this study was to try and classify non-European HapMap samples using the European samples for the PCA and as a training set for the classification model. The Yoruban and Asian samples were identified as belonging to the countries on the south and east edges, respectively, of the European cluster, and the distance measure clearly indicates that they do not fit well into any of the proposed populations. It cannot be assumed that outliers will always be easily detectable in this way. This drawback could be avoided by adding as much diversity as possible into the initial training set. Using the European samples in addition to all four HapMap populations as a training set does not have an adverse effect in this data set on the ability to distinguish between different European populations, but does allow correct identification of the HapMap African and Asian samples (data not shown). A generally useful resource for localizing and matching samples should, therefore, contain a wide range of genetically different samples so that most new samples can be quickly and successfully mapped.
In conclusion, we have shown that using PCA techniques it is possible to detect fine-level genetic variation in European samples. The genetic and geographic distances between samples are highly correlated, resulting in a striking concordance between the scatter plot of the first two components from a PCA of European samples and a geographic map of sample origins. We have shown how this information can be used to predict the origin of unknown samples in a rapid, precise and robust manner, and that this prediction can be performed without requiring access to the individual genotype data on the original samples of known origin.
The marker panels used in this study, and the summary information on the control samples required to perform the classification of new samples can be obtained on application to the corresponding author.
References
Clayton D, Walker N, Smyth D et al: Population structure, differential bias and genomic control in a large-scale, case-control association study. Nat Genet 2005; 37: 1243–1246.
Freedman M, Reich D, Penney K et al: Assessing the impact of population stratification on genetic association studies. Nat Genet 2004; 36: 388–393.
Marchini J, Cardon L, Phillips M, Donnelly P : The effects of human population structure on large genetic association studies. Nat Genet 2004; 36: 512–517.
Seldin MF, Shigeta R, Villoslada P et al: European population substructure: clustering of northern and southern populations. PLoS Genet 2006; 2: e143.
Tian C, Plenge RM, Ransom M et al: Analysis and application of European genetic substructure using 300 K SNP information. PLoS Genet 2008; 4: e4.
Price AL, Butler J, Patterson N et al: Discerning the ancestry of European Americans in genetic association studies. PLoS Genet 2008; 4: e236.
Bauchet M, McEvoy B, Pearson LN et al: Measuring European population stratification with microarray genotype data. Am J Hum Genet 2007; 80: 948–956.
Pritchard JK, Stephens M, Donnelly P : Inference of population structure using multilocus genotype data. Genetics 2000; 155: 945–959.
Tang H, Coram M, Wang P, Zhu X, Risch N : Reconstructing genetic ancestry blocks in admixed individuals. Am J Hum Genet 2006; 79: 1–12.
Patterson N, Price AL, Reich D : Population structure and eigenanalysis. PLoS Genet 2006; 2: e190.
Menozzi P, Piazza A, Cavalli-Sforza L : Synthetic maps of human gene frequencies in Europeans. Science 1978; 201: 786–792.
Li JZ, Absher DM, Tang H et al: Worldwide human relationships inferred from genome-wide patterns of variation. Science 2008; 319: 1100–1104.
Consortium IH, Frazer KA, Ballinger DG et al: A second generation human haplotype map of over 3.1 million SNPs. Nature 2007; 449: 851–861.
Hung R, Mckay J, Gaborieau V et al: A susceptibility locus for lung cancer maps to nicotinic acetylcholine receptor subunit genes on 15q25. Nature 2008; 452: 633–637.
Consortium WTCC: Genome-wide association study of 14,000 cases of seven common diseases and 3,000 shared controls. Nature 2007; 447: 661–678.
Consortium WTCC, (TASC) A-A-ASC Burton PR, Clayton DG, Cardon LR et al: Association scan of 14,500 nonsynonymous SNPs in four diseases identifies autoimmunity variants. Nat Genet 2007; 39: 1329–1337.
Moffatt MF, Kabesch M, Liang L et al: Genetic variants regulating ORMDL3 expression contribute to the risk of childhood asthma. Nature 2007; 448: 470–473.
Libioulle C, Louis E, Hansoul S et al: Novel Crohn disease locus identified by genome-wide association maps to a gene desert on 5p13.1 and modulates expression of PTGER4. PLoS Genet 2007; 3: e58.
Leon DA, Koupil I, Mann V et al: Fetal, developmental, and parental influences on childhood systolic blood pressure in 600 sib pairs: the Uppsala Family study. Circulation 2005; 112: 3478–3485.
Krawczak M, Nikolaus S, von Eberstein H, Croucher PJ, El Mokhtari NE, Schreiber S : PopGen: population-based recruitment of patients and controls for the analysis of complex genotype-phenotype relationships. Community genet 2006; 9: 55–61.
Bron C, Kerbosch J : Finding all cliques of an undirected graph. Commun ACM 1973; 16: 575–577.
Price AL, Patterson NJ, Plenge RM, Weinblatt ME, Shadick NA, Reich D : Principal components analysis corrects for stratification in genome-wide association studies. Nat Genet 2006; 38: 904–909.
Sturm RA, Duffy DL, Zhao ZZ et al: A single SNP in an evolutionary conserved region within intron 86 of the HERC2 gene determines human blue-brown eye color. Am J Hum Genet 2008; 82: 424–431.
Kayser M, Liu F, Janssens AC et al: Three genome-wide association studies and a linkage analysis identify HERC2 as a human iris color gene. Am J Hum Genet 2008; 82: 411–423.
Eiberg H, Troelsen J, Nielsen M et al: Blue eye color in humans may be caused by a perfectly associated founder mutation in a regulatory element located within the HERC2 gene inhibiting OCA2 expression. Hum Genet 2008; 123: 177–187.
Herva R, de la Chapelle A : A large pericentric inversion of human chromosome 8. Am J Hum Genet 1976; 28: 208–212.
Giglio S, Broman KW, Matsumoto N et al: Olfactory receptor-gene clusters, genomic-inversion polymorphisms, and common chromosome rearrangements. Am J Hum Genet 2001; 68: 874–883.
Devlin B, Roeder K : Genomic control for association studies. Biometrics 1999; 55: 997–1004.
Devlin B, Roeder K, Wasserman L : Genomic control, a new approach to genetic-based association studies. Theor popul biol 2001; 60: 155–166.
Terwilliger JD, Haghighi F, Hiekkalinna TS, Göring HH : A bias-ed assessment of the use of SNPs in human complex traits. Curr Opin Genet Dev 2002; 12: 726–734.
Teare MD, Dunning AM, Durocher F, Rennart G, Easton DF : Sampling distribution of summary linkage disequilibrium measures. Ann Hum Genet 2002; 66: 223–233.
Novembre J, Stephens M : Interpreting principal component analyses of spatial population genetic variation. Nat Genet 2008; 40: 646–649.
Clark AG, Hubisz MJ, Bustamante CD, Williamson SH, Nielsen R : Ascertainment bias in studies of human genome-wide polymorphism. Genome Res 2005; 15: 1496–1502.
Paschou P, Ziv E, Burchard EG et al: PCA-correlated SNPs for structure identification in worldwide human populations. PLoS Genet 2007; 3: 1672–1686.
Acknowledgements
Funding for the genotyping for the eastern European data was provided by INCa, France and the CNG, France. Funding for the genotyping of the German Asthma case and control samples was provided by the GABRIEL European project. The CNG also provided support for genotyping all samples (including those described above) apart from the Wellcome Trust control samples, which were generated by the Wellcome Trust Case-Control Consortium. A full list of the investigators who contributed to the generation of the data is available from www.wtccc.org.uk. Funding for the project was provided by the Wellcome Trust under award 076113. Johanna Sandling is acknowldeged for managing the Uppsala Family Study samples. The longitudinal database of Uppsala Family Study is supported by the Swedish Research Council. The Popgen biobank is supported by the German Ministry of Education and Research (BMBF) through the National Genome Research Network (NGFN). It also received infrastructure support through the DFG excellence cluster ‘Inflammation at Interfaces.’
Author information
Authors and Affiliations
Corresponding author
Rights and permissions
About this article
Cite this article
Heath, S., Gut, I., Brennan, P. et al. Investigation of the fine structure of European populations with applications to disease association studies. Eur J Hum Genet 16, 1413–1429 (2008). https://doi.org/10.1038/ejhg.2008.210
Received:
Revised:
Accepted:
Published:
Issue Date:
DOI: https://doi.org/10.1038/ejhg.2008.210
Keywords
This article is cited by
-
Performance of model-based multifactor dimensionality reduction methods for epistasis detection by controlling population structure
BioData Mining (2021)
-
The genetic history of France
European Journal of Human Genetics (2020)
-
Towards a fine-scale picture of European genetic diversity
European Journal of Human Genetics (2020)
-
Estimating the age of p.(Phe508del) with family studies of geographically distinct European populations and the early spread of cystic fibrosis
European Journal of Human Genetics (2018)
-
Between Lake Baikal and the Baltic Sea: genomic history of the gateway to Europe
BMC Genetics (2017)
