
Abstract
Analyzing the dynamics of parking traffic can better represent the real dynamic states of road networks, thereby allowing for a deeper analysis of the parking system’s impact. This paper comparatively investigates the impact of parking policies on two traffic networks with different infrastructure, socio-economic, and policy characteristics. Parking space, average parking duration, and parking fee policies were analyzed as a function of cruising distances and cruising time with indirect effects on traffic emissions. Empirically, the system dynamics model application is tested and validated with the macroscopic data from two central business districts (CBDs) in Shanghai (Xujiahui area) and Zurich (Bahnhofstrasse area). Results showed Bahnhofstrasse CBD is more sensitive against the policy shifts with relatively higher elasticity and indicated greater responsiveness in aggregating traffic emissions when compared with Xujiahui CBD. The findings of this study may provide an overall framework to empirically assess the performance of different traffic conditions and strategies on urban parking systems.
Introduction
Urban parking has been acknowledged for a considerable period as an essential aspect of urban transportation systems. The effectiveness of parking systems largely impacts the dynamics of traffic flow within a network, as demonstrated by Shoup (1997), who underscored the significance of parking in urban traffic congestion. More importantly, the act of searching for parking spaces significantly aggravates on-road congestion, with approximately 30% of road demand in specific central business districts (CBDs) being due to vehicles seeking for parking (Shoup, 1997). The rapid growth in vehicle ownership contributes to the negative effects of parking systems, as noted by Wen et al. (2019) and Dong et al. (2021). These negative effects include travel delays caused by the time spent cruising for parking, increased costs for drivers, and local environmental impacts due to vehicle emissions (Cao & Menendez, 2015; Cao et al., 2019; Jakob et al., 2020; Jakob, 2021). Issues such as insufficient allocation of parking space, impractical fees, and unrealistic time limits often arise from a lack of understanding about how adjacent systems interact, improper land use plans, or inaccurate assessments of parking demand, which further complicates the situation (Shoup, 1997; Chen et al., 2016; Sun et al., 2016; Shen et al., 2020).
Some analyses have been conducted on the interaction between parking systems and urban transportation from various viewpoints. Assessments at the city level have primarily concentrated on socio-economic aspects, including income and vehicle possession, as well as their association with the need for parking (Shoup, 1997; Jakob, 2021; Ni and Sun, 2017; Zhang et al., 2019). These investigations provide a valuable understanding of the wider consequences of socio-economic patterns on the dynamics of urban parking. On the other hand, at the network level, scholars have explored the operational structure of parking systems. Pioneering research in this area, utilizing empirical-microscopic methods (Axhausen and Polak, 1991; Kladeftiras and Antoniou, 2013; Pierce and Shoup, 2013; Shoup, 2006; Weinberger et al., 2012), have played a crucial role in comprehending the complexities of parking behavior. Traffic assignment models (Boyles et al., 2015; Gallo et al., 2011; Gu et al., 2021; Levy et al., 2013; Qian et al., 2012; Kang et al., 2022) and agent-based simulations (Balac et al., 2017; Benenson et al., 2008; Horni et al., 2013; Marki et al., 2014; Ni and Sun, 2018; Ni et al., 2024; Sun et al., 2016; Waraich and Axhausen, 2012; Zhao et al., 2018) have further enriched this field by offering nuanced perspectives on parking operations.
Furthermore, the economic aspects of parking have been extensively investigated, such as metrics for measuring effectiveness and cost functions, including the studies conducted by Arnott and Rowse (1999), Arnott and Inci (2010), Cavadas and Antunes (2019), as well as Xiao et al. (2019). Nevertheless, these research efforts often assume static speed and time conditions and require detailed data, resulting in discrete outcomes that do not fully capture real-life situations and require significant resources. Consequently, there remains a knowledge gap regarding the dynamic and practical aspects of searching for available parking spaces.
The adoption of aggregate macroscopic fundamental diagrams (MFD) and collective network traffic analysis offers a comprehensive and cost-efficient solution to address this gap. Seminal works by Daganzo and Geroliminis (2008), Gu et al. (2020), Geroliminis and Daganzo (2008), Huang et al. (2021, 2022a, 2022b), Loder et al. (2017), Zhao et al. (2021), and Zhao et al. (2022) have formulated and tested this paradigm shift, demonstrating its potential in effectively representing traffic system dynamics with fewer data needs and analytical complications. Recently, Cao and Menendez (2015) and Cao et al. (2019) introduced a macroscopic model that incorporates MFD with dynamic phases, drawing inspiration from parking equilibrium concepts proposed by Anderson and De Palma (2004), Arnott et al. (1991), and Arnott et al. (1993). The unique aspect of this approach lies in the ability to analyze the interaction between parking and traffic, providing valuable insights for policy implications on both temporal and spatial scales. However, the application of this model in a small network located in downtown Zurich raises concerns about its applicability to other urban settings with different parking and traffic system characteristics. Hence, further studies are necessary to evaluate the universality of this model by testing it in diverse urban contexts.
While there has been significant advancement in comprehending the relationship between urban parking and traffic systems, the field is still developing. The move towards macroscopic models represents noteworthy progress, which however still needs to be confirmed in different urban settings and to connect with practical applications to specific cities. This study conducted a comparative analysis to evaluate the performance of parking systems in two different networks: Xujiahui CBD, Shanghai, and Bahnhofstrasse CBD, Zurich. In contrast to previous research, the dynamic macroscopic evaluation model developed by Cao and Menendez (2015) was comparatively applied to the two particular urban contexts. The unique aspect of the proposed approach lies in the incorporation of more practical inputs into the model, making it more applicable and reliable. The model’s universality and effectiveness have been rigorously tested by extending its validation beyond the original scope.
In addition, this study contributes to the field by quantitatively evaluating the effects of policy changes on environmental factors. This is accomplished through the measurement of the aggregate cruising distance and hot emission factor, resulting in a nuanced comprehension of how policy modifications may impact environmental outcomes within urban areas (Mesfin et al., 2022; Sun and Ding, 2019). By focusing on both performance and environmental consequences, a comprehensive assessment of parking system efficiency was carried out, representing a substantial advancement in the methodology and application of parking system analysis. The findings not only validate the model developed by Cao and Menendez (2015) in new urban contexts but also expand the usefulness for policymakers and urban planners seeking to balance efficiency and environmental concerns in megacity parking management.
The remainder of this paper is organized as follows. Section “Methods” introduces the analytical methods and models that were chosen, while section “Case study” showcases the real-world application of the model through an empirical case study. In the section “Results and comparisons”, the parking and traffic performance indicators from two CBD cases were compared and analyzed, followed by an examination of how the parking systems respond to different policies. Finally, research findings conclusions, and future study directions are provided in section “Conclusions”.
Methods
The dynamic parking model with macroscopic traffic properties is favored due to two features. First, the model explores the traffic system macroscopically, rather than analyzing it microscopically, or using a multi-agent simulation model, which requires little data and relatively simple calculations. Second, the model performs under time-varying conditions, thus capturing the dynamic nature of parking systems (Cao and Menendez, 2015). A conceptual design of the model is presented below, followed by an analytical formulation of the design parameters.
Model definition
In this section, we review and define the basic elements of the system blocks, their dynamic relationships, as well as the necessary input parameters as follows.
The dynamic blocks and the transition matrix: The parking and traffic systems, together with the transition matrix, form the dynamic circle of the model. As shown in Fig. 1, the parking system block is composed of parameters that describe the characteristics of parking. From the traffic system blocks, key properties of traffic flow are derived in accordance with the road system and the nature of vehicle movement. The transition matrix between the two blocks represents the dynamic relationship between the three parking-related states and the five transition events. By analyzing and quantifying the number of vehicles at each parking state and parking-related transition event using the following input parameters, the model estimates the number of vehicles at each parking state and parking-related transition event on each sliced time t:

Illustration for dynamic interactions within urban traffic-parking systems entities.
Basic information about the area: The radius of the network, the total length of the roads, the total length of the network, and the number of parking spaces in the area. Data inputs are based on a dense urban area with a relatively homogeneous network. Traffic and parking conditions change dynamically over multiple time slices over the course of the entire time horizon, which is divided into small time slices (1-min).
Initial conditions and traffic demand: The daily traffic inflows, the initial condition of the parking states, and the percentage of traffic demand associated with parking. As urban networks may be symbolized as one ring road with cars driving in a single direction, it has been found that this method is suitable for small, homogeneous traffic networks (Cao and Menendez, 2015). Travel demand and distance-driven variables can be estimated using historical data, e.g., traffic data entering and exiting the network, and distance variables based on the radius of the network.
Traffic properties of the area: The macroscopic fundamental diagram is used here to illustrate the traffic properties of the area. A network’s MFD is defined by its average free-flow travel speed, critical traffic density, maximum flow, and jam density. Due to the homogeneous nature of the network, parking searchers and parking garages are assumed to be evenly distributed within the driving traffic.
Traveling distance: Includes the length defined as the length required for the vehicle to shift from non-searching to searching state as lns/s, the length needed for the vehicle to leave the area from parking as lp/, and the through vehicle travel length from inlet to outlet as l/. Since the case study primarily involves small CBD areas with standard parking policies, we do not have to pay close attention to individual car locations and parking spaces throughout the dynamic process, i.e., only the average numbers of vehicles and total/average search times and distances are tracked during a time slice.
Parking duration: The distribution of the parking duration histogram (parking duration to frequency graph) and represented by an approximate probability distribution function with the average parking duration. This model utilizes an approximate distribution function based on the parameters of shape and scale to represent a distribution of desired parking durations. There are a variety of possible distributions that can be used, such as Gamma, Poisson, negative binomials, etc. It is assumed that drivers do not cancel their trips while searching for parking. Input parameters specific to parking duration and parking pricing can be approximated based on field measurements.
Analytical formulation for the number of vehicles
Parking-related traffic states
The parking-related traffic states form the basis of the parking-state-based matrix, which is updated as a function of the number of vehicles passing through the various transition events over the course of the time slice. All transition events are modeled using a deterministic approach. Despite this, the model as a whole is not deterministic with respect to parking locations, travel times, and parking durations.
The model is not thoroughly stochastic either, as there are no random values involved in the computation of each transition event. Furthermore, since the model is based on probability functions, it does not require repeated runs to account for its stochasticity. All traffic states and transition parking events are summarized in Table 1. Model input variables are the initial conditions of all traffic state variables, which are either measured, assumed, or simulated.
Based on information regarding the transition events involved in parking-related states, these parking-related states were determined. Equations (1)–(3) update the number of “non-searching”, “searching for parking”, and “parking” vehicles, respectively.
Let (i) represent the time slice of the dynamic model analysis. As presented in Table 1, the number of vehicles at each state and transition event at time slice (i) was defined as follows: parked state, Nip; searching state, Nis; non-searching state, Nins; entering the area, ni/ns; starting to search, nins/s; accessing parking, nis/p; departing parking, nip/ns; and leaving the area, nins/. Thus, the number of vehicles in the parking state at time (i) can be calculated based on the previous state at time (i-1) and the neighboring states at time (i).
Equation (1) continually updates the number of “non-searching” vehicles at (i + 1) as a function of vehicles entering the area (i.e., ni/ns), vehicles that depart parking (i.e., nip/ns), vehicles that are on transition from non-searching to searching (i.e., nins/s), vehicles previously in the non-searching state (i.e., Nins), and vehicles leaving the area (i.e., nins/).
Equation (2) continually updates the number of “searching” vehicles at (i + 1) as a function of vehicles on the transition from non-searching to searching (i.e., nins/s), vehicles that are on the transition from searching to parking (i.e., nis/p), and vehicles previously in the searching state (i.e., Nis).
Equation (3) continually updates the number of “parked” vehicles at (i + 1) as a function of vehicles on the transition from parking to non-searching (i.e., nip/ns), vehicles that are on the transition from searching to parking (i.e., nis/p), and vehicles previously in the parked state (i.e., Nip).
Transition events
Based on the principles of probability and traffic flow theories, the number of vehicles in the transition events has been formulated. Assigning β% to indicate the percentage of vehicles that choose not to use the parking system; whereas (1–β%) are those expected to use the parking system. Figure 2 displays the proportion of vehicles that are engaged in each transition event and parking state.
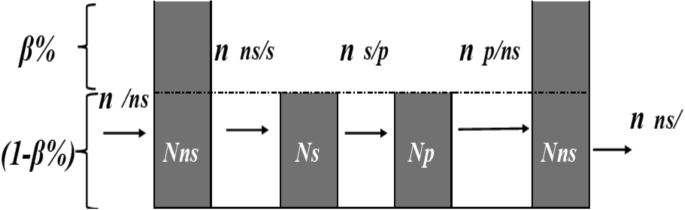
Number of vehicles in each parking state and transition event as well as the proportion of through vehicles and vehicles involved in parking.
Based on the transition events discussed in Table 1 and the dynamic matrix above, a traffic demand or inflow of vehicles to the system ni/ns may be obtained as an input to the model, which can be approximated using a probability distribution or extracted from an agent-based model (e.g., MATSim). In contrast, all the other transition events, nins/s, nis/p, nip/ns, and nins/ are deterministic and relate to average values.
The number of vehicles in transition from non-searching to searching, (n i ns/s)
This can be calculated by considering the total inflow, through-traffic, and the distance required to shift state from non-searching to searching (lns/s):
where,
\({\gamma }_{ns/s}^{i^{\prime} }\): is a binary variable (0 or 1) that indicates whether the vehicle is ready to begin searching at time slice (i). Two conditions must be met for the value to equal 1: the vehicles must have driven at least a distance of lns/s before starting the search, and they must not have previously started the search.
At any given time slice i, the total number of vehicles that start searching for parking may include vehicles that entered the area prior to the time slice, i’є [1, i-1].
The first part of the equation of Eq. (4), \({\sum }_{i^{\prime} =1}^{i-1}(1-{\beta }^{i^{\prime} })\cdot {n}_{/ns}^{i^{\prime} }\) represents the portion of vehicles that need to be parked (i.e., total demand minus through traffic (β%)).
The number of vehicles in transition from searching to parking (nis/p): Calculated as a function of the number of available parking spaces Ai, the number of vehicles looking for parking spaces Nis, and the distance that an average searcher may cover during that time slice according to the length of the network di/L. The formulation is based on three possible contrary scenarios between (di), (si), and (L); in which (di) is the average cruising distance, (si) is the spacing between adjacent vehicles, and (L) is the length of the network.
-
Scenario 1: If di є [0, si]
-
Scenario 2: If di є (si, L]
-
Scenario 3: If di є [L, ∞)
Scenario 2 can be further subdivided into three sub-scenarios: mi > Ai, mi = Ai, and mi < Ai, respectively; where mi is the maximum number of vehicles passing at a specific point in time slice (i), and (Ai) is the available parking space at the beginning of time slice (i). The formula is simplified as Eq. (5) with respect to the time slice (t) range, and additional details can be obtained (Cao and Menendez, 2015).
The number of vehicles in transition from parking to non-searching state (n i p/ns)
Derived from the distribution of parking duration;
where, f(td) represents the probability density function of parking duration, and the integral part indicates whether or not vehicles are ready to depart between previous time slices.
As with nins/s, at any given time slice i, the total number of vehicles departing parking may include vehicles that accessed parking in the previous time slices, i’ є [1, i-1]. The probability that these vehicles depart parking during time slice i is equal to the probability of the parking duration being between (i- i’)*t and (i + 1 – i’)*t, the integral expression in Eq. (6).
The number of vehicles that leave the area in each time slice (n i ns/)
The number of departing vehicles calculated by adding up the number of through vehicles and the number of vehicles that reached the required distance to leave the system from parking at that time slice t, Eq. (7):
where,
γ i/′ and γ ′p/ : are binary variables (0 or 1) that indicate whether these vehicles leave the area within time slice i or not. Two conditions must be met for each case for the value to be equal to 1: the vehicles must have driven at least a distance of l/ or lp/ to leave the area, and they have not left the area previously.
At each time slice, the transition matrix features of the system continuously update the number of parking spaces (Ai), the density (K I), and speed (vi) dynamically, Eqs. (8), (9) and (10), respectively:
Graphically, a queueing diagram (cumulative number of vehicles versus time graph) is used to estimate the total travel time and the average cruising time. Figure 3 illustrates a time graph of the cumulative number of vehicles transitioning between each transition event.
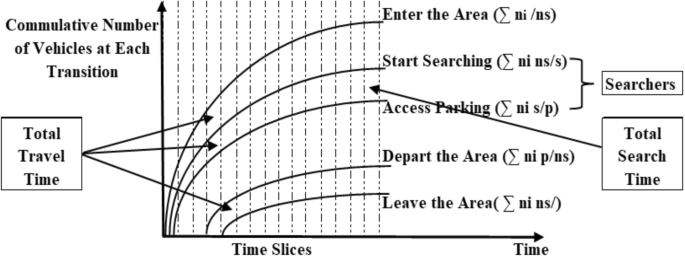
Theoretical queuing diagram of vehicles on parking—urban networks.
A validation of the model implemented performance is conducted by examining the aggregate cruising distance and time, formulated as Eqs. (11) and (12) below:
where, Ts(a, b) and Ds(a, b) are the commutative cruising time and the distance from a to b, respectively.
Case study
Studying area
Two contrasting but significant central business district (CBD) networks, Xujiahui in Shanghai and Bahnhofstrasse in Zurich, were selected for empirical analysis, as illustrated in Fig. 4.

a Xujiahui CBD, Shanghai and b Bahnhofstrasse, Zurich.
Xujiahui, a lively business district in Shanghai, symbolizes the vibrant economic expansion and urban progress of mainland China. It is renowned for its densely packed array of shopping centers, corporate offices, and cultural attractions, presenting a miniature representation of modern Chinese city life. In contrast, Bahnhofstrasse in Zurich exemplifies the stability and prosperity of Central Europe. It enjoys international recognition as one of the most prestigious shopping streets globally, adorned with upscale boutique stores, financial establishments, and historical landmarks that merge traditional European architecture with present-day economic endeavors. The deliberate choice of these two CBD regions was due to their significant portrayal of the socio-economic, political, and financial hubs in the respective areas. A large portion of their central business districts is dedicated to markets and stores, providing an excellent environment for examining the dynamics of parking systems in urban commercial zones.
This comparative analysis encompasses three primary evaluations. Initially, we assessed the present effectiveness of the prevailing parking systems within these central business districts. Subsequently, the responsiveness of these systems to parking policy modifications was investigated by employing an elasticity methodology, allowing for a more nuanced comprehension of the potential consequences resulting from minor policy adjustments. Finally, the ramifications of these policy changes on traffic emissions were quantified, offering a comprehensive understanding of the environmental implications arising from parking policies in prominent urban areas.
Input data
The estimated and real input data of the two CBDs: Bahnhofstrasse and Xujiahui, are mainly from the two cited literatures (Cao et al., 2019; Sun et al., 2016), respectively.
Bahnhofstrasse CBD
The location is situated in Zone A, in which only 10% of the parking lots are free to park (Cao et al., 2019). In Zurich’s parking zoning scheme, Zone A corresponds to the central city region with the strictest parking regulations and highest charges. The purpose of these regulations and fees is to control traffic congestion and promote frequent turnover of parking spaces. Zone B covers urban areas that are not as heavily regulated, offering a balance between accessibility for residents and visitors and turnover of parking spots. On the other hand, Zone C includes peripheral or residential areas where parking restrictions are minimal, often free or inexpensive. These areas are intended for longer-term parking and use by residents.
Basic information
The area is around 0.3 km², with a total length (L) of 7.7 km and 15.4 in lane–km. The total number of existing parking spots (A) in the network is 539, including 207 on-street parking spaces and two garages named Jelmoli and Talgarten (See Table 2 below), with the capacity of 222 and 110, and charging 3 and 4 CHF/h, respectively.
Initial conditions and traffic demand
The initial condition for non-searching and searching states is zero, but for the number of vehicles in parked states, N(0)p is 183. The proportion of new arrivals that correspond to through traffic is estimated as 23%.
Parking duration
The average parking duration is 227 min, and the parking duration Vs. frequency graph is approximated to the shape of the Gamma probabilistic distribution function of f(td)~Gamma (1.6,142) (see Fig. 5).

Probability distribution function of parking duration (f (td)).
Traffic properties of the area
Free-flow speed, critical, and min speed are given as 19.64 km/h., 12.5 km/h., and 4.54 km/h., respectively. The maximal traffic demand of the network is 250 veh/h/lane, and the critical and jam densities are set as 20 veh/km/lane and 55 veh/km/lane, respectively.
Traveling distance
All distance inputs of the model kept being uniformly distributed between 0.1 and 0.7, which means ~U (1/3 r, (2 + 1/3) r) for the given radius(r) = 0.3 km.
Xujiahui CBD
The area is located in Xuhui district in Shanghai and is historically referred to as the area of commerce and culture (Sun et al, 2016).
Basic information
The entire area is around 4.04 km², with a total length (L) 10.155 km and 34.21 in lane–km. The total number of the existing parking spots (A) (for public use) in the network is 2768 parking spaces (see Table 3. below).
Initial Conditions and traffic demand
The initial condition for the non-searching and searching states is zero, but for the number of vehicles in parked states assumed to be 940, to neglect the difference between the initial conditions of the two systems, the same proportion as Bahnhofstrasse is considered. The proportion of new arrivals that corresponds to through traffic is estimated at 70% (Ni and Sun, 2018) due to the nature of the traffic infrastructure around the network.
Parking duration
The average parking duration is 127-min (Sun et al., 2016), and the parking duration vs. frequency graph is approximated to the shape of Gamma probabilistic distribution function of f(td)~Gamma (4.98, 25.46) (see Fig. 5).
Traffic properties of the area
MFD data from April 2015, March 18–31, 2016, and August 1–14, 2016: Free-flow speed, critical and min speed given as 34.9 km/h, 19.46 km/h, and 8.59 km/h, respectively. The maximum Traffic demand of the network is 1275 veh/h/lane. Critical and jam density are set as 65.5 veh/km/lane, and 148.44 veh/km/lane, respectively.
Traveling distance
All travel distances kept being uniformly distributed between 0.38 and 2.646 km, which means ~U (1/3 r, (2 + 1/3) r) for the given radius(r) = 1.134 km.
Results and comparisons
Parking occupancy: As illustrated (Fig. 6), the Bahnhofstrasse appeared to be at the saturation level near the peak hour demand, whereas the Xujiahui maximum peak state is estimated at around 55% occupancy percentage. The saturation state in which there are more searching vehicles than available parking spaces, is recorded around the two peak sections between 9 a.m. to 11 a.m. and then from 7 p.m. to 9 p.m. At this saturation period in Bahnhofstrasse CBD, around 16 vehicles enter and leave the area without meeting their interest in parking.

Parking occupancy variation in 24 h in the two CBDs.
Cruising time and distance: The system dynamics model output for the aggregate daily cruising time and distance for Bahnhofstrasse is 213.19 h and 4178.27 km, respectively, but that of Xujiahui is 60 h and 2090.8 km, respectively. (Refer to Tables 3 and 4 in “A” row). The results were obtained by summing each dynamic time slice from 0 to 1440, of Eqs. (11) and (12).
Parking supply adjustment
Accordingly, the parking performance behavior of CBDs was examined during the introduction of parking policies of ±10% up to ±50% and then the corresponding performance indicators were obtained. ±10% up to ±50% of parking lots are used to assess the impact of changes introduced to the parking and traffic systems on the indicators. Sensitivity, elasticity, and indirect impact on the environment are quantified.
Sensitivity analysis
Sensitivity analysis was conducted to demonstrate how much the parking performance would be affected when certain parking-related policies were applied to the system. By introducing ±10% up to ±50% on the two CBDs, the cruising distance and time changes were obtained and are presented in Table 4 due to the parking space plus–minus from the existing number of parking spaces (A).
The results clearly demonstrate that the cruising time and distance of Xujiahui CBD are more stable than the Bahnhofstrasse CBD against the percentage change in parking space supply. The Xujiahui CBD experienced changes in parking performance after (‒45%) parking spaces were added from the base 2768 number of parking spaces. As a result, the Bahnhofstrasse CBD observed unstable and dramatic changes in parking performance between +20% and ‒50% from the base 539 parking spaces.
Elasticity analysis
Elasticity quantifies how much percentage of cruising distance will change as 1% of parking space change is introduced by Eq. (13). The purpose is to demonstrate how changes in parking policies affect the performance of the parking-traffic system. As shown in Fig. 7, Bahnhofstrasse CBD is less stable, both at plus or minus 1%, with a range of up to 8% elasticity. On the other hand, Xujiahui CBD changes begin at ‒40% space introduced, and rise to 3% at ‒50%, demonstrating better stability.

a Bahnhofstrasse and b Xujiahui CBD.
Traffic emission analysis
Traffic emission analysis is an extension of the parking performance-policy comparison, which discusses the effects of parking policy adjustments on the environment. The transportation sector accounted for approximately 20% of global greenhouse gas emissions in 2017 without considering international aviation and maritime emissions (EEA, 2018). From the most significant pollutants emitted by on-road vehicles (EEA, 2018), CO (Carbon Monoxide), VOCs (Volatile Organic Compound), NOx (Nitrogen Oxides) and PM (Particle Matter) have been regulated in legislation, as well as FC (Floro Carbons) and CH4 (Methane), which have a significant impact on Ozone depletion and greenhouse gases emissions, have been selected for this traffic emission comparison (Sun et al., 2020; Sun et al., 2021a; Sun et al., 2021b). A particular type of vehicle used for the carriage of passengers with no more than eight seats in addition to the driver’s seat and vehicles used for the carriage of goods with a maximum weight not exceeding 3.5 tons were selected due to the heavy-duty vehicle restrictions in both CBDs.
The average speed approach of the COPERT emission model (Ntziachristos et al., 2009) was used to calculate overall traffic emissions as a function of the emission factors and activity data. As this study mainly concentrated on the impact of cruising distance on the environment, only hot emissions were considered. Exhaust hot traffic emissions are described by emission factors (EFs), which describe the mass (unit: gm) of a compound emitted per driven distance (Colberg et al., 2005), as in Eqs. (14) and (15):
Thus, parameters were derived from the nature of a vehicle’s average travel speed (or road type), age, engine size and weight, and detail emission factors of the COPERT model (Ntziachristos and Samaras, 2019); and the VKT, vehicle kilometer travel were obtained to assess the impact of parking policy changes on the cruising distance.
Traffic emission: The aggregate yearly VKT is obtained from the daily cruising distance (neglecting seasonal variation for simplicity). Then the emission is weighted by each selected pollutant (Fig. 8). The result demonstrates that the Bahnhofstrasse parking system is highly sensitive to the policy change of reducing parking space.

a Bahnhofstrasse and b Xujiahui CBD.
Parking duration policy changing
During the second parking policy adaptation, the average parking duration was adjusted by ±10% up to ±50% from the existing mean value. After examining the impact of parking duration shifts on the two CBDs, traffic emissions are quantified as a function of the resulting aggregate annual cruising distance and traffic nature (Chen et al., 2020; Sun et al., 2018).
The sensitivity analysis was conducted to determine the effects of the fixed plus–minus of the average parking duration on the performance of the two parking systems. The impact of the average parking duration shift on the cruising nature of the parking systems is presented in Table 5. The Xujiahui CBD shows no change and maintains the system’s independence from parking duration; on the other hand, the Bahnhofstrasse CBD continues to be sensitive to shifts in parking duration.
To illustrate the property of the parking systems, the average parking duration elasticity on cruising distance was calculated. As shown in Fig. 9, the elasticity in Bahnhofstrasse extends up to more than 6%, while in Xujiahui CBD, a shift in parking duration doesn’t have an impact with zero elasticity.
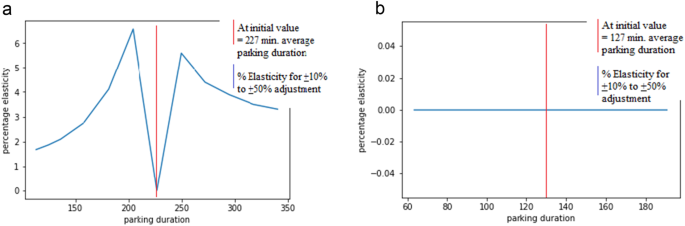
a Bahnhofstrasse and b Xujiahui CBD.
The environmental impacts for the two cases were also assessed, and are shown in Fig. 10. The Bahnhofstrasse CBD was found to have an increase in traffic emissions due to its longer cruising distance, while Xujiahui CBD does not show any significant impacts.
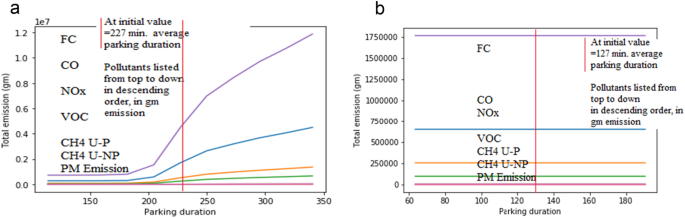
a Bahnhofstrasse CBD and b Xujiahui CBD.
Parking fee adjustment
The parking occupancy results in Fig. 6 show that only Bahnhofstrasse recorded saturation intervals. To increase the efficiency of the parking system, parking fees were adjusted in the network (Culjkovic, 2018). The saturation intervals were recorded between 9:00 and 11:00, and between 19:00 and 21:00, during which 16 vehicles searched for parking, then had to leave the area without getting a spot. Considering these unsatisfied demands for parking, adjustment of parking fees may be introduced as an option, as in Eq. (16):
From the simulation model, the overall cruising time is 213 h, among which the peak load is 2156 (4 space hrs. * 539), and the average value of time is 22.6 CHF per hour (Francesca, 2019), with an additional parking fee calculated as 2.23 CHF. This means the demand at this peak time must be subjected to 5.23 CHF and 6.23 CHF per hour for the Jelmoli garage and Talgarten garage, respectively. Meanwhile, pricing in reality is complex, and even its antecedent shadow could have sociopolitical consequences. A further investigation of price elasticity to demand and cross-relationships between different factors may help to provide insights into the behavioral economics of certain transportation networks.
Conclusions
This study models urban parking system dynamics using macroscopic network data, instead of individual microscopic data, which saves and minimizes data collection and computational costs significantly. Moreover, the model doesn’t require complex simulations and can be solved with a comparable simple numerical solver or Excel spreadsheet. The main objective is to determine how parking-traffic systems change as a result of parking policy changes, including cruising time, cruising distance, and parking occupancy variation. The sensibility and elasticity results on ±10 to ±50 adjustments of policy changes were examined. Then, by adopting a straightforward emission model, the paper articulated how different parking policy changes impact the environment in different CBDs. The emissions of different pollutants were calculated as a function of the cruising distance from policy changes. Additionally, it was found that parallel peak hours and initial conditions of parking state proportion offered a clear picture of the performance of the parking system with policy changes. The comparative study summarizes that Bahnhofstrasse CBD is more responsive to parking policy changes than Xujiahui CBD. By investigating policy impacts on both parking and traffic indicators, the results were found to be dependent on the aggregated daily cruising distances, which may be indirectly reflected in the nature of the infrastructural development, the proportion of through-traffic, the culture of vehicle ownership, and driver behavior of the two cities. Therefore, one possible explanation is that Xujiahui CBD in Shanghai was largely considered as a bypass rather than a destination or trip ending compared to Bahnhofstrasse CBD. This deductive reasoning may be related to the varying percentage of through vehicles, which also has a domino effect on the resulting aggregate daily cruising distance.
The research employed a model that utilizes the macroscopic fundamental diagram to examine parking and traffic flow more efficiently and with reduced computational expenses. In contrast to studies based on microscopic analysis, which necessitate extensive data and intricate calculations, this paper employs typical values and fundamental principles of probability and traffic flow theories. The methodology not only simplifies the analysis but also improves user-friendliness for a broader audience, including urban planners and traffic managers without specialized knowledge in traffic modeling.
Combined data at the network level over time were utilized to offer a notable benefit for practical uses, which allow for a more efficient and affordable examination of traffic and parking trends and are especially important for cities with limited resources. Additionally, the dynamic or continuous-time modeling and calculations provide valuable information about the real-time operation of parking and traffic systems. This aspect is particularly advantageous for urban managers and policymakers as it empowers them to make better-informed choices regarding traffic management and urban development. The framework can be useful for city planners and traffic authorities to improve parking policies and manage traffic flow. By comprehending larger patterns and changes, managers may stipulate better regulations for parking, thus decreasing traffic congestion and enhancing urban mobility. Furthermore, the modeling capability in various policy scenario simulations may also serve as a valuable tool in strategic planning, allowing cities to anticipate and address potential problems in the transportation systems.
Overall, this paper offers a structure for a pragmatic method to evaluate parking and traffic that has the potential to assist with urban planning and administration. The simplicity, affordability, and ability to analyze in real-time make it an essential resource for city officials and decision-makers to improve urban mobility and sustainability (Ma et al., 2023; Nian et al., 2024). The research holds great potential for enhancing our comprehension of parking system effectiveness and its ecological consequences. Nonetheless, it is imperative to recognize the limitations of the study, as they open up opportunities for future research directions. First, the model configuration utilized, although effective for conducting comparative analysis, is mainly based on a number of simplified assumptions. The assumption that parking locations are uniformly distributed fails to acknowledge the intricate spatial dynamics of urban areas, where parking availability varies due to various local factors. Future models should incorporate spatial variations to accurately reflect the complexities inherent in urban landscapes. Moreover, the use of a fixed peak hour time and a constant demand distribution does not capture the variable nature of urban traffic. Traffic conditions in urban areas are subject to fluctuations influenced by diverse factors, which may be modeled through a dynamic approach. For example, the interaction between local and transit traffic in urban settings is a dynamic phenomenon that requires further exploration in subsequent studies to fully understand its impact on traffic flow and parking demand. In terms of estimating traffic emissions, applying uniform emission factors across different cities may not accurately represent the unique environmental contexts of each location. A finer understanding of environmental impacts may be obtained by incorporating city-specific emission factors and pollutant types in future studies. Using the European traffic emission assessment model without adaptation poses limitations when applied to the Chinese context. Considering regional differences in vehicle types, driving behaviors, and urban layouts is crucial for obtaining emission factors that are more accurate and specific to each region.
While this study offers valuable insights into Xujiahui in Shanghai and Bahnhofstrasse in Zurich, it is important to recognize that these specific areas may not fully represent the diverse range of urban settings. Therefore, including a more varied selection of urban areas would allow for assessing the broader applicability and adaptability of the developed model. To conclude, this research contributes to understanding of urban traffic and parking management by uncovering important relationships and patterns. However, the outlined limitations underscore the necessity for more comprehensive studies, which may be addressed to provide more accurate assessments of environmental impacts and support the development of effective urban planning and policy-making strategies aimed at enhancing urban mobility and sustainability. To optimize performance evaluation, future studies should explore how dynamic pricing influences parking demand and traffic indicators. Additionally, quantifying behavioral changes resulting from updated policies may assist in establishing a framework for optimizing cruising distance and time with efficient parking occupancy, which is crucial in developing future transportation applications such as smart parking systems, as well as designing continual evaluations of smart applications like smart garages, smart parking apps, smart parking reservations, and Parking Variable Message Signs (VMS). In fact, the transport bureau of Xujiahui district, Shanghai is planning for possible dynamic parking tolling in several selected parking lots, which would definitely affect the parking demand, and with some meaningful outputs, although the counterpart CBD, Bahnhofstrasse, may not have similar implementations. Furthermore, incorporating realistic assumptions about variations in the value of time (VOT) across different income groups may address model limitations that only consider car demand while neglecting the factors influencing on- and off-street parking decisions, which may be explored in future research efforts.
Data availability
Some or all data, models, or codes that support the findings of this study are available from the corresponding author upon reasonable request.
References
Anderson SP, De Palma A (2004) The economics of pricing parking. J Urban Econ 55(1):1–20
Arnott R, De Palma A, Lindsey R (1991) A temporal and spatial equilibrium analysis of commuter parking. J Public Econ 45(3):301–335
Arnott R, De Palma A, Lindsey R (1993) A structural model of peak-period congestion: A traffic bottleneck with elastic demand. Am Econ Rev 83(1):161–179
Arnott R, Rowse J (1999) Modeling parking. J Urban Econ 124:97–124
Arnott R, Inci E (2010) The stability of downtown parking and traffic congestion. J Urban Econ 68(3):260–276
Axhausen KW, Polak JW (1991) Choice of parking: stated preference approach. Transportation 18(1):59–81
Balac M, Ciari F, Axhausen KW (2017) Modeling the impact of parking price policy on free-floating carsharing: case study for Zurich, Switzerland. Transport Res Part C Emerg Technol 77:207–225
Benenson I, Martens K, Birfir S (2008) PARKAGENT: an agent-based model of parking in the city. Comput Environ Urban Syst 32(6):431–439
Boyles SD, Tang S, Unnikrishnan A (2015) Parking search equilibrium on a network. Transport Res. Part B Methodol 81:390–409
Cao J, Menendez M (2015) System dynamics of urban traffic based on its parking-related-states. Transport Res. Part B Methodol 81:718–736
Cao J, Menendez M, Waraich R (2019) Impacts of the urban parking system on cruising traffic and policy development: the case of Zurich downtown area, Switzerland. Transportation. 46:883–908
Cavadas J, Antunes AP (2019) An optimization model for integrated transit‑parking policy planning. Transportation. 46:1867–1891
Chen Q, Wang Y, Pan S (2016) Characteristics of parking in Central Shanghai. China. J Urban Plan Dev 142(3):05015012
Chen FX, Yin ZW, Ye Y, Sun DJ (2020) Taxi hailing choice behavior and economic benefit analysis of emission reduction based on multi-mode travel big data. Transport Pol. 97:73–84
Colberg CA, Tona B, Stahel WA, Meier M, Staehelin J (2005) Comparison of a road traffic emission model (HBEFA) with emissions derived from measurements in the Gubrist road tunnel, Switzerland. Atmos Environ 39(26):4703–4714
Culjkovic V (2018) Influence of parking price on reducing energy consumption and CO2 emissions. Sust Cities Soc 41:706–710
Daganzo CF, Geroliminis N (2008) An analytical approximation for the macroscopic fundamental diagram of urban traffic. Transport Res Part B Methodol 42(9):771–781
Dong Y-H, Peng F-L, Qiao Y-K (2021) Identification of the spatial distribution pattern and driving forces of underground parking space based on multi-source data: a case study of Fuzhou City in China. Sust Cities Soc 72:103084
EEA (2018) Greenhouse gas emissions from transport—European Environment Agency. EEA https://www.eea.europa.eu/data-and-maps/indicators/transport-emissions-of-greenhouse-gases/transport-emissions-of-greenhouse-gases-11
Francesca L (2019) “The World’s Best-Paid Cities.” Resonance. Forbes https://www.forbes.com/2009/08/24/best-paid-cities-lifestyle-real-estate-worlds-income-salary.html#d191b2e29883
Gallo M, D’Acierno L, Montella B (2011) A multilayer model to simulate cruising for parking in urban areas. Transport Pol 18(5):735–744
Geroliminis N, Daganzo CF (2008) Existence of urban-scale macroscopic fundamental diagrams: Some experimental findings. Transport Res Part B Methodol 42:759–770
Gu Z, Najmi A, Saberi M, Liu W, Rashidi TH (2020) Macroscopic parking dynamics modeling and optimal real-time pricing considering cruising-for-parking. Transport Res C Emerg Technol 118:102714
Gu Z, Safarighouzhdi F, Saberi M, Rashidi TH (2021) A macro-micro approach to modeling parking. Transport Res B Methodol 147:220–244
Horni A, Montini L, Waraich RA, Axhausen KW (2013) An agent-based cellular automaton cruising-for-parking simulation. Transportation Lett Int J Transport Eng 5(4):167–175
Huang Y, Sun D, Li A, Axhausen KW (2021) Impact of bicycle traffic on the macroscopic fundamental diagram: some empirical findings in Shanghai. Transportmetrica A 17(4):1122–1149
Huang Y, Sun D, Li A, Axhausen KW (2022a) Three-dimensional macroscopic fundamental diagram for car and bicycle heterogeneous traffic. Transportmetrica B 10(1):312–339
Huang Y, Sun D, Li A, Garrick N, Zhang S, Liu W (2022b) Spatiotemporal approach for evaluating the vehicle restriction policy with multi-sensor data, transport. Res Rec 2676(8):724–736
Jakob M, Menendez M, Cao J (2020) A dynamic macroscopic parking pricing and parking decision model. Transportmetrica B 8(1):307–331
Jakob M (2021) Parking policies and their impacts on urban networks, Doctoral dissertation, ETH Zurich
Kang D, Hu F, Levin MW (2022) Impact of automated vehicles on traffic assignment, mode split, and parking behavior. Transport Res D-TR E 104:103200
Kladeftiras M, Antoniou C (2013) Simulation-based assessment of double-parking impacts on traffic and environmental conditions. Transport Res Rec 2390(1):121–130
Levy N, Martens K, Benenson I (2013) Exploring cruising using agent-based and analytical models of parking. Transportmetrica A 9(9):773–797
Loder A, Ambühl L, Menendez M, Axhausen KW (2017) Empirics of multi-modal traffic networks: using the 3D macroscopic fundamental diagram. Transport Res Part C Emerg Technol 82:88–101
Ma W, Wang N, Li Y, Sun DJ (2023) 15-min pedestrian distance life circle and sustainable community development in Chinese metropolitan cities: a diagnosis. Humanit Soc Sci Communs 10(364):1–14
Marki F, Charypar D, Axhausen KW (2014) Agent-based model for continuous activity planning with an open planning horizon. Transportation 41(4):905–922
Mesfin BG, Sun DJ, Peng B (2022) Impact of COVID-19 on urban mobility and parking demand distribution: a global review with case study in Melbourne, Australia. Int J Environ Res Public Health 19(13):7665. https://doi.org/10.3390/ijerph19137665
Ni X-Y, Sun DJ (2017) Agent-based modelling and simulation to assess the impact of parking reservation system. J Adv Transport ume 2017:2576094
Ni X-Y, Sun DJ (2018) An agent-based simulation model for parking variable message sign location problem. Transport Res Rec 2672(19):135–144
Ni X-Y, Sun DJ, Zhao J, Chen Q (2024) Two-stage allocation model for parking robot systems using cellular automaton simulation. Transport Res Rec (2024) https://doi.org/10.1177/03611981241230530
Nian GY, Pan H, Huang J, Sun DJ (2024) Labor supply decisions of taxi drivers in megacities during COVID-19 pandemic period. Travel Behav Soc. 35:1–14. https://doi.org/10.1016/j.tbs.2024.100745
Ntziachristo L, Gkatzoflias D, Kouridis C, Samaras Z (2009) COPERT: a European road transport emission inventory model. Info Tech Environ Eng 2009(4):491–504
Ntziachristos L, Samaras Z (2019) COPERT documentation. EMISIA SA https://www.emisia.com/utilities/copert/documentation/ (2019)
Pierce G, Shoup D (2013) SFpark: pricing parking by demand. Access 43(Fall):20–28
Qian Z, Xiao F, Zhang HM (2012) Managing morning commute traffic with parking. Transport Res B Methodol 46(7):1346–1359
Shen T, Hong Y, Thompson MM, Liu J, Wu L (2020) How does parking availability interplay with the land use and affect traffic congestion in urban areas? The case study of Xi’an. China Sust Cities Soc 57:102126
Shoup DC (1997) The high cost of free parking. J Plan Educ Res 17(1):3–20
Shoup DC (2006) Cruising for parking. Transport Pol 13(6):479–486
Sun DJ, Ni X-Y, Zhang L (2016) A discriminated release strategy for parking variable message sign display problem using agent-based simulation. IEEE Trans Intell Transp Syst 17(1):38–47
Sun DJ, Zhang K, Shen S (2018) Analyzing spatiotemporal traffic line source emissions based on massive Didi online car-hailing service data. Transport Res D-TR E 62:699–714
Sun DJ, Ding X (2019) Spatiotemporal evolution of ridesourcing markets under the new restriction policy: a case study in Shanghai. Transport Res A-POL 130:227–239
Sun DJ, Yin Z, Cao P (2020) An improved CAL3QHC model and the application in vehicle emission mitigation schemes for urban signalized intersections. Build Environ 183:107213. Article ID
Sun DJ, Zhang Y, Zhang L (2021a) Spatiotemporal distribution of traffic emission based on wind tunnel experiment and computational fluid dynamics (CFD) simulation. J Clean Prod 281:124495
Sun DJ, Wu S, Shen S, Xu T (2021b) Simulation and assessment of traffic pollutant dispersion at an urban signalized intersection using multiple platforms. Atmos Pollut Res 12(7):1–13. 101087
Waraich RA, Axhausen KW (2012) Agent-based parking choice model. Transport Res Rec 2319:39–46
Weinberger R, Kaehny J, Rufo MUS (2012) Parking policies: an overview of management strategies institute for transportation and development policy. Institution for Transportation and Development Policy, https://www.itdp.org/publication/u-s-parking-policies-an-overview-of-management-strategies/
Wen L, Kenworthy J, Guo X, Marinova D, Kenworthy J (2019) Solving traffic congestion through street renaissance: a perspective from dense Asian cities. Urban Sci 3(1):18
Xiao LL, Liu TL, Huang HJ (2019) Tradable permit schemes for managing morning commute with carpool under parking space constraint. Transportation. 48:1563–1586
Zhang P, Chen Z, Liu H (2019) Study on the layout method of Urban underground parking system-a case of underground parking system in the Central Business District in Linping New City of Hangzhou. Sust Cities Soc 46:101404
Zhao C, Li S, Wang W, Li X, Du Y (2018) Advanced parking space management strategy design: an agent-based simulation optimization approach. Transport Res Rec 2672(8):901–910
Zhao C, Liao F, Li X, Du Y (2021) Macroscopic modeling and dynamic control of on-street cruising-for-parking of autonomous vehicles in a multi-region urban road network. Transport Res Part C Emerg Technol 128:103176
Zhao C, Cao J, Zhang X, Du Y (2022) From search-for-parking to dispatch-for-parking in an era of connected and automated vehicles: a macroscopic approach. J Transport Eng A: Syst 148(2):1–14
Acknowledgements
The research was funded in part by the National Nature Science Foundation of China [52172319, 71971138], the National Social Science Foundation of China (22XJY030), and the Xuzhou Industry-University-Research Cooperation Project [KC21340]. Any opinions, findings, conclusions, or recommendations expressed in this paper are those of the authors and do not necessarily reflect the views of the sponsors. Part of the manuscript has been accepted and presented in the 101st Annual Meeting of Transportation Research Board, Washington, DC, 2022.01.14, submitted as a long abstract with no more than 2000 words. The authors are grateful for the opportunity for the conference organizers.
Author information
Authors and Affiliations
Contributions
The authors confirm their contribution to the paper as follows. Biruk Gebremedhin Mesfin: literature search and review, experiment design and conduction, modeling, manuscript writing; Zihao Li: experiment design and conduction, manuscript review and editing; Daniel(Jian) Sun: modeling, scheme proposal, manuscript review and editing; Deming Chen: experiment design and conduction, manuscript review and editing; Yueting Xi: modeling, manuscript review and editing, conclusion.
Corresponding author
Ethics declarations
Competing interests
The authors declare no competing interests. The authors confirm that the manuscript has been read and approved by all named authors and that there are no other persons who satisfied the criteria for authorship but are not listed. We further confirm that the order of authors listed in the manuscript has been approved by all of us.
Ethical approval
Ethical approval is not applicable as this study did not involve human participants.
Informed consent
There are no human subjects involved in this article and informed consent is not applicable.
Additional information
Publisher’s note Springer Nature remains neutral with regard to jurisdictional claims in published maps and institutional affiliations.
Rights and permissions
Open Access This article is licensed under a Creative Commons Attribution 4.0 International License, which permits use, sharing, adaptation, distribution and reproduction in any medium or format, as long as you give appropriate credit to the original author(s) and the source, provide a link to the Creative Commons licence, and indicate if changes were made. The images or other third party material in this article are included in the article’s Creative Commons licence, unless indicated otherwise in a credit line to the material. If material is not included in the article’s Creative Commons licence and your intended use is not permitted by statutory regulation or exceeds the permitted use, you will need to obtain permission directly from the copyright holder. To view a copy of this licence, visit http://creativecommons.org/licenses/by/4.0/.
About this article

Cite this article
Mesfin, B.G., Li, Z., Sun, D.(. et al. Urban traffic-parking system dynamics model with macroscopic properties: a comparative study between Shanghai and Zurich. Humanit Soc Sci Commun 11, 616 (2024). https://doi.org/10.1057/s41599-024-02959-w
Received:
Accepted:
Published:
DOI: https://doi.org/10.1057/s41599-024-02959-w
