
Abstract
Multi-drug resistant (MDR) bacteria are considered a serious public health threat. Also, increasing rate of resistance to anticancer drugs, as well as their toxicity, is another point of concern. Therefore, the new antibacterial and anticancer agents are always needed. The synthesizing silver nanoparticles (AgNPs) using medicinal plants, is an effective approach for developing novel antibacterial and anticancer agents. Rubus discolor, a native species of the Caucasus region, produces leaves that are typically discarded as a by-product of raspberry production. The present study has focused on optimizing the green synthesis of AgNPs using R. discolor leaves extract through response surface methodology. The optimal values for AgNPs synthesis were an AgNO3 concentration of 7.11 mM, a time of 17.83 h, a temperature of 56.51 °C, and an extract percentage of 29.22. The production of AgNPs was confirmed using UV–visible spectroscopy (λmax at 456.01 nm). TEM analysis revealed well-dispersed AgNPs (an average size of 37 nm). The XRD analysis confirmed the crystalline structure. The EDX detected a strong peak at 3 keV corresponded to Ag. The zeta potential value (− 44.2 mV) indicated the stability of nanoparticles. FT-IR spectra showed the presence of various functional groups from plant compounds, which play an important role in the capping and bio-reduction processes. The AgNPs revealed impressive antibacterial activities against MDR Escherichia coli and Pseudomonas aeruginosa (MIC ranging from 0.93 to 3.75 mg ml−1). The phytochemical analysis indicated the presence of phenolics, tannins, and flavonoids on the surface of AgNPs. They also showed significant cytotoxic effects on A431, MCF-7, and HepG2 cells (IC50 values ranging from 11 to 49.1 µg ml−l).
Introduction
The study and application of nanostructured materials, with sizes ranging from 1 to 100 nm, have been highlighted recently because they are widely applicable in many multidisciplinary fields1,2,3,4,5. Compared to bulk materials, nanoparticles (NPs) have a larger surface area to volume ratio and ultra-small size, which give them unique thermal, physiochemical, and biological properties6,7. These characteristics make them attractive candidates for developing countless applications in agriculture, biology, chemical engineering, biomedicine, and pharmaceutical industry8. According to their shapes, sizes, and properties, NPs have been classified into several groups, including carbon-based nanoparticles, polymeric nanoparticles, ceramic nanoparticles, and metal nanoparticles9. Among them, metal nanoparticles comprise gold, silver, copper, magnetic (cobalt, iron, and nickel), and semiconducting materials2,10. Silver nanoparticles (AgNPs) have gained significant attention based on various biological activities, including, antibacterial, antifungal, antiviral, anticancer, anti-inflammatory, and wound healing properties11,12. They have been used in food processing, cosmetics, home cleaning, catalytic and garment production, and pharmaceutical industry13.
There are various mechanical and chemical methods for producing nanomaterial that have several disadvantages, such as high cost, low yield, and being relatively complicated. Also, they are not environmentally friendly due to the application of toxic chemicals and solvents, and the production of dangerous by-products6,9,14. However, the green approaches for NPs production are eco-friendly, easy to apply, and safe for the environment, human beings, and living organisms11,15. Therefore, there is an increasing demand for developing safe methods to produce nanomaterials, using fungi, bacteria, or plants6,16,17,18,19. The plant extracts are preferred over other natural materials. Many natural compounds have been discovered in medicinal plants that play a crucial role in the preparation of nanoparticles12. The plant’s secondary metabolites, such as phenolic compounds, tannins, flavonoids, anthraquinones, carbohydrates, alkaloids, alkynes, allylic benzenes, ascorbic acids, alcoholic compounds, sugars, amides, amino acid residues, carotenes, steroids, saponins, and triterpenoids have proven to be able to reduce silver nitrate to AgNPs7,12,20. Recent investigations have revealed that NPs synthesized by bioactive phytochemicals possess more beneficial and effective properties than traditional herbal drugs12.
The World Health Organization (WHO) has recently declared antibacterial resistance as one of the three main risks to human health21. Drug-resistant pathogens kill about 700,000 people worldwide each year, and this number could increase to 10 million deaths a year by 205022. Presently, the rapid development of drug-resistant strains of microorganisms as well as the serious lack of effective antibiotics, have revealed that the discovery and development of novel antimicrobial agents are logically necessary22,23. Silver is an inorganic antibacterial agent, which is nontoxic and safe. It is effective against 650 types of pathogenic microorganisms24. Studies showed that AgNPs can exert significant antibacterial activity against MDR (multi-drug resistant) bacteria by several mechanisms, such as inhibition of the cell respiration chain, disrupting the cellular signal transduction pathways, and generating reactive oxygen species (ROS), which causes toxicity in cells12,25,26,27.
Moreover, cancer is the second leading cause of death universally after cardiovascular diseases28. The American Cancer Society predicted that the worldwide burden of cancer will surge to 21.7 million fresh cases by the year 203029. Today, there is growing attention to discovering inexpensive and more cost-effective drugs using natural resources like medicinal plants. The plants have been provided various new approaches for the cancer treatment, including green synthesis of AgNPs29.
Blackberries, Rubus spp., Rosaceae family, are widely distributed and cultivated worldwide and are of growing commercial relevance30. This genus comprises over 750 species in the world. The sweet taste fruits of many species are popular as a healthy and nutritious food, containing various phenolic compounds, dietary fiber, vitamin C, α-tocopherol, and carotenoids31,32. Also, blackberry leaves have been used traditionally, in form of tea or as a mouthwash, and gargle solution. It is reported that blackberry leaves have important bioactive components, such as phenols, flavonoids, tannins, terpenoids, and other anti-aging and antioxidant compounds, and can serve as a potential source for use in the food, pharmaceutical industry, and cosmetic32,33. In the flora of Iran, eight species of blackberry have been reported34. Rubus discolor Weihe & Nees., commonly known as Himalayan blackberry, is a native species of the Caucasus region of Eurasia35. It is widely distributed in the North and Northwest of Iran as a common weed36. Since the Rubus leaves are significantly consumed less than fruits, a large number of leaves are disposed of as a by-product of raspberry production32.Currently, the assessment of bioactive phytochemicals in the eliminated plant material has attracted great interest, because these by-products have high levels of constituents with biological properties37. As a result, the ecofriendly synthesis of AgNPs from the leaves which have potential biological activities could be of interest.
In the present study, the aqueous extract of Rubus discolor leaves was used for the biosynthesis of the AgNPs. The synthesis condition was optimized by response surface methodology (RSM). The nanoparticles were characterized by UV–Vis and FT-IR spectroscopic methods, as well as XRD, DLS, SEM–EDX, and TEM methods. The preliminary phytochemical investigations and the determination of total phenolic, tannin, and flavonoid contents were performed. The antibacterial activity was tested against two ATCC Gram-positive (Streptococcus aureus and Bacillus subtilis) and two ATCC Gram-negative bacteria (Escherichia coli and Pseudomonas aeruginosa). Also, ten MDR isolates of E. coli and P. aeruginosa were tested to investigate their susceptibility to the synthesized AgNPs. The cytotoxic activities of AgNPs and extract were investigated against three cancerous cell lines, including MCF-7 (breast cancer), A431 (epidermoid carcinoma), and HepG2 (liver hepatocellular carcinoma) as well as a normal cell line (HU02) by MTT assay.
Results and discussion
Phytochemical investigation of the aqueous extract and AgNPs
The preliminary phytochemical analysis of the aqueous extract of leaves revealed the presence of flavonoids, tannins, steroids, and carbohydrates (Table 1).
The total phenolic content (TPC) of the aqueous extract and AgNPs were calculated based on the gallic acid standard curve equation (y = 0.000899x − 0.0355, R2 = 0.999), using the Folin-Ciocalteu method. Also, the total flavonoid contents (TFC) were measured, based on the quercetin standard curve (y = 0.0192x − 0.0198, R2 = 0.995). The total tannin contents (TTC) were measured using the following standard curve plotted for tannic acid (as standard compound): y = 0.005x + 0.0281; R2 = 0.995. All the results are depicted in Table 2. According to the results, AgNPs showed lower TPC, TTC, and TFC than the aqueous leave extract. The reduction in polyphenolic contents was also reported in other studies7,38,39. The suggested reason is that the phenolic, tannin, and flavonoid compounds in the extract were consumed in the reduction process in the green synthesis of the AgNPs. Moreover, the concentration of these secondary metabolites determines the kinetics of the reaction, shape, and size of AgNPs38.
Statistical process optimization of green synthesis AgNPs using RSM
The results of the central composite design (CCD) for optimizing Ag synthesis conditions, including AgNO3 concentration, time, temperature, and the extract percent, were represented in Table 3.
A set of 30 runs based on the formula 2N + 2 N + X was conducted, where N is the number of selected factors with 2N factorial (16 runs), 2N axial (8), and X center points repetitions (6 runs). The Eq. 1 shows the correlation between the absorbance at 456 nm (as an indicator of SPR) and the four studied parameters in coded terms:
where Y is the absorbance at 456 nm; A is AgNO3 concentration; B is the time of reaction; C is temperature; and D is the extract percentage. The analysis of variance (ANOVA) was carried out to investigate the suitability of the obtained model (Table 4).
Based on the statistics, a quadratic model was suggested to relate the experimental factors and their combinations and the response. The high F-value (30.34) and the low p value (p < 0.0001, only 0.01% chance of noise) showed that the obtained model is significant and acceptable. The variables A, B, C, D, AD, A2, B2, C2, and D2 were the significant parameters on the basis of p value (p < 0.05). The F-value lack of fit was 3.38 with a p value of 0.1723 (chance of noise 17.23%), which shows the model is valid.
Three parameters, including the calculated determination coefficient (R2 and adjusted R2) and adequate precision, were used to evaluate the model’s efficacy of R2 and adjusted R2 values of 0.9703 and 0.9383, respectively, showed that the model has high efficacy and can properly explain the variability. Adequate precision (AP) of 19.305 (AP > 4 is desirable), which shows the signal-to -noise ratio, indicated adequate signal-to-noise. The Predicted R2 of 0.7957 showed a high correlation between predicted and observed responses. It should be in reasonable agreement with adjusted R2 (within the range of 0.2 adjusted R2).
For evaluation of the best condition for each factor to obtain the maximum AgNPs yield, the 3D surface and contour plots were used (Fig. 1). These plots were on the basis of the corresponding interactions of two factors, while the third parameter was fixed at the optimum condition. The shape of the 3D contour plot shows the interaction significance.

Three dimensions surface plots of AgNPs biosynthesis (a–f): Interaction effects of AgNO3 concentration (A), time (B), temperature (C), and extract percent (D) on the maximum absorbance value (Amax).
Figure. 1a–c shows that AgNO3 concentration (A) had a significant effect on the AgNPs synthesis. When AgNO3 concentration increased, the yield of AgNPs increased depending on the second parameter. Othman et al. reported that AgNO3 concentration strongly affected the yield of AgNPs synthesis when interacting with other factors such as reaction pH value40. Likewise, El-Rafie showed that increasing the silver nitrate concentration dramatically increased the absorbance intensity41. Figures 1a, e, and f show that the time of the reaction (B) had a lesser momentous influence on yield of AgNPs synthesis in the interaction with AgNO3 concentration (A), temperature (C), and extract percent (D). When the reaction time increased, the AgNPs biosynthesis increased by the interaction of the second factor, including A, C, or D. Figures 1b, d, and f prove that temperature (C) had a stronger effect on the AgNPs biosynthesis than the time of reaction. Also, in a study, the AgNPs were synthesized using Plantago major extract, and it was showed that temperature had higher effect on the absorbance in comparison with time42. Figures 1c, e, and f explain that extract percent (D) had the second rank in the AgNPs synthesis after AgNO3 concentration. The yield of AgNPs biosynthesis increased with the increase in extract percent due to higher reducing agents in the reaction mixture43. A strong interaction was observed between A and D, and other interactions were not significant. The 3D surface plots showed that the effects of the four studied parameters on the AgNPs green synthesis were not equal, and the order of factors was as follows: A > D > C > B, respectively. In the optimized condition, the selected experimental model was tested using AgNO3 concentration of 7.11 mM, time of 17.83 h, temperature of 56.51, and extract percent of 29.22. The predicted absorbance at 456 nm was 1.92, which is close to the experimental value (2.12) that indicates the validity of the models. The yield of the reaction, in optimized condition was 53.31%.
Characterization of AgNPs
Optical properties and UV–Vis spectroscopy of the synthesized AgNPs
The formation of AgNPs was first characterized by the observation of color change from pale yellow to dark brown, that revealed the Ag+ reduction into Ag0 nanoparticles. The color transformation is due to AgNPs’ optical properties and known as the localized surface plasmon resonance (SPR)44. Various factors like particle type, size, shape, morphology, dielectric environment, and composition have an impact on SPR. Also, UV–Vis spectroscopy is a common characterization tool to detect the SPR absorption peak of NPs and demonstrate their formation45. As depicted in Fig. 2, the UV–V is spectrum of AgNPs showed a SPR at 456.01 nm. In a study, Said et al. reported that the UV–vis spectrum of the AgNPs they produced was observed at 460 nm16. Additionally, Patra et al. revealed that their AgNPs had a maximum absorbance peak at 456 nm46. These findings are consistent with our study.

UV–Vis spectrum of the R. discolor extract and AgNPs.
The numerous phytochemicals present in the aqueous extract of R. discolor could be responsible for the rapid bioreduction and capping of synthesized AgNPs. Typically, the bioactive compounds such as vitamins, flavonoids, tannins, phenolic acids, proteins, etc., are responsible for the fast reduction of Ag+, and control the size distribution and morphology of synthesized NPs47. According to the results of this study, the leaves extract contained tannins, flavonoids, steroids, and carbohydrates, which can act as reducing agents.
TEM analysis
The AgNPs were evaluated by the transmission electron microscopes (TEM) for elucidation of the size, shape, and morphology. The microphotographs displayed that the nanoparticles were well-distributed and roughly spherical, with polydispersity, and without agglomeration. The size of the most particles ranged between 20 and 50 nm, with an average size of 37 nm (Fig. 3). It can be suggested that during the reaction, the content of reducing agent in plant extract deceased gradually, which led to the formation of AgNPs in different sizes. Also, careful observation of TEM images revealed no direct connection among AgNPs, even within the aggregates, presenting that AgNPs were surrounded by a thin layer of natural phytochemicals like amino acids and phenolic compounds7,38. In a study, Mariadoss et al. reported that the morphology of the AgNPs synthesized by the extract of Malus domestica was spherical, with polydispersity and a size ranging from 40 to 100 nm48. Also, Yassin et al. synthesized AgNPs from Origanum majorana, which showed polydispersity, with a size range from 10 to 60 nm8.

TEM images of AgNPs at optimized condition.
SEM–EDX analysis
The surface nature and the elemental configuration of the AgNPs were determined by Scanning Electron Microscopy (SEM) with Energy Dispersive X-Ray (EDX) analysis. The SEM image displayed that AgNPs were polydisperse, about 38 nm in size, and predominantly spherical in shape (Fig. 4). The EDS analysis of the AgNPs was conducted to study the elemental composition of AgNPs. EDX analysis displayed a strong signal at 3.0 keV, which is characteristic of metallic Ag because of surface plasmon resonance, associated with the Ag-La line49. Additionally, the profile exhibited peaks for oxygen and carbon which could be attributed to the phytoconstituents attached to the surface of the AgNPs. Our results were in accordance with those of Okaiyeto et al., which produced AgNPs using aqueous extract of Oedera genistifolia, showing the presence of intense peak of silver element at 3.0 keV50. Moreover, Patra et al. synthesized AgNPs from Pisum sativum. The EDX spectra of their study showed the elemental composition of the AgNPs, with a strong peak at 3 keV that corresponded to Ag46.

SEM image (a) and EDX spectrum (b) of biosynthesized AgNPs.
Zeta potential and DLS analysis
The particle size distribution of biosynthesized AgNPs was determined using a dynamic light scattering (DLS). The DLS determines the hydrodynamic size of colloids, and can estimate the average size of the nanoparticles in the mixture, approximately51. The results of this study indicated that the particle size and poly-dispersity index (PDI) values of AgNPs were 151.7 nm and 0.25, respectively (Fig. 5). As reported in previous studies, PDI (also known as heterogeneity index) shows the non-uniformity of particles in a colloidal solution. This value is unitless and is considered between 0.05 and 0.7. A PDI value close to 0.05 indicates that the particles are monodispersed, while colloidal solutions with PDI values close to 0.7 are heterogenous51,52. In this study, the reported PDI value of 0.25 is acceptable. On the other hand, the zeta potential (ζ) is one of the important factors for the characterization of the stability of nanoparticles in a solution. Nanoparticles with zeta potentials larger than + 30 mV and less than − 30 mV show considerable stability for colloidal dispersions51. The value of AgNPs zeta potential was − 44.2 mV. The highly negative value of ζ proved that the synthesized AgNPs had high stability53. Since, in this study, the external stabilizers were not used, meaning that the plant phytochemicals acted not only as the reducing agents of the Ag+ to Ag0, but also stabilized the synthesized nanoparticles.

Size (a) and zeta potential value (b) of AgNPs prepared by R. discolor.
It is obvious that the particle size in the DLS analysis is larger than in the TEM test. The DLS measurement is carried out in a fluid phase. This means that the AgNPs particles are in constant movement because of Brownian motion. Also, AgNPs have a charge on their surfaces, and consequently, they can interact with other ions, molecules, and surfaces, which contributes to the creation of adsorbed layers on the surface of the nanoparticles14. Therefore, the DLS shows the hydrodynamic diameter of the biomolecules surrounding AgNPs and the intensity-weighted average particle size44. However, the TEM image is taken in a dry state. Thus, the results of DLS and TEM cannot be in line with each other, and the results of DLS showed a normally larger size than those of TEM14.
X‑Ray Diffraction Spectroscopy
The X-ray diffraction (XRD) pattern of AgNPs synthesized using aqueous extract of R. discolor is shown in Fig. 6. The peaks at 2 theta (θ) degrees of 38.1°, 44.2°, 64.5°, and 77.6° could be related to (111), (200), (220), and (311) facets, respectively, which corresponded to the database of the Joint Committee on Powder Diffraction Standards (JCPDS), file No. 00-004-0783. Debye–Scherrer formula (Eq. 2) was used to calculate the size of AgNPs, as follow:
where D is the average crystallin size of AgNPs, λ is the wavelength of X-ray which is 0.1546 nm, β is the width at half maximum of the peak in radians, and θ is Braggs angle in degrees54.Similar to previous studies, it shows that synthesized AgNPs are face-centered cubic. Additional peaks on the XRD spectrum could be correlated to the crystallization of the plant phytochemicals coating the AgNPs38,44. The average size of AgNPs was 18 nm, which complied with the result from TEM images. These findings were consistent with previous study by Said et al. that reported the formation of AgNPs by detecting diffraction peaks at 2θ degrees of 38.1°, 44.2°, 64.4°, and 77.2°, which are corresponded to the planes (111), (200), (220), and (311), respectively. Similarly, Yassin et al. reported AgNPs, with the face-centered cubic structure and diffraction peaks at 2θ degrees of 38.18◦, 44.36◦, 64.35◦, and 77.54◦, which are related to reflection planes of (111), (200), (220), (311), respectively8.

XRD pattern of green synthesized AgNPs.
FT-IR analysis
FT-IR analysis was performed to determine the structure of phytochemicals, exciting in aqueous leaves extract of R. discolor, which are responsible for surface coating and stabilization of the AgNPs. Figure 7 shows the IR spectra of the aqueous extract and the synthesized AgNPs.

FTIR spectra of (a) AgNPs and (b) extract.
The wavenumbers of different functional groups are summarized in Table 5. The characteristic peaks are determined by comparing peaks with the FT-IR results of other studies that have biosynthesized AgNPs using green methods.
By comparison the FT-IR spectra of AgNPs and the leaves aqueous extract, it was demonstrated that some peaks were shifted. Also, the intensity of some peaks reduced or increased, and the appearance of several new peaks changed significantly. For example, peaks at 3228, 1601, 1516, and 1380 cm−1, corresponding to O–H and N–H stretching vibrations, shifted to 3160, 1596, 1513, and 3151 cm−1, respectively. That could be due to some electrostatic interactions among the AgNPs and functional groups of capping agents. Moreover, in the FT-IR spectrum of AgNPs, the appearance of a peak at 1632 cm-1, as well as increasing the intensity of the peak at 1436 cm-1, which are attributed to carbonyl vibrations, designated that the reduction of the silver ions is due to the oxidation of the hydroxyl groups to the carbonyl groups in the plant extract. The reduced peak intensity at 3160 cm−1 revealed the important role of OH and N–H in the reduction and binding mechanism7. Finally, new peaks at 596 and 494 cm−1 may be attributed to the bonding of AgNPs with phytochemicals in the extract. Similar to our study, Said et al. reported peaks at 775 to 540 cm−1 which were correspondent to the bonding of AgNPs to functional groups in the extract16. Also, Aref et al. suggested that the peaks at 488 and 407 cm−1 may refer to the binding of AgNPs to phytochemical groups55. Moreover, Yassin et al. showed that the AgNPs synthesized by Origanum majorana had characteristic peaks for functional groups such as phenolic, amines, hydroxyl, and alkyl groups.
Suggested mechanism of formation of AgNPs
The plant extract contains various molecules such as polyphenols, terpene derivatives, saccharides, alkaloids, etc. These molecules are responsible for the reduction of AgNO3 to Ag0. The probable mechanism of AgNPs synthesis is depicted in Fig. 8. Generally, the functional groups such as hydroxyl (–OH) of these biomolecules interact with AgNO3. When AgNO3 dissolves in water, it dissociates into two ions, Ag+ and NO3−. The acidic nature of OH groups of phytochemicals resulted in donation of H+ ions and acquisition of a negative charge. The negative functional groups like O− of phenols interact electrostatically with Ag+. This process leads to the reduction of Ag+ ions. The NO3− ions accept H+ from phenolic OH resulted in the formation of HNO3. Ag remains in a free metallic state (Ag0) to form AgNPs50.

Suggested reduction mechanism of Ag+ to Ag0.
Antibacterial activity
Green synthesized AgNPs (at concentration of 1 mg ml−1) displayed significant antibacterial activity against ATCC gram-negative bacteria, including P. aeruginosa and E. coli, with inhibition zone of 18 and 16.5 mm, respectively. However, the AgNPs did not show any antibacterial activity against gram-positive pathogens (Fig. 9). The aqueous extract of R. discolor exhibited no antibacterial effect even in a high concentration (300 mg ml−1). Also, the best MIC value was for P. aeruginosa ATCC (0.83 mg ml−1) (Table 6).

The zones of inhibition formed by the AgNPs and R. discolor leaves extract against (a) B. subtilis, (b) S. aureus, (c) E. coli, (d) P. aeruginosa.
Also, the antibacterial activity was measured against MDR E. coli and P. aeruginosa isolated. Results of the antibiogram susceptibility test of eight antibiotics against ten isolates are depicted in Table 7.
Also, Fig. 10 describes the zone of inhibition (mm) for eleven antibiotics and AgNPs against isolate number 5 of MRD E. coli and P. aeruginosa. As is presented in Table 8, the AgNPs showed antibacterial activity against MDR E. coli with MIC values ranged from 1.87 to 3.75 mg ml−1. The MBCs were 5 mg ml−1 for all of the MDR E. coli isolates. Moreover, the MIC values against MDR P. aeruginosa isolated ranged from 0.93 to 1.87 mg ml−1, and the MBC values were 2.5–5 mg ml−1. The aqueous extract did not have any antibacterial activity against tested MDR isolates.

The zone of inhibition (mm) for eleven antibiotics (No. 1–11) and AgNPs (No. 12) against isolate number 5 of MRD E. coli and P. aeruginosa (E5 and P5).
AgNPs had ultra-small size and uniform distribution that led to significant antibacterial activity7. It is proposed that AgNPs release Ag+ that attach to the negative charge of the microbial cell wall, denaturing the membrane proteins. Also, AgNPs have potent affinity for the sulfur-containing proteins in the cell wall, leading to changes in the morphological structure of the cell membrane. This irreversible damage increases the permeability of the cell membrane, thereby disrupting the cell ability to regulate normal activity. This can lead to the loss or leakage of cellular contents such as, proteins, cytoplasm, ions, and cellular energy sources57. After crossing the cell membrane, AgNPs disturb the bacteria’s metabolic pathways. They cause several intracellular changes like enzyme inhibition, interaction with bacterial DNA resulting in denaturation of DNA, interruption of the bacteria growth, and inducing electrolyte imbalance7,15,47. Another mechanism of action is increasing oxidative stress by inducing overproduction of ROS (reactive oxygen species). ROS can oxidate macromolecules like lipids, DNA, and proteins and therefore, cause the bacterial death (Fig. 11).

The antibacterial mechanism of action of AgNPs.
Studies have been shown that AgNPs are more effective against gram-negative bacteria strains than gram-positive ones. The suggested reason is that the gram-positive bacteria consist of one cytoplasmic membrane and a relatively thick cell wall that include numerous peptidoglycan layers (thickness between 20 and 80 nm). In contrast, gram-negative strains, there is an external layer of lipopolysaccharide (LPS) as well as one thin layer of peptidoglycan and an internal plasma membrane58. Our results are in consistence with previous reports.
Cytotoxic assay
The anti-proliferative effects of silver NPs and the leaves aqueous extract were investigated against three human cancerous cell lines and a healthy cell line. The IC50 of AgNPs on selected cancerous cell lines ranged from 11.2 to 49.1 µg ml−1 (Fig. 12). The silver NPs exhibited more cytotoxic activities on MCF-7 and A431 cells than on HepG2 cells. Also, AgNPs showed more potent anti-proliferative activity than the aqueous extract on all cancerous cell line, particularly on HepG2 that the cytotoxicity of AgNPs was 2.5 times more than crude extract. Furthermore, the cytotoxic effect of AgNPs was investigated on HU02 (a noncancerous cell line). It was revealed that AgNPs had much less cytotoxic activity against the normal cell line (IC50 of 158 µg ml−1) in comparison with the extract.
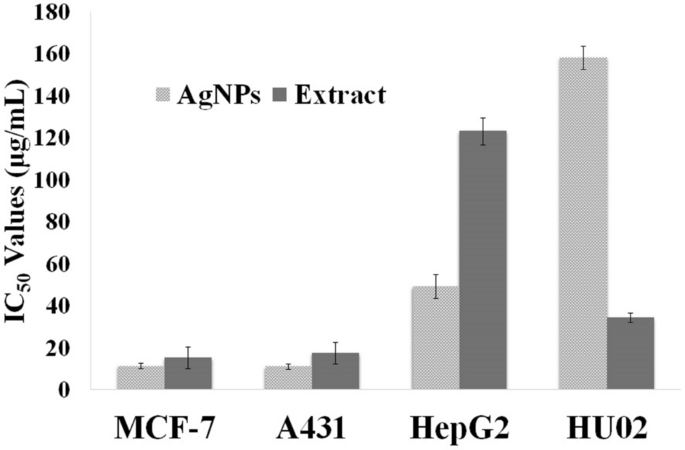
Cytotoxic activities (IC50 values) of AgNPs and R. discolor leaves extract against MCF-7, A431, HepG2, and HU02; The results are the mean ± SD.
Recently, AgNPs have attracted great attention for their possible use as an anticancer therapeutic agent because of their significant cytotoxic effect on cancerous cell lines, while they are less toxic on normal cell lines7,38. It is suggested that the Ag+, released from AgNPs, can directly bind to RNA polymerase, disturbing its activity. Another main proposed mechanism of cytotoxicity is the generation of ROS, which leads to intracellular oxidative stress and consequently cell death. It has been observed that the cytotoxicity of AgNPs is size-dependent. The smaller AgNPs can more easily penetrate the cell membrane and interact with different cell parts. Also, it has been reported that the AgNPs, with higher surface area, can sustainably release more concentration of silver cations38,59. It has been revealed that the green synthesized AgNPs can carry numerous plant secondary metabolites on their surface that enhance the effectiveness of AgNPs7,38. Table 9 summarizes the IC50 values of AgNPs prepared from several plant extracts against the same cancerous cell lines as our study. As is presented, the IC50 values of AgNPs synthesizes from leaves of R. discolor was in the range of previous studies. Also, AgNPs from R. discolor had stronger cytotoxic activities against MCF-7, and A431 compared to the AgNPs that are prepared from other mentioned plant extracts in Table 9.
Conclusion
In current study, the biosynthesized AgNPs were characterized using UV–Vis spectroscopy, FT-IR analysis, DLS, TEM, SEM–EDX, and XRD. All these characterizations confirmed the synthesis of AgNPs with average size of 37 nm. The results of the FTIR spectra showed that the phytochemicals present in R. discolor extract play a key role in the production of AgNPs. Phytochemical analysis showed that the leaves of R. discolor are a good source of phytochemicals, including phenolics, tannins, and flavonoids. Besides, having health-beneficial effects, these compounds have the ability to reduce silver ions, along with surface coating and stabilization of the AgNPs. The study also aimed to optimize the physical parameters and discover the interaction relations between variables affecting AgNPs biosynthesis, using RSM. The experimental results exhibited that all the factors studied were significant for the variable responses. The optimized condition was found to be an AgNO3 concentration of 7.11 mM, a time of 17.83 h, a temperature of 56.51 °C, and an extract percentage of 29.22, with a yield of 53.31%. Considering the surge in antibiotic resistance, the AgNPs prepared from R. discolor can be potentially used as an antibacterial agent against MDR E. coli and P. aeruginosa pathogens (MIC 0.93–3.75 mg ml−1). The AgNPs depicted significant cytotoxicity against A431, MCF7, and HepG2 (IC50 11.2–49.1 µg ml−1), while no significant toxicity against normal cell line was observed. This optimized, low-cost, and environmentally-friendly method is a valuable approach for producing bioactive silver NPs with high yield and small size.
Material and method
Materials
Mueller Hinton broth (MHB), Mueller Hinton Agar (MHA), Aluminum trichloride (AlCl3), silver nitrate (AgNO3), sodium bicarbonate (NaHCO3), 3-(4,5-dimethylthiazol-2-yl)-2,5-diphenyl-2H-tetrazolium bromide (MTT), and Folin–Ciocalteu’s reagent were obtained from Merk, Germany. Standard compounds, including gallic acid, tannic acid, and quercetin were bought from Sigma Chemical Company (USA). The MCF7, HePG2, and A431 cancerous cell lines were obtained from the Iranian Biological Resource Center (Iran). The normal cell line (Hu02) was purchased from the National Cell Bank of Pasteur Institute (Tehran, Iran). Dulbecco's Modified Eagle Medium (DMEM) was obtained from Gibco. The fetal bovine serum was got from Invitrogen. All other reagents and solvents used were of analytical grade.
Plant materials and extraction
The aerial parts of R. discolor were collected from Fuman-Saravan Road, Guilan province, in the North of Iran, in May 2021 (Fig. 13). The voucher specimen (113 HGUM) was kept in the herbarium of the faculty of pharmacy, Guilan University of Medical Sciences, Rasht, Iran. The plant's leaves were separated from the stems. Then, leaves were shade-dried at room temperature for two weeks and powdered with a mixer grinder. Consequently, 100 g of powder were added to 600 ml of deionized water (DW) and boiled for 15 min. After that, the mixture was cooled and filtered through the Whatman filter paper7. Lastly, the solvent was evaporated using a rotary vacuum evaporator (Heidolph, Germany) at 45 °C to obtain 4.1 g of dried extract. It was kept in the refrigerator at 4ºC until required.

Rubus discolor Weihe & Nees.
Preliminary phytochemical tests
The preliminary qualitative phytochemical assays were carried out to identify the presence of secondary metabolites in the extract, including flavonoids, tannins, anthraquinones, steroids, carbohydrates, coumarins, and alkaloids, using the standard protocols described by Saeidnia & Ghohari67.
Determination of total phenolic content (TPC)
The Folin-Ciocalteu method was used to measure the total phenolic contents in the extract and AgNPs68. In this test, 1 ml of each sample (1 mg ml−1) was added to 5 ml of freshly prepared Folin-Ciocalteu reagent (diluted tenfold with distilled water). Then, the mixtures were incubated for 10 min at room temperature before mixing with 4 ml sodium bicarbonate solution (75 g l−1). They were incubated for 30 min in the dark. Lastly, the absorbance was obtained at 765 nm using a UV/Vis spectrophotometer. All the experiments were repeated three times. The gallic acid (GA) was used as the reference standard in different concentrations (10, 25, 50, 100, and 150 µg ml−1), and the calibration curve was plotted. The total phenolic contents were expressed as mg of gallic acid equivalents (GAE)/g extract.
Determination of total flavonoid content (TFC)
The measurement of the flavonoid was carried out by the Dowd method67,68. First, aluminum trichloride (AlCl3) (2%) was prepared in methanol. Then, 5 ml of AlCl3 solution was added to 5 ml of each sample (2 mg ml−1). The mixtures were incubated for 10 min at room temperature. Finally, the absorbance was measured at 415 nm using a UV/Vis spectrophotometer7. All the experiments were repeated three times. The quercetin was used as the standard compound with five known concentrations (10, 25, 50, 75, and 100 µg ml−1). Finally, the total flavonoid content was expressed as mg of quercetin as equivalents (QE)/g of extract.
Determination of total tannin content (TTC)
The aqueous extract and synthesized AgNPs were examined for the total tannin contents by a colorimetric method using polyvinylpolypyrrolidone (PVPP)69,70,71. In this assay, PVPP binds to tannins and precipitates them. Different concentrations of tannic acid (20, 40, 60, 80, 100, 150, and 200 μg ml−1) were used for plotting the calibration curve. This method involved two steps. In the first step, 1 ml of each sample (1 mg ml−1) was combined with 0.5 ml Folin-Ciocalteu reagent (1 N). Next, sodium carbonate solution (2.5 ml, 20%) was added to each mixture. After 40 min, the absorbance was read at 725 nm. The amounts of total phenols as tannic acid equivalent (X) were calculated using the calibration curve. In the second step, the tannins were removed from tannin-containing samples by adding PVPP (100 mg of PVPP is adequate to bind 2 mg of total phenols). The samples were vigorously shaken (5 min) and kept at 4 °C (15 min). After that, the samples were centrifuged at 4000 g (20 min), and the supernatants were collected. The supernatant only contained simple phenols other than tannins. The phenolic contents of the supernatants were measured, as explained in the first step. The contents of non-tannin phenols (Y) were determined. Lastly, X–Y showed mg of tannin as tannic acid equivalent (TAE)/g extracts.
Green synthesis of AgNPs
In a typical reaction procedure, different amount of aqueous extract was added to five different concentrations of AgNO3 solution (50 ml, 1–10 mM), based on CCD described in the next section. The mixtures were stirred on a magnetic stirrer (Heidolph, Germany) at a constant rate (500 rpm) at different times and temperatures. Next, the mixtures were centrifuged for 15 min at 10,000 rpm using a centrifuge machine7. Finally, the sediments were washed three times with deionized water, and dried in a vacuum oven (45 °C). The yield of the AgNPs formation was calculated in optimized condition.
Experimental design and optimization of AgNPs synthesis by RSM
Previous studies showed that different parameters like concentration of extract and AgNO3, time, and temperature have great influence on the size and yield of synthesized AgNPs72. In this study, a central composite design (CCD) under Response Surface Methodology (RSM) was employed for the optimization of the most prominent parameters and also for the identification of their cooperative interactions using Design-Expert 7.0 (Stat-Ease, Inc., USA software). Four independent variables were selected, including reaction time (h), reaction temperature (°C), AgNO3 concentration, and percentage of extract (%). Each variable was evaluated at five coded levels (− 2, − 1, 0, 1, 2) (Table 10). The total experimental runs were calculated using the following equation: 2k + 2k+x0, where k is a variable number and x0 is the repetition number of experiments at the center point40.
Characterization of AgNPs
The color change from yellowish-green to dark brown was a confirmatory sign for NP formation. Consequently, small sample of the synthesized AgNPs was dispersed in the distilled water and the absorption was measured in the wavelength range of 200–800 nm using a UV–Vis spectrophotometer (PerkinElmer, USA). Distilled water was used as a blank8. FT-IR spectroscopy was performed to analyze the surface chemistry and the molecular vibrations of the synthesized AgNPs. The synthesized AgNPs and the extract were screened with a Spectrum Two FT-IR spectrometer with UATR accessory (PerkinElmer, USA) in 400–4000 cm−16,8. The TEM was used to determine the morphology (size and shape) of the AgNPs. The microphotographs were obtained using a Zeiss—EM10C—100 kV instrument (Germany). In order to confirm the surface morphology and elemental composition of green-synthesized AgNPs, SEM–EDX instrument was used. A MIRA3 FE-SEM from TESCAN was employed to get SEM images49. The preparation of the sample was performed by following and abiding by the manufacturer’s instructions. The size distribution and ζ-potential of NPs was measured by a DLS and Zeta potential analyzer (Nanopartica SZ-100; HORIBA Ltd, Kyoto, Japan). The obtained spectrum provides the hydrodynamic size, distribution, and PDI. For determining the crystalline structure, XRD analysis was carried out using the Bruker AXS model D8 Advance powder X-ray diffractometer ranging from 5° to 80°7.
Antibacterial assay
For investigation of the antibacterial activity of AgNPs and plant extract, two gram-positive (Staphylococcus aureus ATCC 6538, Bacillus subtilis ATCC 9634) and two gram-negative (Escherichia coli ATCC 8739, and Pseudomonas aeruginosa ATCC 9027) bacteria were used. In addition, 10 MDR E. coli and P. aeruginosa isolates, resistant to 8 antibiotics (Gentamicin, Trimethoprim-Sulfamethoxazole, Ceftazidime, Ampicillin, Amikacin, Cefepime, Ceftriaxone, and Ciprofloxacin), obtained from the 17 Shahrivar Children’s Hospital (Rasht, Iran), were used for further investigation of antibacterial properties of AgNPs73. The zone of inhibition was measured by the disc diffusion method. Also, minimum inhibitory concentration (MIC) and minimum bactericidal concentration (MBC) were measured by the broth microdilution method using 96 U-shaped well plates74.
Bacterial cultures of all bacteria were grown for 24 h in nutrient broth. In agar disc diffusion test, the petri dishes, containing 25 ml of Mueller Hinton Agar (MHA) were used. The agar plates were swabbed with broth cultures standardized with 0.5 McFarland standard solution (1.5 × 10⁸ CFU ml−1) of each strain. The sterile discs were located in the agar, and each sample (10 μl) was placed on each disc. The plates were incubated at 37 °C for 48 h. Lastly, the plates were evaluated for the inhibition zones (mm)75. All experiments were conducted in triplicate.
For the MIC assay, a stock solution from each sample was prepared in distilled water. Then, a doubling dilution of each sample’s stock solution (100 μl) was prepared in wells using Mueller Hinton broth (MHB). The serial dilutions of samples (extract: 150–0.84 mg ml−1, and AgNPs: 10–0.005 mg ml−1) were prepared in microplates. Each bacteria inoculum (1.5 × 10⁸ CFU ml−1) was diluted in 0.9% saline to give 107 CFU ml−1. The plates were spot-inoculated with 100 μl of each prepared bacterial suspension (105 CFU/spot). The bacteria were incubated at 37 °C for 48 h. The plates were tested for the absence or presence of visible growth compared to the negative control wells. The endpoint of MIC was the lowest concentration of the compounds in which there was no visible growth75,76. The MBC values were determined by culturing 100 μl of no-growth wells in Petri dishes, contained MHA and incubating at 37 °C for 24 h. The MBCs were reported as the lowest concentration that killed 99.9% of bacterial cells73.
Cytotoxicity assay
Biosynthesized AgNPs and aqueous extract of R. discolor were evaluated for anti-proliferative activities at different concentrations in MCF-7, A431, and HU02 cell lines using the MTT assay. Cell lines were cultured in Dulbecco’s Modified Eagles Medium (DMEM). For this reason, 5 × 10³ cells per well were seeded in a 96-well plate in complete DMEM and incubated at 37 °C for 24 h in a humidified atmosphere, containing 5% CO2. Next, non-adherent cells were removed, and adherent cells were treated with the following concentrations of samples (prepared by serial dilution): 1000, 500, 250, 125, 62.5, 31.2, 15.6, 7.8, and 3.9 μg ml−1. The samples were incubated for 48 h. Next, the MTT solution (20 µl, 5 mg ml−1 in PBS) and DMEM (180 µl) were added to seeded cells and incubated for 4 h. Then, the supernatants were removed. For dissolving formazan crystals, DMSO (150 µl) was added to each well and shaken for 10 min75,77. The optical density (OD) was read at 490 nm using an absorbance microplate reader (BioTek) (the reference wavelength was 630 nm). Each test was repeated three times. The percentage of viable cells was calculated using the following equation:
IC50 of samples (the concentration in which 50% of cells were alive) was calculated using GraphPad Prism (Version 8, GraphPad Software, USA)77,78.
Statistical analysis
Every experiment was carried out in triplicates. All the results are expressed as mean ± standard deviation (SD). The calculation of IC50 values (the concentration required for 50% inhibitory activity) was made by nonlinear regression with the normalized fitted dose–response curve (GraphPad Prism Software., version 5, Inc. San Diego, USA)77.
Ethics approval and consent to participate
This study was approved by the Ethical Committee of Guilan University of Medical Sciences (IR.GUMS.REC.1400.093). The collection and use of plant material complies with relevant institutional and national guideline and regulations of plant protection.
Data availability
The datasets used and/or analyzed during the current study are available from the corresponding author upon reasonable request.
References
Vanin dos Santos Lima, M. et al. Green synthesis of silver nanoparticles using Ilex paraguariensis extracts: Antimicrobial activity and acetilcolinesterase modulation in rat brain tissue. Green Chem. Lett. Rev. 15(1), 128–138 (2022).
Alharbi, N. S., Alsubhi, N. S. & Felimban, A. I. Green synthesis of silver nanoparticles using medicinal plants: Characterization and application. J. Radiat. Res. Appl. Sci. 15(3), 109–124 (2022).
Salem, S. S. & Fouda, A. Green synthesis of metallic nanoparticles and their prospective biotechnological applications: An overview. Biol. Trace Elem. Res. 199(1), 344–370 (2021).
Salem, S. S. A mini review on green nanotechnology and its development in biological effects. Arch. Microbiol. 205(4), 128 (2023).
Salem, S. S., Hammad, E. N., Mohamed, A. A. & El-Dougdoug, W. A comprehensive review of nanomaterials: Types, synthesis, characterization, and applications. Biointerface Res. Appl. Chem. 13(1), 41 (2022).
Hawar, S. N. et al. Green synthesis of silver nanoparticles from Alhagi graecorum leaf extract and evaluation of their cytotoxicity and antifungal activity. J. Nanomater. 2022, 1–8 (2022).
Yousefbeyk, F. et al. Green synthesis of silver nanoparticles from Stachys byzantina K. Koch: Characterization, antioxidant, antibacterial, and cytotoxic activity. Part. Sci. Technol. 40(2), 219–232 (2022).
Yassin, M. T., Mostafa, A.A.-F., Al-Askar, A. A. & Al-Otibi, F. O. Facile green synthesis of silver nanoparticles using aqueous leaf extract of Origanum majorana with potential bioactivity against multidrug resistant bacterial strains. Crystals 12(5), 603 (2022).
Mustapha, T., Misni, N., Ithnin, N. R., Daskum, A. M. & Unyah, N. Z. A review on plants and microorganisms mediated synthesis of silver nanoparticles, role of plants metabolites and applications. Int. J. Environ. Res. Public Health 19(2), 674 (2022).
Ahmed, H. M., El-khateeb, M. A., Sobhy, N. A., Hefny, M. M. & Abdel-Haleem, F. M. Green synthesis of magnetite nanoparticles using waste natural materials and its application for wastewater treatment. Environ. Sci. Proc. 25(1), 99 (2023).
Hashemi, Z., Mizwari, Z. M., Mohammadi-Aghdam, S., Mortazavi-Derazkola, S. & Ebrahimzadeh, M. A. Sustainable green synthesis of silver nanoparticles using Sambucus ebulus phenolic extract (AgNPs@ SEE): Optimization and assessment of photocatalytic degradation of methyl orange and their in vitro antibacterial and anticancer activity. Arab. J. Chem. 15(1), 103525 (2022).
Habeeb rahuman, H. B. et al. Medicinal plants mediated the green synthesis of silver nanoparticles and their biomedical applications. IET Nanobiotechnol. 16(4), 115–144 (2022).
Dua, T. K. et al. Green synthesis of silver nanoparticles using Eupatorium adenophorum leaf extract: Characterizations, antioxidant, antibacterial and photocatalytic activities. Chem. Pap. https://doi.org/10.1007/s11696-023-02676-9 (2023).
Rizwana, H., Alwhibi, M. S., Al-Judaie, R. A., Aldehaish, H. A. & Alsaggabi, N. S. Sunlight-mediated green synthesis of silver nanoparticles using the berries of Ribes rubrum (Red Currants): Characterisation and evaluation of their antifungal and antibacterial activities. Molecules 27(7), 2186 (2022).
Khan, M. et al. Green synthesis of silver nanoparticles using Juniperus procera extract: Their characterization, and biological activity. Crystals 12(3), 420 (2022).
Said, A., Abu-Elghait, M., Atta, H. M. & Salem, S. S. Antibacterial activity of green synthesized silver nanoparticles using Lawsonia inermis against common pathogens from urinary tract infection. Appl. Biochem. Biotechnol. 196(1), 85–98 (2024).
Salem, S. S., Ali, O. M., Reyad, A. M., Abd-Elsalam, K. A. & Hashem, A. H. Pseudomonas indica-mediated silver nanoparticles: Antifungal and antioxidant biogenic tool for suppressing Mucormycosis fungi. J. Fungi 8(2), 126 (2022).
Salem, S. S. Baker’s yeast-mediated silver nanoparticles: Characterisation and antimicrobial biogenic tool for suppressing pathogenic microbes. BioNanoScience 12(4), 1220–1229 (2022).
Soliman, M. K. Y., Salem, S. S., Abu-Elghait, M. & Azab, M. S. Biosynthesis of silver and gold nanoparticles and their efficacy towards antibacterial, antibiofilm, cytotoxicity, and antioxidant activities. Appl. Biochem. Biotechnol. 195(2), 1158–1183 (2023).
Priya, S., Murali, A., Preeth, D. R., Dharanibalaji, K. C. & Jeyajothi, G. Green synthesis of silver nanoparticle-embedded poly(methyl methacrylate-co-methacrylic acid) copolymer for fungal-free leathers. Polym. Bull. 79(7), 4607–4626 (2022).
Talank, N. et al. Bioengineering of green-synthesized silver nanoparticles: In vitro physicochemical, antibacterial, biofilm inhibitory, anticoagulant, and antioxidant performance. Talanta 243, 123374 (2022).
Cui, X., Lü, Y. & Yue, C. Development and research progress of anti-drug resistant bacteria drugs. Infect. Drug Res. 14, 5575–5593 (2021).
Mortezagholi, B. et al. Plant-mediated synthesis of silver-doped zinc oxide nanoparticles and evaluation of their antimicrobial activity against bacteria cause tooth decay. Microsc. Res. Tech. 85(11), 3553–3564 (2022).
Widatalla, H. A. et al. Green synthesis of silver nanoparticles using green tea leaf extract, characterization and evaluation of antimicrobial activity. Nanoscale Adv. 4(3), 911–915 (2022).
Al-Rajhi, A. M. H., Salem, S. S., Alharbi, A. A. & Abdelghany, T. M. Ecofriendly synthesis of silver nanoparticles using Kei-apple (Dovyalis caffra) fruit and their efficacy against cancer cells and clinical pathogenic microorganisms. Arab. J. Chem. 15(7), 103927 (2022).
Soliman, M. K. Y., Abu-Elghait, M., Salem, S. S. & Azab, M. S. Multifunctional properties of silver and gold nanoparticles synthesis by Fusarium pseudonygamai. Biomass Convers. Biorefinery https://doi.org/10.1007/s13399-022-03507-9 (2022).
Elakraa, A. A., Salem, S. S., El-Sayyad, G. S. & Attia, M. S. Cefotaxime incorporated bimetallic silver-selenium nanoparticles: Promising antimicrobial synergism, antibiofilm activity, and bacterial membrane leakage reaction mechanism. RSC Adv. 12(41), 26603–26619 (2022).
Nagai, H. & Kim, Y. H. Cancer prevention from the perspective of global cancer burden patterns. J. Thorac. Dis. 9(3), 448 (2017).
Ovais, M. et al. Green synthesis of silver nanoparticles via plant extracts: Beginning a new era in cancer theranostics. Nanomedicine 12(23), 3157–3177 (2016).
Robinson, J. A., Bierwirth, J. E., Greenspan, P. & Pegg, R. B. Blackberry polyphenols: Review of composition, quantity, and health impacts from in vitro and in vivo studies. J. Food Bioact. https://doi.org/10.31665/JFB.2020.9217 (2020).
Lee, J., Dossett, M. & Finn, C. E. Rubus fruit phenolic research: The good, the bad, and the confusing. Food Chem. 130(4), 785–796 (2012).
Zhang, S. et al. Comparative study of three raspberry cultivar (Rubus idaeus L.) leaves metabolites: Metabolome profiling and antioxidant activities. Appl. Sci. 12(3), 990 (2022).
Oszmiański, J. et al. Determination of phenolic compounds and antioxidant activity in leaves from wild Rubus L. species. Molecules 20(3), 4951–4966 (2015).
Kasalkheh, R., Jorjani, E., Sabouri, H., Habibi, M. & Sattarian, A. Chromosome numbers and karyotypes of four species Rubus L. from North of Iran. J. Genet. Resour. 5(1), 59–64 (2019).
Caplan, J. S. & Yeakley, J. A. Rubus armeniacus (Himalayan blackberry) occurrence and growth in relation to soil and light conditions in western oregon. Northwest Sci. 80(1), 9 (2006).
Sedighi, E. & Rahimmalek, M. Evaluation of genetic diversity of Rubus hyrcanus using inter simple sequence repeat (ISSR) and morphological markers. Biologia 70, 339–348 (2015).
Nunes, A. R., Goncalves, A. C., Falcao, A., Alves, G. & Silva, L. R. Prunus avium L. (Sweet Cherry) by-products: A source of phenolic compounds with antioxidant and anti-hyperglycemic properties—A review. Appl. Sci. 11(18), 8516 (2021).
Jalilian, F., Chahardoli, A., Sadrjavadi, K., Fattahi, A. & Shokoohinia, Y. Green synthesized silver nanoparticle from Allium ampeloprasum aqueous extract: Characterization, antioxidant activities, antibacterial and cytotoxicity effects. Adv. Powder Technol. 31(3), 1323–1332 (2020).
Vitta, Y., Figueroa, M., Calderon, M. & Ciangherotti, C. Synthesis of iron nanoparticles from aqueous extract of Eucalyptus robusta Sm and evaluation of antioxidant and antimicrobial activity. Mater. Sci. Energy Technol. 3, 97–103 (2020).
Othman, A. M., Elsayed, M. A., Elshafei, A. M. & Hassan, M. M. Application of response surface methodology to optimize the extracellular fungal mediated nanosilver green synthesis. J. Genet. Eng. Biotechnol. 15(2), 497–504 (2017).
El-Rafie, M., Shaheen, T. I., Mohamed, A. & Hebeish, A. Bio-synthesis and applications of silver nanoparticles onto cotton fabrics. Carbohydr. Polym. 90(2), 915–920 (2012).
Nikaeen, G., Yousefinejad, S., Rahmdel, S., Samari, F. & Mahdavinia, S. Central composite design for optimizing the biosynthesis of silver nanoparticles using plantago major extract and investigating antibacterial, antifungal and antioxidant activity. Sci. Rep. 10(1), 9642 (2020).
Khammar, Z. et al. Optimization of biosynthesis of stabilized silver nanoparticles using bitter orange peel by-products and glycerol. Biocatal. Agric. Biotechnol. 43, 102425 (2022).
Yousefbeyk, F. et al. Phytochemical analysis and antioxidant activity of eight cultivars of tea (Camellia sinensis) and rapid discrimination with FTIR spectroscopy and pattern recognition techniques. Pharm. Sci. 29(1), 100–110 (2022).
Palithya, S. et al. Green synthesis of silver nanoparticles using flower extracts of Aerva lanata and their biomedical applications. Part. Sci. Technol. 40(1), 84–96 (2022).
Patra, J. K., Das, G. & Shin, H.-S. Facile green biosynthesis of silver nanoparticles using Pisum sativum L. outer peel aqueous extract and its antidiabetic, cytotoxicity, antioxidant, and antibacterial activity. Int. J. Nanomed. 14, 6679–6690 (2019).
Barabadi, H. et al. Green synthesis, characterization, antibacterial and biofilm inhibitory activity of silver nanoparticles compared to commercial silver nanoparticles. Inorg. Chem. Commun. 129, 108647 (2021).
Mariadoss, A. V. A. et al. Green synthesis, characterization and antibacterial activity of silver nanoparticles by Malus domestica and its cytotoxic effect on (MCF-7) cell line. Microb. Pathog. 135, 103609 (2019).
Kaviya, S., Santhanalakshmi, J., Viswanathan, B., Muthumary, J. & Srinivasan, K. Biosynthesis of silver nanoparticles using Citrus sinensis peel extract and its antibacterial activity. Spectrochim. Acta Part A Mol. Biomol. Spectrosc. 79(3), 594–598 (2011).
Okaiyeto, K., Ojemaye, M. O., Hoppe, H., Mabinya, L. V. & Okoh, A. I. Phytofabrication of silver/silver chloride nanoparticles using aqueous leaf extract of Oedera genistifolia: Characterization and antibacterial potential. Molecules 24(23), 4382 (2019).
Badeggi, U. M. et al. Characterization and toxicity of hypoxoside capped silver nanoparticles. Plants 11(8), 1037 (2022).
Khane, Y. et al. Green synthesis of silver nanoparticles using aqueous Citrus limon zest extract: Characterization and evaluation of their antioxidant and antimicrobial properties. Nanomaterials 12(12), 2013 (2022).
Kokila, T., Ramesh, P. S. & Geetha, D. Biosynthesis of AgNPs using Carica papaya peel extract and evaluation of its antioxidant and antimicrobial activities. Ecotoxicol. Environ. Saf. 134, 467–473 (2016).
Gecer, E. N., Erenler, R., Temiz, C., Genc, N. & Yildiz, I. Green synthesis of silver nanoparticles from Echinacea purpurea (L.) Moench with antioxidant profile. Part. Sci. Technol. 40(1), 50–57 (2022).
Aref, M. S. & Salem, S. S. Bio-callus synthesis of silver nanoparticles, characterization, and antibacterial activities via Cinnamomum camphora callus culture. Biocatal. Agric. Biotechnol. 27, 101689 (2020).
Abdel-Raouf, N., Al-Enazi, N. M., Ibraheem, I. B. M., Alharbi, R. M. & Alkhulaifi, M. M. Biosynthesis of silver nanoparticles by using of the marine brown alga Padina pavonia and their characterization. Saudi J. Biol. Sci. 26(6), 1207–1215 (2019).
Salleh, A. et al. The potential of silver nanoparticles for antiviral and antibacterial applications: A mechanism of action. Nanomaterials 10(8), 1566 (2020).
Liao, C., Li, Y. & Tjong, S. C. Bactericidal and cytotoxic properties of silver nanoparticles. Int. J. Mol. Sci. 20(2), 449 (2019).
Qing, Y. A. et al. Potential antibacterial mechanism of silver nanoparticles and the optimization of orthopedic implants by advanced modification technologies. Int. J. Nanomed. 13, 3311–3327 (2018).
Usmani, A., Mishra, A., Jafri, A., Arshad, M. & Siddiqui, M. A. Green synthesis of silver nanocomposites of Nigella sativa seeds extract for hepatocellular carcinoma. Curr. Nanomater. 4(3), 191–200 (2019).
Gajendran, B. et al. Green synthesis of silver nanoparticle from Datura inoxia flower extract and its cytotoxic activity. BioNanoScience 9(3), 564–572 (2019).
Vivek, R. et al. Green biosynthesis of silver nanoparticles from Annona squamosa leaf extract and its in vitro cytotoxic effect on MCF-7 cells. Process Biochem. 47(12), 2405–2410 (2012).
Saratale, R. G. et al. Exploiting antidiabetic activity of silver nanoparticles synthesized using Punica granatum leaves and anticancer potential against human liver cancer cells (HepG2). Artif. Cells Nanomed. Biotechnol. 46(1), 211–222 (2018).
Nayak, D., Pradhan, S., Ashe, S., Rauta, P. R. & Nayak, B. Biologically synthesised silver nanoparticles from three diverse family of plant extracts and their anticancer activity against epidermoid A431 carcinoma. J. Colloid Interface Sci. 457, 329–338 (2015).
Pathak, M.et al. Green Synthesis of Silver Nanoparticles Using Scindapsus officinalis (Gajpipli): In-Vitro Cytotoxic Activity Against HepG-2 & MCF-7 Cancer Cell Lines. Preprints: Preprints; 2019.
Huo, Y. et al. Biological synthesis of gold and silver chloride nanoparticles by Glycyrrhiza uralensis and in vitro applications. Artif. Cells Nanomed. Biotechnol. 46(2), 303–312 (2018).
Saeidnia, S. & Gohari, A. R. Pharmacognosy and Molecular Pharmacognosy in Practice: A Laboratory Desk Reference of Pharmacognosy for Researchers and Students (LAP Lambert Academic Publishing, 2012).
Yousfbeyk, F.et al. Antioxidant activity, total phenol and total anthocyanin contents of Cornus sanguinea L. subsp. australis. (CA Mey.) Jáv. (2014).
FOOD, O. N. T. I. Quantification of Tannins in Tree Foliage (2000).
Manayi, A. et al. Biological activity and microscopic characterization of Lythrum salicaria L. DARU J. Pharm. Sci. 21, 1–7 (2013).
Saeidnia, S., Nikan, M., Mirnezami, T., Gohari, A. R. & Manayi, A. Micromorphological characterizations and phytochemicals contents of some Phlomis species from Iran. Int. J. Pharm. Pharm. Sci. 8(1), 157–161 (2015).
Sarkar, M., Denrah, S., Das, M. & Das, M. Statistical optimization of bio-mediated silver nanoparticles synthesis for use in catalytic degradation of some azo dyes. Chem. Phys. Impact 3, 100053 (2021).
Nemattalab, M., Rohani, M., Evazalipour, M. & Hesari, Z. Formulation of Cinnamon (Cinnamomum verum) oil loaded solid lipid nanoparticles and evaluation of its antibacterial activity against multi-drug resistant Escherichia coli. BMC Complement. Med. Ther. 22(1), 289 (2022).
Kiehlbauch, J. A. et al. Use of the National Committee for Clinical Laboratory Standards guidelines for disk diffusion susceptibility testing in New York state laboratories. J. Clin. Microbiol. 38(9), 3341–3348 (2000).
Yousefbeyk, F. et al. Phytochemical analysis, antioxidant, antibacterial, and cytotoxic activities of leaves and roots of Rubus hyrcanus Juz. Eur. Food Res. Technol. 248(1), 141–152 (2022).
Yousefbeyk, F. et al. Chemical composition and antimicrobial activity of essential oils from different parts of Daucus littoralis Smith subsp. hyrcanicus Rech. f. J. Essent. Oil Bear. Plants 17(4), 570–576 (2014).
Azmian Moghadam, F., Kefayati, H., Evazalipour, M. & Ghasemi, S. Design, synthesis, biological evaluation, and docking study of novel 4-anilinoquinazolines derivatives as anticancer agents. Iran. J. Chem. Chem. Eng. 41(2), 353–367 (2022).
Moghadam, F. A., Evazalipour, M., Kefayati, H. & Ghasemi, S. 6, 7-disubstituted-4-anilinoquinazoline: Design, synthesis and anticancer activity as a novel series of potent anticancer agents. Pharm. Sci. 27(2), 209–218 (2020).
Acknowledgements
This work was supported by Guilan University of Medical Sciences (99121804).
Funding
This work was supported by Guilan University of Medical Sciences (Grant Number 99121804).
Author information
Authors and Affiliations
Contributions
S.G. and F.Y. supervised the study process and participated in the research design and formal analysis, S.D., F.K., D.E.K, and M.N., participated in the performance of research and data acquisition, S.M., and E.Z. contributed to data collection. F.Y. wrote original draft. All authors reviewed the manuscript and agreed to the published version of the manuscript.
Corresponding author
Ethics declarations
Competing interests
The authors declare no competing interests.
Additional information
Publisher's note
Springer Nature remains neutral with regard to jurisdictional claims in published maps and institutional affiliations.
Rights and permissions
Open Access This article is licensed under a Creative Commons Attribution 4.0 International License, which permits use, sharing, adaptation, distribution and reproduction in any medium or format, as long as you give appropriate credit to the original author(s) and the source, provide a link to the Creative Commons licence, and indicate if changes were made. The images or other third party material in this article are included in the article's Creative Commons licence, unless indicated otherwise in a credit line to the material. If material is not included in the article's Creative Commons licence and your intended use is not permitted by statutory regulation or exceeds the permitted use, you will need to obtain permission directly from the copyright holder. To view a copy of this licence, visit http://creativecommons.org/licenses/by/4.0/.
About this article

Cite this article
Ghasemi, S., Dabirian, S., Kariminejad, F. et al. Process optimization for green synthesis of silver nanoparticles using Rubus discolor leaves extract and its biological activities against multi-drug resistant bacteria and cancer cells. Sci Rep 14, 4130 (2024). https://doi.org/10.1038/s41598-024-54702-9
Received:
Accepted:
Published:
DOI: https://doi.org/10.1038/s41598-024-54702-9
Keywords
This article is cited by
Comments
By submitting a comment you agree to abide by our Terms and Community Guidelines. If you find something abusive or that does not comply with our terms or guidelines please flag it as inappropriate.
