 Figure 1


« Prev Next »
The fugu is a famous fish, at least when it comes to sushi, because it contains a neurotoxin that is potentially lethal to those who consume it. Because the fugu is a member of the pufferfish group, it also has another claim to fame: Like all pufferfish, the fugu has an extremely small genome, roughly one tenth the size of that of other vertebrates.
Genomes of several species of pufferfish are currently being sequenced. Indeed, scientists have just completed the draft sequence for Tetraodon nigroviridis, also known as the green spotted pufferfish. This sequence reveals that Tetraodon has about the same number of genes as humans (between 20,000 and 25,000); however, the total length of the Tetraodon genome is only about 340 megabases, as compared to our huge 3.1 gigabases. What explains this drastic difference? One major reason that the pufferfish genome is so much shorter than the human genome is that, in Tetraodon, transposable elements are rare. Specifically, pufferfish have 73 types of transposable elements present in fewer than 4,000 copies, whereas humans have about 20 different types present in millions of copies. Transposable elements may be reverse transcriptases that blindly copy RNA sequences back into DNA (called LINES) or shorter sequences that are processed by LINES (called SINES). In any case, transposable elements are generally considered to be parasitic bits of "selfish" DNA, and somehow, pufferfish seem to be largely free of them.
But what does this difference mean to the human and pufferfish species? And what more can be learned by comparing the genomes of these two vastly different organisms? It turns out that a comparison of the human and pufferfish genetic sequences holds several clues as to the evolution of modern vertebrates.
Using Synteny to Compare Genomes
One interesting thing researchers can do with a pair of genome sequences is to start mapping synteny. Classical genetics says that syntenic genes are those that lie on the same chromosome. In the sense of genome comparison, synteny represents the preservation of small regions of order within a chromosome. Thus, although the overall organization of a chromosome may have been scrambled by millions of years of breaks, fusions, duplications, and deletions, scientists can learn about the history of the chromosome by identifying smaller blocks that maintain the same series of genes within them. For example, say researchers look at a chromosome from one organism and see the series of genes A-B-C-D-E-F. Next, they examine a chromosome from a second organism and notice that it contains the genes W-X-C-D-E-Y-Z. Here, the researchers can map the C-D-E chunk from the first organism's chromosome directly to the corresponding region of the second organism's chromosome.
Color Coding Syntenic Regions
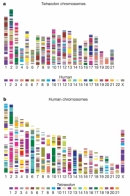
A helpful way to diagram this is to color code all the syntenic regions from each chromosome in one organism and then see how those regions are distributed in the second organism. For instance, in Figure 1a, human chromosome 15 has been colored yellow. (The key along the bottom of the diagram tells you how each human chromosome has been coded.) Then, in the top part of the figure, each synteny with chromosome 15 in the Tetraodon genome has also been colored yellow. This process has been repeated for each of the other human chromosomes as well.
To better understand how this works, imagine that human chromosome 15, along with all the other human chromosomes, has been colored and broken apart, and all the pieces have been reassembled into the Tetraodon genome. The use of color allows researchers to see where each chromosome fragment came from. For instance, Figure 1a shows that large pieces of human chromosome 15 are found in Tetraodon chromosomes 5 and 13. Of course, scientists can also conduct this process in the other direction, taking all of the Tetraodon chromosomes, color coding them, breaking them apart, and reassembling them into the order they would be in the human genome, as illustrated in Figure 1b.
What Synteny Reveals
What the scattered colors in these diagrams actually reveal is a rendering of the history of chromosome reorganization that occurred during evolution. Even after hundreds of millions of years of juggling, the order of these two sets of chromosomes is still not completely randomized, as there are still recognizably preserved blocks of local structure.
Of course, don't be misled by these synteny diagrams into thinking that the evolution of these species involved the reorganization of the human genomic sequence into the Tetraodon pattern, or vice versa. Rather, the two organisms had a common ancestor with some arrangement of genes on its chromosomes. As humans evolved from this ancestor, the chromosomes got broken apart and rearranged over time. Meanwhile, the same process of breakage and scrambling was independently occurring in the Tetraodon lineage.
Blocks of Repeating Synteny Reveal Duplication of Tetraodon Genome
Here's something else researchers can learn from synteny. Looking more closely at the map in Figure 2 reveals a curious pattern: Some of the Tetraodon chromosomes can be mapped in an alternating or interleaved arrangement on the human chromosomes. For instance, look at human chromosome 16 (Hsa16). Blocks of genes from Tetraodon chromosome 5 (Tni5) and Tetraodon chromosome 13 (Tni13) are both found in a larger syntenic region here, and this defies probability. If chromosome reorganizations were random, we shouldn't see Tni5 and Tni13 alternating exclusively, nor should we see other such associations throughout the human genome (e.g., Tni1 and Tni7 alternating on HsaX).
Why, then, are Tni5 and Tni13 found together, and Tni1 and Tni7, and so forth? The simplest answer is that there was a whole-genome duplication at some point in the Tetraodon lineage. To better understand what this means, let's focus on the aforementioned section of Hsa16. In the last common ancestor of humans and Tetraodon, there must have been a single chromosome that mapped onto this region of Hsa16. After Tetraodon diverged, that chromosome must have been duplicated, forming Tni5 and Tni13; over time, many of the duplicated genes were secondarily lost, but the copy that was lost (i.e., the one on Tni5 or the one on Tni13) was random.
Thus, these regions of doubly conserved synteny (DCS), in which pairs of Tetraodon chromosomes are clustered together in lockstep with a region of a human chromosome, represent ghosts of a single ancestral chromosome. In Figure 2, those hypothetical ancestral chromosomes have been outlined and colored in the pastel shades surrounding the interleaved regions, and they have been given the names AncA, AncB, AncC, etc. Note that there are 110 of these DCS blocks scattered throughout the human genome, and they can be grouped into 12 ancestral chromosomes. Indeed, it is possible to reorder these ancestral syntenic fragments into their simplest arrangement, thereby recreating the ancestral genome (Figure 3).
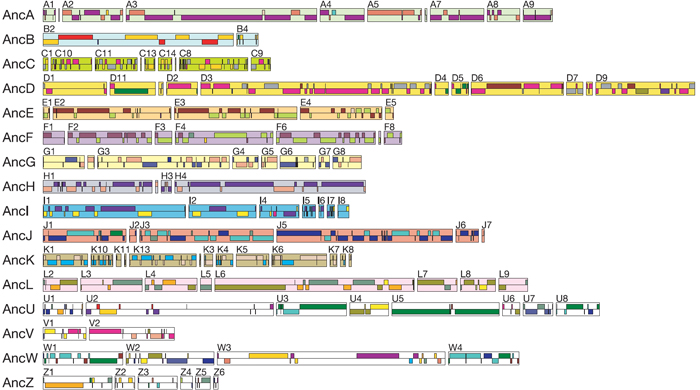
Figure 3: Composition of the ancestral osteichthyan genome.
The 110 DCS blocks identified on the human genome are grouped according to their composition in terms of Tetraodon chromosomes, thus delineating 12 ancestral chromosomes containing 90 DCS blocks. The order of DCS within an ancestral chromosome is arbitrary. The 20 blocks denoted by the letters U, V, W and Z could not be assigned to an ancestral chromosome because each has a unique composition, probably due to rearrangements in the human or Tetraodon genome.
© 2004 Nature Publishing Group Jaillon, O. et al. Genome duplication in the teleost fish Tetraodon nigroviridis reveals the early vertebrate proto-karyotype. Nature 431, 953 (2004). All rights reserved. 
Using Synteny to Understand the Evolution of Vertebrates
This use of genomic evidence and logic to identify the long-lost chromosomes of a 350-million-year-old organism provides valuable insight into evolutionary pathways. Figure 4 provides an example of the use of comparative genomics in this context. This diagram depicts how the descendants of an ancestral bony fish with 12 chromosomes split into two lineages, one of which gave rise to human beings (on the left side of the diagram), and the other which gave rise to Tetraodon (on the right side of the diagram). As depicted in Figure 4, the human lineage was marked by a period of intense amplification of transposable elements, and this amplification led to our current grossly bloated genome, which contains 20,000 to 25,000 genes swimming in 3 gigabases of mostly useless DNA. Meanwhile, the Tetraodon lineage went through a whole-genome duplication (WGD), followed by a thorough pruning back of many of the excess copies, leaving these fish with a similar 20,000 to 25,000 genes. In the Tetraodon lineage, however, there was no amplification of junk, so these fishes' protein-coding genes reside in a lean 340 megabases.
Interestingly, the remarkable preservation of the Tetraodon genome after WGD makes it possible to infer the history of vertebrate chromosome evolution. This model suggests that the ancestral vertebrate genome was composed of 12 chromosomes, was compact, and contained nearly as many genes as the genomes of modern vertebrates (insofar as the WGD and subsequent massive gene loss resulted in only a tiny fraction of duplicate genes being retained). The explosion of transposable elements in the mammalian lineage, subsequent to divergence from the ancestral lineage, may have provided the conditions for increased interchromosomal rearrangements in mammals. In contrast, the Tetraodon genome underwent much less interchromosomal rearrangement.
In the near future, with the availability of additional vertebrate genomes (sequencing of the dog, marsupial, chicken, medaka, zebrafish, and frog genomes is currently underway), it will be possible to explore intermediate nodes in the evolutionary tree, as well as to gain an increasingly clearer picture of the early vertebrate ancestor species. Moreover, because the early vertebrate genome is "closer" to that of modern invertebrates than that of modern vertebrates, this should in turn facilitate comparison between vertebrate and invertebrate evolution.

Figure 4: Proposed model for the distribution of ancestral chromosome segments in the human and the Tetraodon genomes.
The composition of Tetraodon chromosomes is based on their duplication pattern, whereas the composition of human chromosomes is based on the distribution of orthologues of Tetraodon genes. A vertical line in Tetraodon chromosomes denotes regions where sequence has not yet been assigned. With 90 blocks in human chromosomes compared with 44 in Tetraodon chromosomes, the complexity of the mosaic of ancestral segments in human chromosomes underlines the higher frequency of rearrangements to which they were submitted during the same evolutionary period.
© 2004 Nature Publishing Group Jaillon, O. et al. Genome duplication in the teleost fish Tetraodon nigroviridis reveals the early vertebrate proto-karyotype. Nature 431, 954 (2004). All rights reserved.
References and Recommended Reading
Jaillon, O., et al. Genome duplication in the teleost fish Tetraodon nigroviridis reveals the early vertebrate proto-karyotype. Nature 431, 946–957 (2004) doi:10.1038/nature03025 (link to article)