
Abstract
Antibody–drug conjugates (ADC) payloads are cleavable drugs that act as the warhead to exert an ADC’s cytotoxic effects on cancer cells intracellularly. A simple and highly sensitive workflow is developed and validated for the simultaneous quantification of six ADC payloads, namely SN-38, MTX, DXd, MMAE, MMAF and Calicheamicin (CM). The workflow consists of a short and simple sample extraction using a methanol-ethanol mixture, followed by a fast liquid chromatography tandem mass spectrometry (LC–MS/MS) analysis. The results showed that well-validated linear response ranges of 0.4–100 nM for SN38, MTX and DXd, 0.04–100 nM for MMAE and MMAF, 0.4–1000 nM for CM were achieved in mouse serum. Recoveries for all six payloads at three different concentrations (low, medium and high) were more than 85%. An ultra-low sample volume of only 5 µL of serum is required due to the high sensitivity of the method. This validated method was successfully applied to a pharmacokinetic study to quantify MMAE in mouse serum samples.
Introduction
Cancer is one of the leading causes of death worldwide. According to the latest World Health Organization report in 2021, there is an estimation of 19.3 million new cancer cases occurring in 20201. This is a driving force for the rapid emergence of antibody–drug conjugates (ADCs) as a promising class of biotherapeutics for targeted cancer therapy, enabling the selective treatment of cancer cells. To date, fifteen ADCs has been approved by U.S. Food and Drug Administration (FDA), with many more entering clinical trials2,3.
Unlike conventional chemotherapy which are non-specific and toxic to normal cells, ADCs use antibodies to deliver cytotoxic drugs to the targeted tumor sites without harming the normal healthy cells in the process. It typically consists of an antibody that can locate and bind to the cancer cell, a linker and a cytotoxic payload that kills the cancer cell4,5.
The payload acts as the warhead that exerts an ADC’s cytotoxic effects on cancer cells in the intracellular environment. Ideally, an ADC drug should be stable in blood circulation such that all payloads are delivered to the targeted cancer cells and internalized. However, not all payloads could be successfully delivered to the cancer cells due to premature drug loss in the circulatory system before reaching the targeted cells. This will cause off-target toxicity and side effects in patients2.
To evaluate the safety and efficacy of different ADCs, it is important to determine the stability of the ADC molecule. Information on the rate of loss of payloads from its antibody in biological matrices is necessary to assess whether an individual ADC is an effective treatment option. Therefore, analysis of the unconjugated payload is essential in the development of an ADC6,7,8,9.
With advances in technology, third generation ADCs now have antibodies with improved specificity and lowered immunogenicity. Linkers are also designed to be more stable in blood circulation, releasing drugs only in the targeted cells. These developments have brought about reduced amounts of cytotoxic drugs being administered, thus decreasing the toxicity risk for patients10,11,12. The cytotoxicity activities for various common payloads are in the sub- to low nano nanomolar range as reported by Goldenberg et al.13. As a result, to effectively investigate future ADC’s therapeutic window and drug dosage, a sensitive LC–MS/MS method is needed to detect free payloads at similar concentrations for in-vitro and in-vivo studies6,14,15. Existing published methods generally quantify in the nanomolar concentration range (Supp. Table S1)16,17,18,19. Therefore, a highly sensitive LC–MS/MS method as presented in this study would be important in the future development of ADCs.
Furthermore, there is an increasing interest in the conjugation of several classes of payloads onto an individual ADC3,20,21,22,23,24. This will enable the ADC to deliver payloads with different mechanism of action of cell-killing, thus increasing its efficiency in destroying cancer cells3. To our knowledge, there are no reported methods that quantifies more than one ADC payload in a single LC–MS/MS method. Our LC–MS/MS workflow aims to address this gap by simultaneously characterizing and quantifying six ADC payloads across different classes in a single chromatographic run. This would be of relevance and importance in the future development of ADCs with several payloads.
Herein, we present a highly sensitive and robust workflow validated using the ICH Harmonised guidelines on bioanalytical method validation25 to characterize and quantify six unconjugated payloads in serum samples: 7-ethyl-10-hydroxycamptothecin (SN-38), Methotrexate (MTX), Deruxtecan (DXd), Monomethyl auristatin E (MMAE), Monomethyl auristatin F (MMAF) and Calicheamicin (CM). The sample preparation required is simple, with minimal steps and can be completed within 35 min. In addition, the LC–MS analysis is achieved using a short chromatographic run of 11 min and a simple solvent system comprising of methanol, water and formic acid. This workflow is amenable to high-throughput and automated analysis for the screening of free ADC payload in in-vitro and in-vivo studies, to evaluate their stabilities and toxicities in biological sample matrices.
In this study, our workflow was successfully applied to a pharmacokinetic study to quantitate levels of free MMAE in serum obtained from mice after intravenous administration of an ADC.
Materials and methods
Chemical and reagents
High purity standards of ADC payloads were purchased from MedChemExpress (New Jersey, USA). Nicotinamide D4 obtained from Cambridge Isotope Laboratories Inc. (Massachusetts, USA) was spiked into each sample as internal standard (IS). All standard stocks were reconstituted in LC–MS grade Dimethyl Sulfoxide (DMSO) from Thermo Fisher Scientific (Massachusetts, USA).
Mobile phases prepared for LC analysis were laboratory grade water from a Satorius water purification system (Goettingen, Germany), Optima grade methanol from Fisher Chemical (Pennsylvania, USA) and gradient grade liquid chromatography acetonitrile from Merck (Darmstadt, Germany). In addition, formic acid of ≥ 99%, HiPerSolv CHROMANORM for LC–MS from VWR Chemicals (Pennsylvania, USA) was used as an additive.
Sample preparation was carried out using EMSURE grade ethanol from Merck (Darmstadt, Germany) and Optima grade methanol.
Biological samples
Method validation was performed using mouse serum from MyBioSource (San Diego, USA, Catalog no.: MBS238204. Lot no.: 155574), which was stored in − 20 °C freezer until use. These were reported as normal mouse serum, 0.2 µm filtered with no preservative added. Furthermore, they are prepared from barrier mice which are screened for infectious agents.
In addition, to further assess the selectivity and matrix effect, serum was obtained from 5 other sources—one rat serum from MyBioSource (San Diego, USA, Catalog no.: MBS238211. Lot no.: 155575), one human serum each from MyBioSource (San Diego, USA, Catalog no.: MBS170604. Lot no.: 11C5346). The remaining human sera were from Sigma Aldrich (St. Louis, Missouri, USA, Catalog no.: H5667. Lot no.: SLCL6524, Catalog no.: H4522 Lot no.: SLCJ 3593 and Catalog no.: H4522, Lot no.: SLCK 9619).
Preparation of stock solutions and calibrating solutions
Stock solutions of the payload standards were prepared in DMSO at concentrations of 10 mM. These stock solutions were stored in a − 20 °C freezer until use. The calibrating solutions were further prepared by diluting the calibration stock solutions using methanol: ethanol (50% v/v).
Sample preparation
A single-phase extraction with methanol-ethanol mixture as the extraction solvent was used to extract the target analytes from the mouse serum (Fig. 1). 5 µL of serum was first spiked with 2 µL of 7.5 µM Nicotinamide-D4 as internal standard (IS), then 15 µL of ice-cold methanol: ethanol (50% v/v) was added. The mixture was vortexed for 5 min before leaving it at − 20 °C for 20 min for protein precipitation. Subsequently, the sample was centrifuged for 10 min at 14,000 g, 4 °C. The supernatant was collected and used for LC–MS analysis directly.

Schematic diagram describing the sample preparation.
Liquid chromatography (LC) conditions
A Waters Acquity Premier UPLC system (Massachusetts, USA) consisting of a binary pump, thermostatic column holder and a refrigerated sample manager is used. Chromatographic separation is achieved using the Kinetex F5 Core–shell column (2.1 × 100 mm, 1.7 µm, Phenomenex) with 0.1% formic acid in water as mobile phase A and 0.1% formic acid in methanol as mobile phase B. The column temperature and sample manager are maintained at 45 °C and 4 °C respectively. The injection volume was 1 µL. The flow rate was 0.15 mL/min, and the gradient started at 20% B. Over the next 2.0 min, %B was increased to 70% and held for 5.0 min. Finally, the column was flushed at 90% B with a flow rate of 0.3 mL/min for 1.5 min before being equilibrated back to 20% B for 2.5 min. The total run time was 11 min.
Mass spectrometry conditions
A Waters Xevo TQ-XS triple quadrupole mass spectrometer (Massachusetts, USA) coupled with electrospray ionization interface was used. Samples were analyzed in the positive multiple reactions monitoring (MRM) scan mode. The details on the MRM pairs are described in Table 1.
Data analysis
After the LC–MS analysis, data were processed by Waters TargetLynx V4.2 (Massachusetts, USA). Peaks were smoothed using the moving average filter. After smoothing, peaks of each target analyte were detected by its distinctive MRM pair and retention time. For the construction of calibration curves, weighted linear regression models were applied accordingly.
Pharmacokinetic study of MMAE conjugated ADC in mouse model
-
Pharmacokinetic studies in mice model
A chimeric antibody, CA1, was covalently conjugated with MMAE via a VC linker by disulfide bond reduction to form the ADC. 6 mice (3 female, 3 male) were dosed with the ADC via a single, intravenous tail vein injection at 5 mg/kg. Whole blood sample was collected from tail vein at various timepoints for up to 8 days (0 h, 4 h, 1 day, 2 days, 3 day, 4 days, 7 days, 8 days). The serum fractions (10–20 µL) were then collected after centrifugation and stored at − 80 °C until analysis.
-
ELISA quantification of ADC in serum
96-well plates were coated with 3 µg/mL of MMAE monoclonal antibody (Creative Diagnostics, New York City, USA) overnight at 4 °C. Subsequently, the plates were blocked using 3% BSA/PBS before addition of diluted serum (1000x to 8000x dilution with 1%BSA/PBS) and incubating them for 1 h at 37 °C. The calibration standard ranges from 250 ng/mL to 1.953 ng/mL. Following incubation, the plates were washed three times with 0.05% Tween/PBS and then incubated with anti-IgG-HRP (Sigma-Aldrich, St. Louis, Missouri, USA) at 37 °C for 1 h. OPD (Sigma-Aldrich, St. Louis, Missouri, USA) substrate was subsequently added to wells for development for 1–2 min and quenched using 3M HCl. The plates were analysed for absorbances at 492 nm with 620 nm as reference using a microplate reader (Tecan, Männedorf, Switzerland).
-
Computation of pharmacokinetics parameters of ADC and free MMAE
Pharmacokinetic parameters of free MMAE and ADC were calculated with non-compartmental method using PKSolver Excel add-in program. The maximum free MMAE concentration (Cmax) and its corresponding peak time (Tmax) can be observed from its serum concentration-time profile. The total exposure of free MMAE, characterized by the area under the curve (AUC0-t), was calculated by the linear trapezoidal rule.
Results and discussion
Method optimization
-
LC column chemistry
Three analytical columns were first evaluated for their ability to separate the individual target analytes. These include the ACQUITY UPLC BEH Phenyl Column (Waters, Massachusetts, USA), ACQUITY UPLC CSH Phenyl-Hexyl Column (Waters, Massachusetts, USA) and Kinetex F5 Core-shell column. These columns have aromatic group stationary phases, featuring favorable levels of π-π interactions that have been reported to provide good retention and selectivity of the analytes, due to the presence of aromatic rings in these compounds.
Based on the evaluation, it was found that MMAE and MMAF were not well resolved using the BEH Phenyl column (Supp. Figure 1). This separation would be important for development of ADCs with both MMAE and MMAF as payloads. While both the CSH Phenyl-Hexyl and Kinetex F5 Core-shell columns were successful in resolving MMAE and MMAF, the Kinetex F5 Core-shell column was selected for further development, due to increased sensitivity for all analytes, as reflected by an average of 40% increase in integrated peak areas at the same analyte concentrations.
Although the Phenyl-Hexyl column has a three more carbon propyl linker (trifunctionally bonded C6 phenyl ligands) as compared to the Kinetex F5 column (C3 fluoro-phenyl ligands), this increase in linker hydrophobicity did not help in the selectivity of the analytes. On the other hand, the Kinetex F5 column with a lower hydrophobicity and presence of highly electro-negative fluorine moieties create a rich variety of interaction mechanisms like dipole-dipole, induced dipole and hydrogen bonding26 which are beneficial in separating our analytes.
-
LC solvent
Initially, acetonitrile was used as the organic solvent in mobile phase B for chromatographic separation. To further improve the sensitivity of detection and separation of analytes, methanol was also tested. With methanol, the retention time difference between MMAE and MMAF was increased from 0.1 min to 0.19 min. The use of methanol in the mobile phase increased the sensitivities of SN38, MTX, DXd and CM by more than 2-fold. In view of these observations, methanol was chosen over acetonitrile as the solvent for mobile phase B. The improvements in peak resolution and sensitivities using methanol as the mobile phase corroborate the findings from Aqeel et al.27, which concluded that methanol encourages π-π interactions of the analytes with the phenyl group stationary phase. In contrast, the π electrons from the nitrile bond in acetonitrile compete for the π-π interactions between phenyl phase and the analytes, leading to poorer analyte retention.
-
LC Flow rate and injection volume
To improve the sustainability of the LC method, additional development was carried out to reduce solvent consumption and sample injection volume needed. The flow rate of 0.3 mL/min with 4 µL injection volume was successfully decreased to 0.15 mL/min with injection volume of 1ul with no compromise in method sensitivity.
-
Extraction solvent for sample preparation
The use of acetonitrile and methanol/ethanol (1:1) as extraction solvents was compared. Analytes extracted using acetonitrile resulted in poor peak shapes when analyzed directly by LC–MS/MS (Supp. Figure 2). This is likely due to the poor solubility of acetonitrile in the mobile phase system consisting of water and methanol. In addition, the need to dry down the extracts and reconstitute in methanol will increase the sample preparation time and result in unnecessary loss of analytes in the process. In consideration of the above factors, methanol/ethanol (1:1) was selected as extraction solvent.
Method validation
-
Sample total recovery
Extracted samples at low, medium and high concentrations versus extracts of blanks spiked with analyte at the same concentration were determined as shown in Table 2. Recoveries are between 85 and 110%, which showed reproducible and consistent sample preparation at different concentrations.
Table 2 Percentage total recovery of different analytes. As described in the materials and method section, the sample preparation is based on a single-phase extraction. It is a straightforward method whereby the extracted samples can be injected into the mass spectrometer directly. With only simple aliquoting and dispensing of liquids involved in preparation, this method can be easily automated for large scale analysis. In addition, the low sample volume needed (5 µL) would be advantageous in conditions whereby the sample volume is a limiting factor.
-
Selectivity
Six individual serum sources (1 mouse, 4 human and 1 rat) were evaluated for selectivity. No peaks of interference were observed at the retention times of analytes and IS in all serum sources. Figure 2 shows the representative chromatograms of an extracted blank serum and the peaks observed for respective analyte standards.
Figure 2 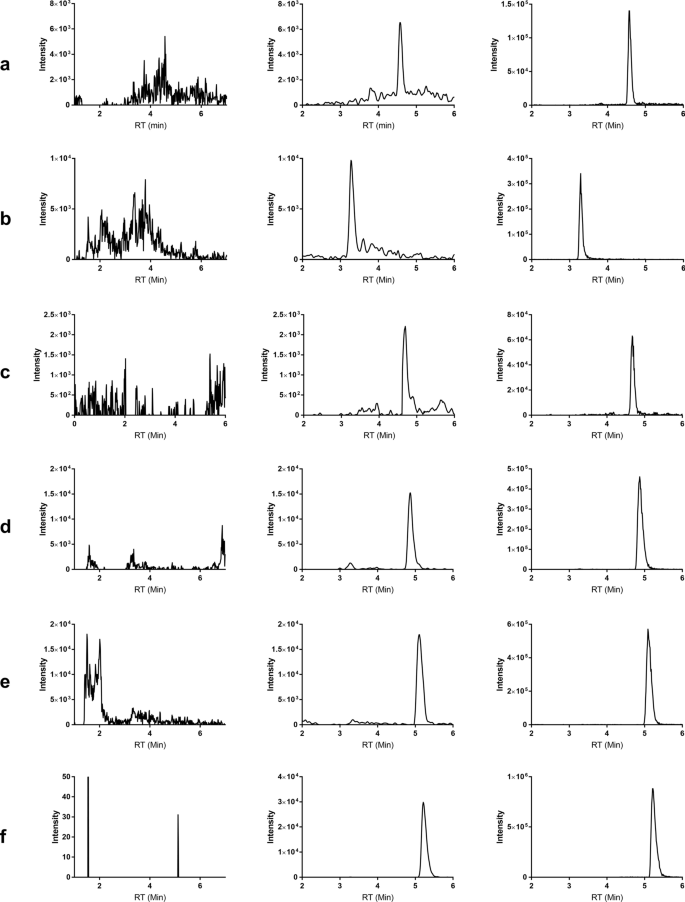
Representative chromatogram of blank serum extract (left column), standards spiked in serum extract at LLOQ (middle column), and standards spiked in serum extract at 10 nM (right column): (a) SN38; (b) MTX; (c) DXd; (d) MMAE; (e) MMAF; (f) CM.

Calibration curve and linear range
We added all calibrators in blank mouse serum matrix. Using our optimized extraction method and LC–MS conditions, 3 technical replicates for each calibration point were performed. The CV of our technical replicates were below 20%. Area ratios were calculated using the area of each analyte at each concentration against the area of internal standard. Using a weighted linear regression model of 1/x2 factor, we achieved a well-validated linear range of 0.4–100 nM for SN38, MTX and DXd, 0.04–100 nM for MMAE and MMAF, 0.4–1000 nM for CM. LLOQ was within 20% deviation from theoretical concentration while the remaining calibrators were well within 15% deviation (Table 3 and Figure 3).

(a) Full calibration curves of different analytes; (b) Lower range of calibration curves for different analytes.
-
Sensitivity
Sensitivity is determined by conducting 5 replicate injections in 3 independent runs. All analyte response at LLOQ are more than 5 times of the analyte response of the zero calibrator28. The accuracy is less than ± 20% of spiked concentration and precision is less than ± 20% CV, which are compliant with the ICH Harmonised guidelines. These are shown in Table 4.
Table 4 Accuracy and precision data for different analytes at low, medium and high QC concentrations. -
Accuracy and precision
Accuracy and precision were likewise studied by performing 5 replicate injections in 3 independent runs Four concentration levels within the linear range of the calibration curves were tested: the LLOQ, within three times of LLOQ (low QC), around 30-40% of the calibration curve range (medium QC) and at least 75% of the ULOQ (high QC). These are shown together in Table 4.
-
Matrix effect
Matrix effect is further evaluated by analyzing 3 replicates of low and high QCs, each prepared using matrix from another 5 different sources in accordance to ICH guidelines. The accuracy is within 15% of the nominal concentration and the precision is not greater than 15%. The results are presented in Table 5.
Table 5 Matrix effect assessment for each analyte in different serum matrices.
Pharmacokinetics study of MMAE conjugated ADC in mouse model
The validated LC–MS method was successfully applied to the pharmacokinetic study to quantitate levels of free MMAE in mice after intravenous administration of ADC at 5 mg/kg. Endogenous level of MMAE was not detected in mouse serum collected before administration. The serum concentration—time profile of ADC and free MMAE (n = 6) is shown in Fig. 4.

ADC and free MMAE concentration vs time pK profile.
Following administration of ADC in mice, free MMAE was released from the ADC due to antibody degradation and toxin deconjugation. However, very low levels of free MMAE (Cmax = 2.10 ± 0.50 nM), which is about 1% concentration of ADC in serum, were detected in circulation and this suggested the stability of the linker and limited deconjugation. This observation was consistent with the MMAE conjugated anti-EGFR pK study done by Hu et al.29 although they had used a higher dose of 15 mg/kg subcutaneously. The reported t1/2 value of 38 h by Hu. et al. in their study was also similar to our observed t1/2 value of 43 h. Our AUC0-t value of 2.03 ± 0.37 nmol.d/L was also dose proportional to their reported value.
Conclusion
We have established a reliable and robust LC–MS workflow which was validated according to the ICH guidelines. A combination of the unique properties of the Kinetex F5 column stationary phase, methanol intrinsic solvent characteristic which supports π–π interactions and reduction in flow rate, resulted in a high sensitivity of 400 picomolar and below for the quantification of 6 well-established payloads achieved in a single chromatographic method simultaneously. With the simple sample preparation protocol and fast LC–MS/MS analysis, the entire workflow could be completed within 50 min. This method could also be integrated into an automated workflow for high throughput analysis. While current ADCs comprise of a single payload, there is a potential to engineer payloads of different drug classes onto the antibody for better cancer cell killing efficiency. As such, having a single method for the quantification of two or more payloads would prove to be of relevance for future ADC development.
Data availability
The datasets used and/or analysed during the current study available from the corresponding author on reasonable request.
References
Sung, H. et al. Global Cancer Statistics 2020: GLOBOCAN estimates of incidence and mortality worldwide for 36 cancers in 185 countries. CA Cancer J. Clin. 71, 209–249 (2021).
Nguyen, T. D., Bordeau, B. M. & Balthasar, J. P. Mechanisms of ADC toxicity and strategies to increase ADC tolerability. Cancers (Basel) 15, 713 (2023).
Wang, Z., Li, H., Gou, L., Li, W. & Wang, Y. Antibody–drug conjugates: Recent advances in payloads. Acta Pharm. Sin. B https://doi.org/10.1016/j.apsb.2023.06.015 (2023).
Walko, C. M. & West, H. Antibody drug conjugates for cancer treatment. JAMA Oncol. 5, 1648 (2019).
Pettinato, M. C. Introduction to antibody-drug conjugates. Antibodies 10, 42 (2021).
Lee, B. et al. Assessments of the in vitro and in vivo linker stability and catabolic fate for the ortho hydroxy-protected aryl sulfate linker by immuno-affinity capture liquid chromatography quadrupole time-of-flight mass spectrometric assay. Pharmaceutics 13, 125 (2021).
Durbin, K. R., Nottoli, M. S., Catron, N. D., Richwine, N. & Jenkins, G. J. High-throughput, multispecies, parallelized plasma stability assay for the determination and characterization of antibody-drug conjugate aggregation and drug release. ACS Omega 2, 4207–4215 (2017).
Hinrichs, M. J. M. & Dixit, R. Antibody drug conjugates: Nonclinical safety considerations. AAPS J. 17, 1055–1064 (2015).
Ross, P. L. & Wolfe, J. L. Physical and chemical stability of antibody drug conjugates: Current status. J. Pharm. Sci. 105, 391–397 (2016).
Fu, Z., Li, S., Han, S., Shi, C. & Zhang, Y. Antibody drug conjugate: The “biological missile” for targeted cancer therapy. Signal Transduct. Target Ther. 7, 93 (2022).
Zhao, P. et al. Recent advances of antibody drug conjugates for clinical applications. Acta Pharm. Sin. B 10, 1589–1600 (2020).
Nakada, T., Sugihara, K., Jikoh, T., Abe, Y. & Agatsuma, T. The latest research and development into the antibody-drug conjugate, [fam-] Trastuzumab deruxtecan (DS-8201a), for HER2 cancer therapy. Chem. Pharm. Bull. (Tokyo) 67, 173–185 (2019).
Goldenberg, D. M. & Sharkey, R. M. Antibody-drug conjugates targeting TROP-2 and incorporating SN-38: A case study of anti-TROP-2 sacituzumab govitecan. MAbs 11, 987–995 (2019).
Fourie-O’Donohue, A. et al. Improved translation of stability for conjugated antibodies using an in vitro whole blood assay. MAbs https://doi.org/10.1080/19420862.2020.1715705 (2020).
Jackson, D. et al. In vitro and in vivo evaluation of cysteine and site specific conjugated herceptin antibody-drug conjugates. PLoS One 9, e83865 (2014).
Khan, S. et al. A simple and sensitive LC/MS/MS assay for 7-ethyl-10-hydroxycamptothecin (SN-38) in mouse plasma and tissues: application to pharmacokinetic study of liposome entrapped SN-38 (LE-SN38). J. Pharm. Biomed. Anal. 37, 135–142 (2005).
Feng, Z. et al. A validated HPLC–MS/MS method for quantification of methotrexate and application for therapeutic drug monitoring in children and adults with non-hodgkin lymphoma. Drug Des. Dev. Ther. 15, 4575–4583 (2021).
Lee, B. et al. Liquid chromatography-high resolution mass spectrometric method for the quantification of monomethyl auristatin E (MMAE) and its preclinical pharmacokinetics. Biomed. Chromatogr. 34, e4855 (2020).
Park, M. H. et al. Pharmacokinetic and metabolism studies of monomethyl auristatin F via liquid chromatography-quadrupole-time-of-flight mass spectrometry. Molecules 24, 2754 (2019).
Mckertish, C. M. & Kayser, V. A novel dual-payload ADC for the treatment of HER2+ breast and colon cancer. Pharmaceutics 15, 2020 (2023).
Nervig, C. S. & Owen, S. C. Advances in the development of dual-drug antibody drug conjugates. ADC Rev. J. Antib. Drug Conjug. https://doi.org/10.14229/jadc.2023.01.05.001 (2023).
Kumar, A. et al. Synthesis of a heterotrifunctional linker for the site-specific preparation of antibody-drug conjugates with two distinct warheads. Bioorg. Med. Chem. Lett. 28, 3617–3621 (2018).
Levengood, M. R. et al. Orthogonal cysteine protection enables homogeneous multi-drug antibody-drug conjugates. Angew. Chem. Int. Ed. 56, 733–737 (2017).
Nilchan, N. et al. Dual-mechanistic antibody-drug conjugate via site-specific selenocysteine/cysteine conjugation. Antib. Ther. 2, 71–78 (2019).
International Council for Harmonisation of technical requirements for pharmaceuticals for human use. Bioanalytical method validation and study sample analysis M10. ICH Harmonised Guidelines (2022). https://database.ich.org/sites/default/files/M10_Guideline_Step4_2022_0524.pdf
Phenomenex Inc. New Kinetex F5 HPLC/UHPLC Core-Shell Columns (2018).
Aqeel Z., Layne J. & Luk K. Investigation on the Impact of Using Different Mobile Phase Ratios of Acetonitrile to Methanol on Reversed Phase Phenyl Selectivity. (2019). https://www.phenomenex.com/-/jssmedia/phxjss/data/media/documents/tn71111019_w.pdf?rev=2408a8d2c8b44710b2ed285218140397
Centre for Drug Evaluation and Research, Food and Drug Administration. Bioanalytical Method Validation: Guidance for Industry (Biopharmaceutics) (2018) https://www.fda.gov/media/70858/download
Hu, X. et al. An EGFR-targeting antibody–drug conjugate LR 004-VC-MMAE: Potential in esophageal squamous cell carcinoma and other malignancies. Mol. Oncol. 13, 246–263 (2019).
Acknowledgements
The authors thank the Agency for Science, Technology and Research, Singapore for supporting this research. We also thank A/Prof Say Kong Ng and Dr Sean Chia for the provision of serum matrices for the study.
Author information
Authors and Affiliations
Contributions
S.Y.M.: Conceptualisation, Methodology, Validation, Investigation, Data curation, Writing -Original draft, Visualisation, Design of study, Writing—Review & Editing. S.C.: Writing—Original draft, Writing—Review & Editing. W.J.F.: Conceptualisation, Methodology, Validation, Investigation, Data curation, Writing -Original draft, Visualisation, Design of study. A.C.: Design of study, Writing—Review & Editing. Y.S.H.: Design of study, Writing—Review & Editing. All authors reviewed the manuscript. Conceptualisation, Methodology, Validation, Formal analysis, Investigation, Data curation, Writing -Original draft, Visualisation, Design of study, Writing—Review & Editing.
Corresponding author
Ethics declarations
Competing interests
The authors declare no competing interests.
Additional information
Publisher's note
Springer Nature remains neutral with regard to jurisdictional claims in published maps and institutional affiliations.
Supplementary Information
Rights and permissions
Open Access This article is licensed under a Creative Commons Attribution 4.0 International License, which permits use, sharing, adaptation, distribution and reproduction in any medium or format, as long as you give appropriate credit to the original author(s) and the source, provide a link to the Creative Commons licence, and indicate if changes were made. The images or other third party material in this article are included in the article's Creative Commons licence, unless indicated otherwise in a credit line to the material. If material is not included in the article's Creative Commons licence and your intended use is not permitted by statutory regulation or exceeds the permitted use, you will need to obtain permission directly from the copyright holder. To view a copy of this licence, visit http://creativecommons.org/licenses/by/4.0/.
About this article

Cite this article
Mak, S.Y., Chen, S., Fong, W.J. et al. A simple and highly sensitive LC–MS workflow for characterization and quantification of ADC cleavable payloads. Sci Rep 14, 11018 (2024). https://doi.org/10.1038/s41598-024-61522-4
Received:
Accepted:
Published:
DOI: https://doi.org/10.1038/s41598-024-61522-4
Comments
By submitting a comment you agree to abide by our Terms and Community Guidelines. If you find something abusive or that does not comply with our terms or guidelines please flag it as inappropriate.
