
Abstract
Convolutional Neural Networks (CNNs) have been central to the Deep Learning revolution and played a key role in initiating the new age of Artificial Intelligence. However, in recent years newer architectures such as Transformers have dominated both research and practical applications. While CNNs still play critical roles in many of the newer developments such as Generative AI, they are far from being thoroughly understood and utilised to their full potential. Here we show that CNNs can recognise patterns in images with scattered pixels and can be used to analyse complex datasets by transforming them into pseudo images with minimal processing for any high dimensional dataset, representing a more general approach to the application of CNNs to datasets such as in molecular biology, text, and speech. We introduce a pipeline called DeepMapper, which allows analysis of very high dimensional datasets without intermediate filtering and dimension reduction, thus preserving the full texture of the data, enabling detection of small variations normally deemed ‘noise’. We demonstrate that DeepMapper can identify very small perturbations in large datasets with mostly random variables, and that it is superior in speed and on par in accuracy to prior work in processing large datasets with large numbers of features.
Introduction
There are exponential increases in data1 especially from highly complex systems, whose non-linear interactions and relationships are not well understood, and which can display major or unexpected changes in response to small perturbations, known as the ‘Butterfly effect’2.
In domains characterised by high-dimensional data, traditional statistical methods and Machine Learning (ML) techniques make heavy use of feature engineering that incorporates extensive filtering, selection of highly variable parameters, and dimension reduction techniques such as Principal Component Analysis (PCA)3. Most current tools filter out smaller changes in data, mostly considered artefacts or `noise`, which may contain information that is paramount to understanding the nature and behaviour of such highly complex systems4.
The emergence of Deep Learning (DL) offers a paradigm shift. DL algorithms, underpinned by adaptive learning mechanisms, can discern both linear and non-linear data intricacies, and open avenues to analyse data that is not possible or practical by conventional techniques5, particularly in complex domains such as image, temporal sequence analysis, molecular biology, and astronomy6. DL models, such as Convolutional Neural Networks (CNNs)7, Recurrent Neural Networks (RNNs)8, Generative Networks9 and Transformers10, have demonstrated exceptional performance in various domains, such as image and speech recognition, natural language processing, and game playing6. CNNs and LSTMs were found to be great tools to predict behaviour of so called `chaotic` systems11. Modern DL systems often surpass human-level performance, and challenge humans even in creative endeavours.
CNNs utilise a unique architecture that comprises several layers, including convolutional layers, pooling layers, and fully connected layers, to process and transform the input data hierarchically5. CNNs have no knowledge of sequence, and therefore are generally not used in analysing time-series or similar data, which is traditionally attempted with Recurrent Neural Networks (RNNs)12 and Long Short-Term Memory networks (LSTMs)8 due to their ability to capture temporal patterns. Where CNNs have been employed for sequence or time-series analysis, 1-dimensional (1D) CNNs have been selected because of their vector based 1D input structure13. However, attempts to analyse such data in 1D CNNs do not always give superior results14. In addition, GPU (Graphical Processing Units) systems are not always optimised for processing 1D CNNs, therefore even though 1D CNNs have fewer parameters than 2-dimensional (2D) CNNs, 2D CNNs can outperform 1D CNNs15.
Transformers, introduced by Vaswani et al.10, have recently come to prominence, particularly for tasks where data are in the form of time series or sequences, in domains ranging from language modelling to stock market prediction16. Transformers leverage self-attention, a key component that allows a model to weigh and focus on various parts of an input sequence when producing an output, enabling the capture of long-range dependencies in data. Unlike CNNs, which use local receptive fields, self-attention weighs the significance of various parts of the input data17.
Following success with sequence-based tasks, Transformers are being extended to image processing. Vision-Transformers in object detection18, Detection Transformers19 and lately Real-time Detection Transformers all claim superiority over CNNs20. However, their inference operations demand far more resources than CNNs and trail CNNs in flexibility. They also suffer similar augmentation problems as CNNs. More recently, Retentive-Networks have been offered as an alternative to Transformers21 and may soon challenge the Transformer architecture.
CNNs can recognise dispersed patterns
Even though CNNs are widely used, there are some misconceptions, notably that CNNs are largely limited to image data, and require established spatial relationships between pixels in images, both of which are open to challenge. The latter is of particular importance when considering the potential of CNNs to analyse complex non-image datasets, whose data structures are arbitrary.
Moreover, while CNNs are universal function approximators22, they may not always generalise23, especially if they are trained on data that is insufficient to cover the solution space24. It is also known that they can spontaneously generalise even when supplied with a small number of samples during training after overfitting, called ‘grokking’25,26. CNNs can generalise from scattered data if given enough samples, or if they grok, and this can be determined by observing changes to training versus testing accuracy and loss.
Non-image processing with CNNs
While CNNs have achieved remarkable success in computer vision applications, such as image classification and object detection7,27, they have also been employed in other domains to a lesser degree with impressive results, including: (1) natural language processing, text classification, sentiment analysis and named entity recognition, by treating text data as a one-dimensional image with characters represented as pixels16,28; (2) audio processing, such as speech recognition, speaker identification and audio event detection, by applying convolutions over time frequency representations of audio signals29; (3) time series analysis, such as financial market prediction, human activity recognition and medical signal analysis, using one-dimensional convolutions to capture local temporal patterns and learn features from time series data30; and (4) biopolymer (e.g., DNA) sequencing, using 2D CNNs to accurately classify molecular barcodes in raw signals from Oxford Nanopore sequencers using a transformation to turn a 1D signal into 2D images—improving barcode identification recovery from 38 to over 85%31.
Indeed, CNNs are not perfect tools for image processing as they do not develop semantic understanding of images even though they can be trained to do semantic segmentation32. They cannot easily recognise negative images when trained with positive images33. CNNs are also sensitive to the orientation and scale of objects and must rely on augmentation of image datasets, often involving hundreds of variations of the same image34. There are no such changes in the perspective and orientation of data converted into flat 2D images.
In the realm of complex domains that generate huge amounts of data, augmentation is usually not required for non-image datasets, as the datasets will be rich enough. Moreover, introducing arbitrary augmentation does not always improve accuracy; indeed, introducing hand-tailored augmentation may hinder analysis35. If augmentation is required, it can be introduced in a data-oriented form, but even when using automated augmentation such as AutoAugment35 or FasterAutoAugment36, many of the augmentations (such as shearing, translation, rotation, inversion, etc.) should not be used, and the result should be tested carefully, as augmentation may introduce artefacts.
A frequent problem with handling non-image datasets with many variables is noise. Many algorithms have been developed for noise elimination, most of which are domain specific. CNNs can be trained to use the whole input space with minimal filtering and no dimension reduction, and can find useful information in what might be ascribed as ‘noise’4,37. Indeed, a key reason to retain ‘noise’ is to allow discovery of small perturbations that cannot be detected by other methods11.
Conversion of non-image data to artificial images for CNN processing
Transforming sequence data to images without resorting to dimension reduction or filtering offers a potent toolset for discerning complex patterns in time series and sequence data, which potentiates the two major advantages of CNNs compared to RNNs, LSTMs and Transformers. First, CNNs do not depend on past data to recognise current patterns, which increases sensitivity to detect patterns that appear in the beginning of time-series or sequence data. Second, 2D CNNs are better optimised for GPUs and highly parallelizable, and are consequently faster than other current architectures, which accelerates training and inference, while reducing resource and energy consumption during in all phases including image transformation, training, and inference significantly.
Image data such as MNIST represented in a matrix can be classified by basic deep networks such as Multi-level Perceptrons (MLP) by turning their matrix representation to vectors (Fig. 1a). Using this approach analysis of images becomes increasingly complex as the image size grows, increasing the input parameters of MLP and the computational cost exponentially. On the other hand, 2D CNNs can handle the original matrix much faster than MLP with equal or better accuracy and scale to much larger images.
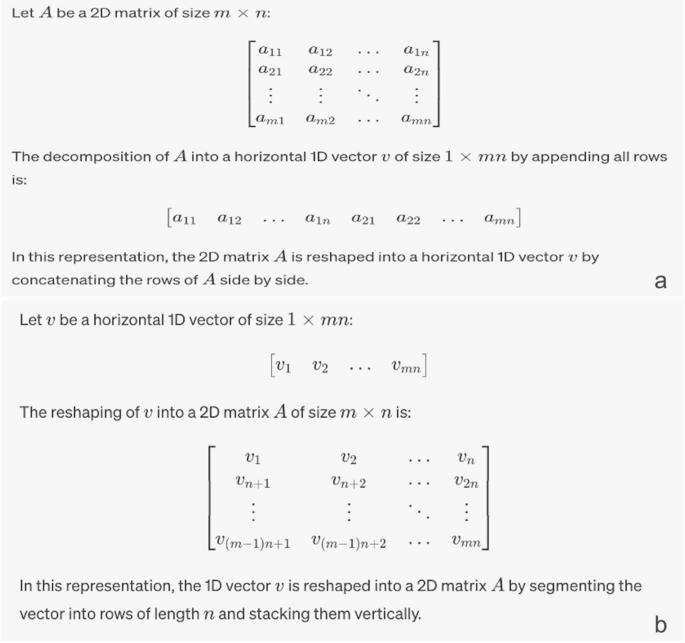
Conversion of images to vectors and vice versa. (a) Basic operation of transformation of an image to a vector, forming a sequence representation of the numeric values of pixels. (b) Transforming a vector to a matrix, forming an image by encoding numerical values as pixels. During this operation if the vector size cannot be mapped to mXn because vector size is smaller than the nearest mXn, then it is padded with zeroes to the nearest mXn.
Just like how a simple neural network analyses a 2D image by turning it into a vector, the reciprocal is also true—data in a vector can be converted to a 2D matrix (Fig. 1b). Vectors converted to such matrices form arbitrary patterns that are incomprehensible to human eye. A similar technique for such mapping has also been proposed by Kovelarchuk et al. using another algorithm called CPC-R38.
Attribution
An important aspect of any analysis is to be able to identify those variables that are most important and the degree to which they contribute to a given classification. Identifying these variables is particularly challenging in CNNs due to their complex hierarchical architecture, and many non-linear transformations39. To address this problem many ‘attribution methods’ have been developed to try to quantify the contribution of each variable (e.g., pixels in images) to the final output for deep neural networks and CNNs40.
Saliency maps serve as an intuitive attribution and visualisation tool for CNNs, spotlighting regions in input data that significantly influence the model's predictions27. By offering a heatmap representation, these maps illuminate key features that the model deems crucial, thus aiding in demystifying the model's decision-making process. For instance, when analysing an image of a cat, the saliency map would emphasise the cat's distinct features over the background. While their simplicity facilitates understanding even for those less acquainted with deep learning, saliency maps do face challenges, particularly their sensitivity to noise and occasional misalignment with human intuition41,42,43. Nonetheless, they remain a pivotal tool in enhancing model transparency and bridging the interpretability gap between ML models and human comprehension.
Several methods have been proposed for attribution, including Guided Backpropagation44, Layer-wise Relevance Propagation45, Gradient-weighted Class Activation Mapping46, Integrated Gradients47, DeepLIFT48, and SHAP (SHapley Additive exPlanations)49. Many of these methods were developed because it is challenging to identify important input features when there are different images with the same label (e.g., ‘bird’ with many species) presented at different scales, colours, and perspectives. In contrast, most non-image data does not have such variations, as each pixel corresponds to the same feature. For this reason, choosing attributions with minimal processing is sufficient to identify the salient input variables that have the maximal impact on classification.
DeepMapper
Here we introduce a new analytical pipeline, DeepMapper, which applies a non-indexed or indexed mapping to the data representing each data point with one pixel, enabling the classification or clustering of data using 2D CNNs. This simple direct mapping has been tried by others but has not been tested with datasets with sufficiently large amounts of data in various conditions. We use raw data with minimal filtering and no dimension reduction to preserve small perturbations in data that are normally removed, in order to assess their impact.
The pipeline includes conversion of data, separation to training and validation, assessment of training quality, attribution, and accumulation of results in a pipeline. The pipeline is run multiple times until a consensus is reached. The significant variables can then be identified using attribution and exported appropriately.
The DeepMapper architecture is shown in Fig. 2. The complete algorithm of DeepMapper is detailed in the “Methods” section and the Python source code is supplied at GitHub50.

DeepMapper architecture. DeepMapper uses sequence or multi-variate data as input. The first step of DeepMapper is to merge and if required index input files to prepare them into matrix format. The data are normalised using log normalisation, then folded to a matrix. Folding is performed either directly with the natural order of the data or by using the index that is generated or supplied during the data import. After folding, the data are kept in temporary storage and separated to ‘train’ and ‘test’ using SciPy train test split. Training is done using either using CNNs that are supplied by the PyTorch libraries, or a custom CNN supplied (ResNet18 is used by default). Intermediary results are run through attribution algorithms supplied by the Captum51 and saved to run history log. The run is then repeated until convergence is achieved, or until a pre-determined number of iterations are performed by shuffling training testing and validation data. Results are summarised in a report with exportable tables and graphics. Attribution is applied to true positives and true negatives, and these are translated back to features to be added to reports. Further details can be directly found in the accompanying code50.
Methods
DeepMapper is developed to implement an approach to process high-dimensional data without resorting to excessive filtering and dimension reduction techniques that eliminate smaller perturbations in data to be able to identify those differences that would otherwise be filtered out. The following algorithm is used to achieve this result:
-
1.
Read and setup the running parameters.
-
2.
Read the data into a tabulated form in the form of observations, features, and outcome (in the form of labels, or if self-supervised, the input itself).
If the input data includes categorical features, these features should be converted to numbers and normalised before feeding to DeepMapper.
-
3.
Identify features and labels.
-
4.
Do only basic filtering that eliminates observations or features if all of them are 0 or empty.
-
5.
Normalise features.
-
6.
Transform tabulated data to 2-dimensional matrices as illustrated in Fig. 1a by applying a vector to matrix transformation.
-
7.
If the analysis is supervised, then transform class labels to output matrices.
-
8.
Begin iteration:
-
a.
Separate the data into training and validation groups.
-
b.
Train on the dataset for required number of epochs, until reaching satisfactory testing accuracy and loss, or maximum a pre-determined number of iterations.
-
c.
If satisfactory testing results are obtained, then:
-
i.
Perform attributions by associating each result to contributing input pixels using Captum, a Python library for attributions51.
-
ii.
Accumulate attribution results by collecting the attribution results for each class.
-
i.
-
d.
If training is satisfactory:
-
i.
Tabulate attribution results by averaging accumulated attributions.
-
ii.
Save the model.
-
i.
-
a.
-
9.
Report results.
The results of DeepMapper analysis can be used in 2 ways:
-
1.
Supervised: DeepMapper produces a list of features that played a prominent role in the differentiation of classes.
-
2.
Self-supervised: Highlights the most important features in differentiating observations from each other in a non-linear fashion. The output can be used as an alternative feature selection tool for dimension reduction.
In both modes, any hidden layer can be examined as latent space. A special bottleneck layer can be introduced to reduce dimensions for clustering purposes.
Results
We present a simple example to demonstrate that CNNs can readily interpret data with a well dispersed pattern of pixels, using the MNIST dataset, which is widely used for hand-written image recognition and which humans as well as CNNs can easily recognise and classify based on the obvious spatial relationships between pixels (Fig. 3). This dataset is a more complicated problem than datasets such as the Gisette dataset52 that was developed to distinguish between 4 and 9. It includes all digits and uses a full randomisation of pixels, and can be regenerated with the script supplied50 and changing the seed will generate different patterns.
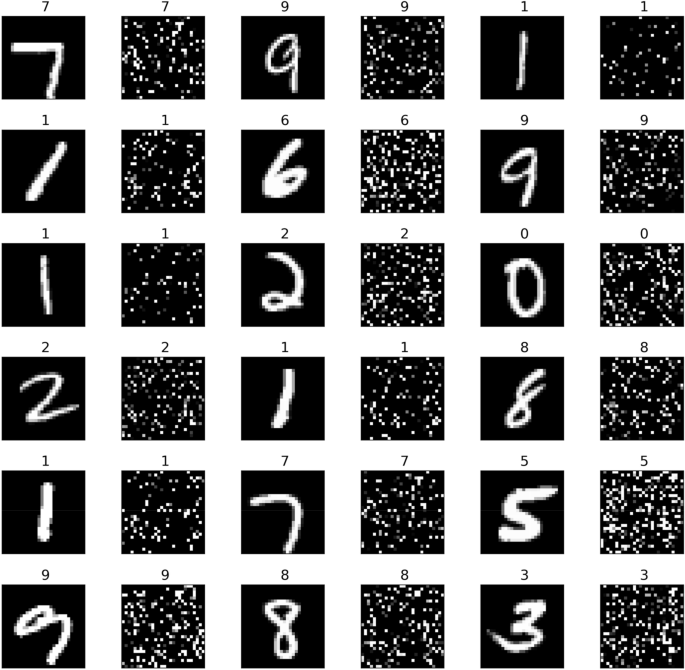
A sample from MNIST dataset (left side of each image) and its shuffled counterpart (right side).
We randomly shuffled the data in Fig. 3 using the same seed50 to obtain 60,000 training images such as those shown on the right side of each digit, and validated the results with a separate batch of 20,000 images (Fig. 3). Although the resulting images are no longer recognizable by eye, a CNN has no difficulty distinguishing and classifying each pattern with ~ 2% testing error compared to the reference data (Fig. 4). This result demonstrates that CNNs can accurately recognise global patterns in images without reliance on local relationships between neighbouring pixels. It also confirms the finding that shuffling images only marginally increases training loss23 and extends it to testing loss (Fig. 4).

Results of training MNIST dataset (a) and the shuffled dataset (b) with PyTorch model ResNet1850. The charts demonstrate although the training continued for 50 epochs, about 15 epochs for shuffled images (b) would be enough, as further training starts causing overfitting. The decrease of accuracy between normal and shuffled images is about 3%, and this difference cannot be improved by using more sophisticated CNNs with more layers, meaning shuffling images cause a measurable loss of information, yet still hold patterns recognisable by CNNs.
Testing DeepMapper
Finding slight changes in very few variables in otherwise seemingly random datasets with large numbers of variables is like finding a needle in a haystack. Such differences in data are almost impossible to detect using traditional analysis tools because small variations are usually filtered out before analysis.
We devised a simple test case to determine if DeepMapper can detect one or more variables with small but distinct variations in otherwise randomly generated data. We generated a dataset with 10,000 data items with 18,225 numeric variables as an example of a high-dimensional dataset using PyTorch’s uniform random algorithms53. The algorithm sets 18,223 of these variables to random numbers in the range of 0–1, and two of the variables into two distinct groups as seen in Table 1.
We call this type of dataset ‘Needle in a haystack’ (NIHS) dataset, where very small amounts of data with small variance is hidden among a set of random variables that is order(s) of magnitude greater than the meaningful components. We provide a script that can generate this and similar datasets among the source supplied50.
DeepMapper was able to accurately classify the two datasets (Fig. 5). Furthermore, using attribution DeepMapper was also able to determine the two datapoints that have different variances in the two classes. Note that DeepMapper may not always find all the changes in the first attempt as neural network initialisation of weights is a stochastic process. However, DeepMapper overcomes this matter via multiple iterations to establish acceptable training and testing accuracies as described in the Methods.

In this demonstration of analysis of high dimensional data with very small perturbations, DeepMapper can find these small variations in a few (in this example two) variables out of very large number of random variables (here 18,225). (a) DeepMapper representations of each record. (b) The result of the test run of the classification with unseen data (3750 elements). (c) The first and second variables in the graph are measurably higher than the other variables.
Comparison of DeepMapper with DeepInsight
DeepInsight54 is the most general approach published to date for converting non-image data into image-like structures, with the claim that these processed structures allow CNNs to capture complex patterns and features in the data. DeepInsight offers an algorithm to create images that have similar features collated into a “well organised image form”, or by applying one of several dimensionality reduction algorithms (e.g., t-SNE, PCA or KPCA)54. However, these algorithms add computational complexity, potentially eliminate valuable information, limit the abilities of CNNs to find small perturbations, and make it more difficult to use attribution to determine most notable features impacting analysis as multiple features may overlap in the transformed image. In contrast DeepMapper uses a direct mapping mechanism where each feature corresponds to one pixel.
To identify important input variables, DeepInsight authors later developed DeepFeature55 using an elaborate mechanism to associate image areas identified by attribution methods to the input variables. DeepMapper uses a simpler approach as each pixel corresponds to only one variable and can use any of the attribution methods to link results to its input space. While both DeepMapper and DeepInsight follow the general idea that non-image data can be processed with 2D CNNs, DeepMapper uses a much simpler and faster algorithm, while DeepInsight chooses a sophisticated set of algorithms to convert non-image data to images, dramatically increasing computational cost. The DeepInsight conversion process is not designed to utilise GPUs so cannot be accelerated by better hardware, and the obtained images may be larger than the number of data points, also impacting performance.
One of the biggest differences between DeepFeature and DeepMapper is that DeepFeature in many cases selects multiple features during attribution because DeepInsight pixels represent multiple values, whereas each DeepMapper pixel represents one input feature, therefore it can determine differentiating features with pinpoint accuracy at a resolution of 1 pixel per feature.
The DeepInsight manuscript offers various examples of data to demonstrate its abilities. However, many of the examples use low dimensions (20–4000 features) while today’s complex datasets may regularly require tens of thousands to millions of features such as in genome analysis in biology and radio-telescope analysis in astronomy. As such, several examples provided by DeepInsight have insufficient dimensions for a sophisticated mechanism such as DeepMapper, which should ideally have 10,000 or more dimensions as required by modern complex datasets. DeepInsight examples include a speech dataset from the TIMIT corpus with 39 dimensions, Relathe (text) dataset, which is derived from newsgroup documents and partitioned evenly across different newsgroups. It contains 1427 samples and 4322 dimensions. The ringnorm-DELVE, which is an implementation of Leo Breiman’s ringnorm example, is a 20 dimensional, 2 class classification with 7400 samples54. Another example, Madelon, introduced an artificially generated dataset 2600 samples and 500 dimensions, where only 5 principal and 20 derived variables containing information. Instead, we used a much more complicated example than Madelon, an NIHS dataset50 that we used to test DeepMapper in the first place. We attempted to run DeepInsight with NIHS data, but we could not get it to train properly and for this reason we cannot supply a comparison.
The most complex problem published by DeepInsight was the analysis of a public RNA sequencing gene expression dataset from TCGA (https://cancergenome.nih.gov/) containing 6216 samples of 60,483 genes or dimensions, of which DeepInsight used 19,319. We selected this example as the second demonstration of application of DeepMapper to high dimensional data, as well as a benchmark for comparison with DeepInsight.
We generated the data using the R script offered by DeepInsight54 and ran DeepMapper as well as DeepInsight using the generated dataset to compare accuracy and speed. In this test DeepMapper exhibited much improved processing speed with near identical accuracy (Table 2, Fig. 6).
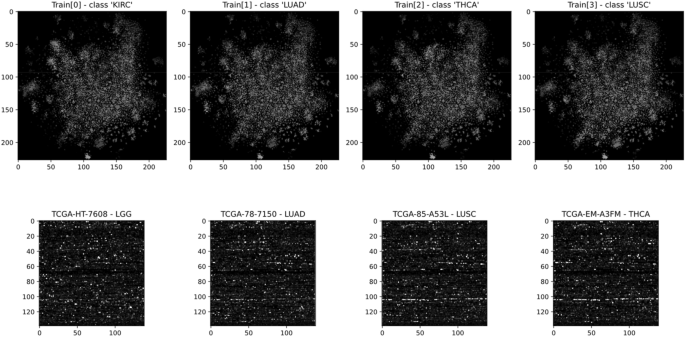
Analysis of TCGA data by DeepInsight vs DeepMapper: The image on the top was generated by DeepInsight using its default values and a t-SNE transformer supplied by DeepInsight. The image at the bottom was generated by DeepMapper. Image conversion and training speeds and the analysis results can be found in Table 2.
Discussion
CNNs are fundamentally sophisticated pattern matchers that can establish intricate mappings between input features and output representations6. They excel at transforming various inputs into outputs, including identifying classes or bounding boxes, through a series of operations involving convolution, pooling, and activation functions7,56.
Even though CNNs are in the centre of many of today’s revolutionary AI systems from self-driving cars to generative AI systems such as Dall-E-2, MidJourney and Stable Diffusion, they are still not well understood nor efficiently utilised, and their usage beyond image analysis has been limited.
While CNNs used in image analysis are constrained historically and practically to a 224 × 224 matrix or a similar fixed size input, this limitation arises for pre-trained models. When CNNs have not been pre-trained, one can select a much wider variety of sizes as input shape depending on the CNN architecture. Some CNNs are more flexible in their input size that implemented with adaptive pooling layers such as ResNet18 using adaptive pooling57. This provides flexibility to choose optimal sizes for the task in hand for non-image applications, as most non-image applications will not use pre-trained CNNs.
Here we have demonstrated uses of CNNs that are outside the norm. There is a need for analysis of complex data with many thousands of features that are not primarily images. There is also a lack of tools that offer minimal conversion of non-image data to image-like formats that then can easily be processed with CNNs in classification and clustering tasks. As a lot of this data is coming from complex systems that have a lot of features, DeepMapper offers a way of investigating such data in ways that may not be possible with traditional approaches.
Although DeepMapper currently uses CNN as its AI component, alternative analytic strategies can easily be substituted in lieu of CNN with minimal changes, such as Vision Transformers18 or RetNets21, which have great potential for this application. While Transformers and RetNets have input size limitations for inference in terms of number of tokens. Vision Transformers can handle much larger inputs by dividing images to segments that incorporate multiple pixels18. This type of approach would be applicable to both Transformers and RetNets, and future architectures. DeepMapping can leverage these newer architectures, and others, in the future57.
Data availability
DeepMapper is released as an open source tool on GitHub https://github.com/tansel/deepmapper. Data that is not available from GitHub because of size constraints can be requested from the authors.
References
Taylor, P. Volume of data/information created, captured, copied, and consumed worldwide from 2010 to 2020, with forecasts from 2021 to 2025. https://www.statista.com/statistics/871513/worldwide-data-created/ (2023).
Ghys, É. The butterfly effect. in The Proceedings of the 12th International Congress on Mathematical Education: Intellectual and attitudinal challenges, pp. 19–39 (Springer). (2015).
Jolliffe, I. T. Mathematical and statistical properties of sample principal components. Principal Component Analysis, pp. 29–61 (Springer). https://doi.org/10.1007/0-387-22440-8_3 (2002).
Landauer, R. The noise is the signal. Nature 392, 658–659. https://doi.org/10.1038/33551 (1998).
Goodfellow, I., Bengio, Y. & Courville, A. Deep Learning (MIT Press). http://www.deeplearningbook.org (2016).
LeCun, Y., Bengio, Y. & Hinton, G. Deep learning. Nature 521, 436–444. https://doi.org/10.1038/nature14539 (2015).
Krizhevsky, A., Sutskever, I. & Hinton, G. E. ImageNet classification with deep convolutional neural networks. Commun. ACM 60, 84–90. https://doi.org/10.1145/3065386 (2017).
Hochreiter, S. & Schmidhuber, J. Long short-term memory. Neural Comput. 9, 1735–1780. https://doi.org/10.1162/neco.1997.9.8.1735 (1997).
Goodfellow, I. et al. Generative adversarial nets. Commun. ACM 63, 139–144. https://doi.org/10.1145/3422622 (2020).
Vaswani, A. et al. Attention is all you need. NIPS'17: Proceedings of the 31st International Conference on Neural Information Processing Systems, pp. 6000–6010. https://doi.org/10.5555/3295222.3295349 (2017).
Barrio, R. et al. Deep learning for chaos detection. Chaos 33, 073146. https://doi.org/10.1063/5.0143876 (2023).
Levin, E. A recurrent neural network: limitations and training. Neural Netw. 3, 641–650. https://doi.org/10.1016/0893-6080(90)90054-O (1990).
LeCun, Y. & Bengio, Y. Convolutional networks for images, speech, and time series. in The handbook of brain theory and neural networks, pp. 255–258. https://doi.org/10.5555/303568.303704 (MIT Press, 1998).
Wu, Y., Yang, F., Liu, Y., Zha, X. & Yuan, S. A comparison of 1-D and 2-D deep convolutional neural networks in ECG classification. arXiv preprint arXiv:1810.07088. https://doi.org/10.48550/arXiv.1810.07088 (2018).
Hu, J. et al. A multichannel 2D convolutional neural network model for task-evoked fMRI data classification. Comput. Intell. Neurosci. 2019, 5065214. https://doi.org/10.1155/2019/5065214 (2019).
Zhang, S. et al. A deep learning framework for modeling structural features of RNA-binding protein targets. Nucleic Acids Res. 44, e32. https://doi.org/10.1093/nar/gkv1025 (2016).
Maurício, J., Domingues, I. & Bernardino, J. Comparing vision transformers and convolutional neural networks for image classification: A literature review. Appl. Sci. 13, 5521. https://doi.org/10.3390/app13095521 (2023).
Dosovitskiy, A. et al. An image is worth 16x16 words: Transformers for image recognition at scale. arXiv preprint arXiv:2010.11929. https://doi.org/10.48550/arXiv.2010.11929 (2020).
Carion, N. et al. End-to-end object detection with transformers. Computer Vision-ECCV 2020 (Springer), pp. 213–229. https://doi.org/10.1007/978-3-030-58452-8_13 (2020).
Lv, W. et al. DETRs beat YOLOs on real-time object detection. arXiv preprint arXiv:2304.08069. https://doi.org/10.48550/arXiv.2304.08069 (2023).
Sun, Y. et al. Retentive network: A successor to transformer for large language models. arXiv preprint arXiv:2307.08621. https://doi.org/10.48550/arXiv.2307.08621 (2023).
Zhou, D.-X. Universality of deep convolutional neural networks. Appl. Comput. Harmonic Anal. 48, 787–794. https://doi.org/10.1016/j.acha.2019.06.004 (2020).
Chiyuan, Z., Bengio, S., Hardt, M., Recht, B. & Vinyals, O. Understanding deep learning (still) requires rethinking generalization. Commun. ACM 64, 107–115. https://doi.org/10.1145/3446776 (2021).
Ma, W., Papadakis, M., Tsakmalis, A., Cordy, M. & Traon, Y. L. Test selection for deep learning systems. ACM Trans. Softw. Eng. Methodol. 30, 13. https://doi.org/10.1145/3417330 (2021).
Liu, Z., Michaud, E. J. & Tegmark, M. Omnigrok: grokking beyond algorithmic data. arXiv preprint arXiv:2210.01117. https://doi.org/10.48550/arXiv.2210.01117 (2022).
Power, A., Burda, Y., Edwards, H., Babuschkin, I. & Misra, V. Grokking: generalization beyond overfitting on small algorithmic datasets. arXiv preprint arXiv:2201.02177. https://doi.org/10.48550/arXiv.2201.02177 (2022).
Simonyan, K., Vedaldi, A. & Zisserman, A. Deep inside convolutional networks: Visualising image classification models and saliency maps. arXiv preprint arXiv:1312.6034. https://doi.org/10.48550/arXiv.1312.6034 (2013).
Kim, Y. Convolutional neural networks for sentence classification. arXiv preprint arXiv:1408.5882. https://doi.org/10.48550/arXiv.1408.5882 (2014).
Abdel-Hamid, O. et al. Convolutional neural networks for speech recognition. IEEE/ACM Trans. Audio Speech Lang. Process. 22, 1533–1545. https://doi.org/10.1109/TASLP.2014.2339736 (2014).
Hatami, N., Gavet, Y. & Debayle, J. Classification of time-series images using deep convolutional neural networks. in Proceedings Tenth International Conference on Machine Vision (ICMV 2017) 10696, 106960Y. https://doi.org/10.1117/12.2309486 (2018).
Smith, M. A. et al. Molecular barcoding of native RNAs using nanopore sequencing and deep learning. Genome Res. 30, 1345–1353. https://doi.org/10.1101/gr.260836.120 (2020).
Emek Soylu, B. et al. Deep-Learning-based approaches for semantic segmentation of natural scene images: A review. Electronics 12, 2730. https://doi.org/10.3390/electronics12122730 (2023).
Hosseini, H., Xiao, B., Jaiswal, M. & Poovendran, R. On the limitation of Convolutional Neural Networks in recognizing negative images. in 16th IEEE International Conference on Machine Learning and Applications, pp. 352–358. https://ieeexplore.ieee.org/document/8260656 (2017).
Montserrat, D. M., Lin, Q., Allebach, J. & Delp, E. J. Training object detection and recognition CNN models using data augmentation. Electron. Imaging 2017, 27–36. https://doi.org/10.2352/ISSN.2470-1173.2017.10.IMAWM-163 (2017).
Cubuk, E. D., Zoph, B., Mane, D., Vasudevan, V. & Le, Q. V. Autoaugment: learning augmentation policies from data. arXiv preprint arXiv:1805.09501. https://doi.org/10.48550/arXiv.1805.09501 (2018).
Hataya, R., Zdenek, J., Yoshizoe, K. & Nakayama, H. Faster AutoAugment: Learning augmentation strategies using backpropagation, in Computer Vision–ECCV 2020: 16th European Conference, Proceedings, Part XXV, pp. 1–16 (Springer). https://doi.org/10.1007/978-3-030-58595-2_1 (2020).
Xiao, K., Engstrom, L., Ilyas, A. & Madry, A. Noise or signal: the role of image backgrounds in object recognition. arXiv preprint arXiv:2006.09994. https://doi.org/10.48550/arXiv.2006.09994 (2020).
Kovalerchuk, B., Kalla, D. C. & Agarwal, B., Deep learning image recognition for non-images, in Integrating artificial intelligence and visualization for visual knowledge discovery (eds. Kovalerchuk, B., et al.) pp. 63–100 (Springer). https://doi.org/10.1007/978-3-030-93119-3_3 (2022).
Samek, W., Binder, A., Montavon, G., Lapuschkin, S. & Muller, K. R. Evaluating the visualization of what a deep neural network has learned. IEEE Trans. Neural Netw. Learn. Syst. 28, 2660–2673. https://doi.org/10.1109/tnnls.2016.2599820 (2017).
Montavon, G., Samek, W. & Müller, K.-R. Methods for interpreting and understanding deep neural networks. Digital Signal Process. 73, 1–15. https://doi.org/10.1016/j.dsp.2017.10.011 (2018).
De Cesarei, A., Cavicchi, S., Cristadoro, G. & Lippi, M. Do humans and deep convolutional neural networks use visual information similarly for the categorization of natural scenes?. Cognit. Sci. 45, e13009. https://doi.org/10.1111/cogs.13009 (2021).
Kindermans, P.-J. et al. The (un) reliability of saliency methods, in Explainable AI: Interpreting, explaining and visualizing deep learning. Lecture Notes in Computer Science 11700, pp. 267–280 (Springer). https://doi.org/10.1007/978-3-030-28954-6_14 (2019).
Zeiler, M. D. & Fergus, R. Visualizing and understanding convolutional networks. Computer Vision—ECCV 2014, pp. 818–833 (Fleet, D., Pajdla T., Schiele, B., & Tuytelaars, T., eds) (Springer). https://doi.org/10.1007/978-3-319-10590-1_53 (2014).
Springenberg, J. T., Dosovitskiy, A., Brox, T. & Riedmiller, M. Striving for simplicity: The all convolutional net. arXiv preprint arXiv:1412.6806. https://doi.org/10.48550/arXiv.1412.6806 (2014).
Binder, A., Montavon, G., Lapuschkin, S., Müller, K.-R. & Samek, W. Layer-wise relevance propagation for neural networks with local renormalization layers, in Artificial Neural Networks and Machine Learning–ICANN 2016: Proceedings 25th International Conference on Artificial Neural Networks, pp. 63–71 (Springer). https://doi.org/10.1007/978-3-319-44781-0_8 (2016).
Selvaraju, R. R. et al. Grad-cam: visual explanations from deep networks via gradient-based localization. Proceedings of the 2017 IEEE international conference on computer vision, pp. 618–626. https://ieeexplore.ieee.org/document/8237336 (2017).
Sundararajan, M., Taly, A. & Yan, Q. (2017) Axiomatic attribution for deep networks. in Proceedings of the 34th International Conference on Machine Learning 70, 3319–3328. https://doi.org/10.5555/3305890.3306024.
Shrikumar, A., Greenside, P. & Kundaje, A. Learning important features through propagating activation differences. in Proceedings of the 34th International Conference on Machine Learning 70, 3145–3153. https://doi.org/10.5555/3305890.3306006 (2017).
Lundberg, S. M. & Lee, S.-I. A unified approach to interpreting model predictions. in Proceedings of the 31st International Conference on Machine Learning, pp. 4768–4777. https://doi.org/10.5555/3295222.3295230 (2017).
Ersavas, T. Deepmapper. https://github.com/tansel/deepmapper (2023).
Kokhlikyan, N. et al. Captum: A unified and generic model interpretability library for pytorch. arXiv preprint arXiv:2009.07896. https://doi.org/10.48550/arXiv.2009.07896 (2020).
Guyon, I. G. S. B.-H. A. & Dror, G. Gisette. UCI Machine Learning Repository. https://archive.ics.uci.edu/dataset/170/gisette (2008).
PyTorch, torch.rand. https://pytorch.org/docs/stable/generated/torch.rand.html (2023).
Sharma, A., Vans, E., Shigemizu, D., Boroevich, K. A. & Tsunoda, T. DeepInsight: A methodology to transform a non-image data to an image for convolution neural network architecture. Sci. Rep. 9, 11399. https://doi.org/10.1038/s41598-019-47765-6 (2019).
Sharma, A., Lysenko, A., Boroevich, K. A., Vans, E. & Tsunoda, T. DeepFeature: feature selection in nonimage data using convolutional neural network. Brief. Bioinform. 22, bbab297. https://doi.org/10.1093/bib/bbab297 (2021).
Simonyan, K. & Zisserman, A. Very deep convolutional networks for large-scale image recognition. arXiv preprint arXiv:1409.1556. https://doi.org/10.48550/arXiv.1409.1556 (2014).
Pytorch2, AdaptiveAvgPool2d. https://pytorch.org/docs/stable/generated/torch.nn.AdaptiveAvgPool2d.html (2023).
Acknowledgements
We thank Murat Karaorman, Mitchell Cummins, and Fatemeh Vafaee for helpful advice and comments on the manuscript. This research is supported by an Australian Government Research Training Program Scholarships RSAI8000 and RSAP1000 to T.E., a Fonds de Recherche du Quebec Santé Junior 1 Award 284217 to M.A.S., and UNSW SHARP Grant RG193211 to J.S.M.
Author information
Authors and Affiliations
Contributions
T.E. developed the methods, implemented DeepMapper and produced the first draft of the paper. J.S.M. provided advice, structured the paper, and edited it for improved readability and clarity. M.A.S. provided advice and edited the paper.
Corresponding authors
Ethics declarations
Competing interests
The authors declare no competing interests.
Additional information
Publisher's note
Springer Nature remains neutral with regard to jurisdictional claims in published maps and institutional affiliations.
Rights and permissions
Open Access This article is licensed under a Creative Commons Attribution 4.0 International License, which permits use, sharing, adaptation, distribution and reproduction in any medium or format, as long as you give appropriate credit to the original author(s) and the source, provide a link to the Creative Commons licence, and indicate if changes were made. The images or other third party material in this article are included in the article's Creative Commons licence, unless indicated otherwise in a credit line to the material. If material is not included in the article's Creative Commons licence and your intended use is not permitted by statutory regulation or exceeds the permitted use, you will need to obtain permission directly from the copyright holder. To view a copy of this licence, visit http://creativecommons.org/licenses/by/4.0/.
About this article

Cite this article
Ersavas, T., Smith, M.A. & Mattick, J.S. Novel applications of Convolutional Neural Networks in the age of Transformers. Sci Rep 14, 10000 (2024). https://doi.org/10.1038/s41598-024-60709-z
Received:
Accepted:
Published:
DOI: https://doi.org/10.1038/s41598-024-60709-z
Comments
By submitting a comment you agree to abide by our Terms and Community Guidelines. If you find something abusive or that does not comply with our terms or guidelines please flag it as inappropriate.
