Abstract
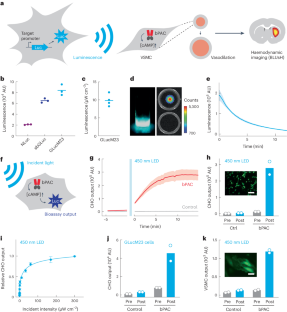
Bioluminescent probes are widely used to monitor biomedically relevant processes and cellular targets in living animals. However, the absorption and scattering of visible light by tissue drastically limit the depth and resolution of the detection of luminescence. Here we show that bioluminescent sources can be detected with magnetic resonance imaging by leveraging the light-mediated activation of vascular cells expressing a photosensitive bacterial enzyme that causes the conversion of bioluminescent emission into local changes in haemodynamic contrast. In the brains of rats with photosensitized vasculature, we used magnetic resonance imaging to volumetrically map bioluminescent xenografts and cell populations virally transduced to express luciferase. Detecting bioluminescence-induced haemodynamic signals from photosensitized vasculature will extend the applications of bioluminescent probes.
This is a preview of subscription content, access via your institution
Access options
Access Nature and 54 other Nature Portfolio journals
Get Nature+, our best-value online-access subscription
$29.99 / 30 days
cancel any time
Subscribe to this journal
Receive 12 digital issues and online access to articles
$99.00 per year
only $8.25 per issue
Buy this article
- Purchase on Springer Link
- Instant access to full article PDF
Prices may be subject to local taxes which are calculated during checkout


Data availability
The main data supporting the results in this study are available within the paper and its Supplementary Information. The MRI atlas used for this study was downloaded from NITRC via https://www.nitrc.org/projects/whs-sd-atlas (ref. 55). The raw and analysed datasets generated during the study are available for research purposes from the corresponding author on reasonable request. Source data are provided with this paper.
References
Yeh, H. W. & Ai, H. W. Development and applications of bioluminescent and chemiluminescent reporters and biosensors. Annu. Rev. Anal. Chem. 12, 129–150 (2019).
Liu, S., Su, Y., Lin, M. Z. & Ronald, J. A. Brightening up biology: advances in luciferase systems for in vivo imaging. ACS Chem. Biol. 16, 2707–2718 (2021).
Dothager, R. S. et al. Advances in bioluminescence imaging of live animal models. Curr. Opin. Biotechnol. 20, 45–53 (2009).
Tung, J. K., Berglund, K., Gutekunst, C. A., Hochgeschwender, U. & Gross, R. E. Bioluminescence imaging in live cells and animals. Neurophotonics 3, 025001 (2016).
Tian, X. et al. A luciferase prosubstrate and a red bioluminescent calcium indicator for imaging neuronal activity in mice. Nat. Commun. 13, 3967 (2022).
Wang, G., Li, Y. & Jiang, M. Uniqueness theorems in bioluminescence tomography. Med. Phys. 31, 2289–2299 (2004).
Gu, X., Zhang, Q., Larcom, L. & Jiang, H. Three-dimensional bioluminescence tomography with model-based reconstruction. Opt. Express 12, 3996–4000 (2004).
Tu, C. & Louie, A.Y. Photochromically-controlled, reversibly-activated MRI and optical contrast agent. Chem. Commun. 13, 1331–1333 (2007).
Osborne, E. A., Jarrett, B. R., Tu, C. & Louie, A. Y. Modulation of T2 relaxation time by light-induced, reversible aggregation of magnetic nanoparticles. J. Am. Chem. Soc. 132, 5934–5935 (2010).
Venkataramani, S. et al. Magnetic bistability of molecules in homogeneous solution at room temperature. Science 331, 445–448 (2011).
Hai, A., Spanoudaki, V. C., Bartelle, B. B. & Jasanoff, A. Wireless resonant circuits for the minimally invasive sensing of biophysical processes in magnetic resonance imaging. Nat. Biomed. Eng. 3, 69–78 (2019).
Reessing, F. et al. A light-responsive liposomal agent for MRI contrast enhancement and monitoring of cargo delivery. Chem. Commun. 55, 10784–10787 (2019).
Simon, J., Schwalm, M., Morstein, J., Trauner, D. & Jasanoff, A. Mapping light distribution in tissue by using MRI-detectable photosensitive liposomes. Nat. Biomed. Eng. 7, 313–322 (2023).
Ohlendorf, R. et al. Target-responsive vasoactive probes for ultrasensitive molecular imaging. Nat. Commun. 11, 2399 (2020).
Desai, M., Slusarczyk, A. L., Chapin, A., Barch, M. & Jasanoff, A. Molecular imaging with engineered physiology. Nat. Commun. 7, 13607 (2016).
Desai, M. et al. Hemodynamic molecular imaging of tumor-associated enzyme activity in the living brain. eLife 10, e70237 (2021).
Ghosh, S. et al. Functional dissection of neural circuitry using a genetic reporter for fMRI. Nat. Neurosci. 25, 390–398 (2022).
Ji, X. et al. Brain microvasculature has a common topology with local differences in geometry that match metabolic load. Neuron 109, 1168–1187.e13 (2021).
Farhadi, A., Sigmund, F., Westmeyer, G. G. & Shapiro, M. G. Genetically encodable materials for non-invasive biological imaging. Nat. Mater. 20, 585–592 (2021).
Attwell, D. et al. Glial and neuronal control of brain blood flow. Nature 468, 232–243 (2010).
Walsh, M. P. & Cole, W. C. The role of actin filament dynamics in the myogenic response of cerebral resistance arteries. J. Cereb. Blood Flow Metab. 33, 1–12 (2013).
Hillman, E. M. Coupling mechanism and significance of the BOLD signal: a status report. Annu. Rev. Neurosci. 37, 161–181 (2014).
Stierl, M. et al. Light modulation of cellular cAMP by a small bacterial photoactivated adenylyl cyclase, bPAC, of the soil bacterium Beggiatoa. J. Biol. Chem. 286, 1181–1188 (2011).
Berglund, K. et al. Combined optogenetic and chemogenetic control of neurons. Methods Mol. Biol. 1408, 207–225 (2016).
Hall, M. P. et al. Engineered luciferase reporter from a deep sea shrimp utilizing a novel imidazopyrazinone substrate. ACS Chem. Biol. 7, 1848–1857 (2012).
Park, S. Y. et al. Novel luciferase-opsin combinations for improved luminopsins. J. Neurosci. Res. 98, 410–421 (2020).
Stuven, B. et al. Characterization and engineering of photoactivated adenylyl cyclases. Biol. Chem. 400, 429–441 (2019).
Moessler, H. et al. The SM 22 promoter directs tissue-specific expression in arterial but not in venous or visceral smooth muscle cells in transgenic mice. Development 122, 2415–2425 (1996).
Chakraborty, R. et al. Promoters to study vascular smooth muscle. Arterioscler. Thromb. Vasc. Biol. 39, 603–612 (2019).
Deverman, B. E. et al. Cre-dependent selection yields AAV variants for widespread gene transfer to the adult brain. Nat. Biotechnol. 34, 204–209 (2016).
Han, S., Son, J. P., Cho, H., Park, J. Y. & Kim, S. G. Gradient-echo and spin-echo blood oxygenation level-dependent functional MRI at ultrahigh fields of 9.4 and 15.2 tesla. Magn. Reson. Med. 81, 1237–1246 (2019).
Grandjean, J. et al. A consensus protocol for functional connectivity analysis in the rat brain. Nat. Neurosci. 26, 673–681 (2023).
Abe, Y. et al. Optical manipulation of local cerebral blood flow in the deep brain of freely moving mice. Cell Rep. 36, 109427 (2021).
Iwano, S. et al. Single-cell bioluminescence imaging of deep tissue in freely moving animals. Science 359, 935–939 (2018).
Wang, A., Feng, J., Li, Y. & Zou, P. Beyond fluorescent proteins: hybrid and bioluminescent indicators for imaging neural activities. ACS Chem. Neurosci. 9, 639–650 (2018).
Ntziachristos, V. Going deeper than microscopy: the optical imaging frontier in biology. Nat. Methods 7, 603–614 (2010).
Wiesner, H. M. et al. Quantitative and simultaneous measurement of oxygen consumption rates in rat brain and skeletal muscle using 17O MRS imaging at 16.4T. Magn. Reson. Med. 85, 2232–2246 (2021).
Ueda, H. R. et al. Tissue clearing and its applications in neuroscience. Nat. Rev. Neurosci. 21, 61–79 (2020).
Bedbrook, C. N., Deverman, B. E. & Gradinaru, V. Viral strategies for targeting the central and peripheral nervous systems. Annu. Rev. Neurosci. 41, 323–348 (2018).
Rost, B. R., Schneider-Warme, F., Schmitz, D. & Hegemann, P. Optogenetic tools for subcellular applications in neuroscience. Neuron 96, 572–603 (2017).
Yu, X. et al. Sensory and optogenetically driven single-vessel fMRI. Nat. Methods 13, 337–340 (2016).
Renaudin, N. et al. Functional ultrasound localization microscopy reveals brain-wide neurovascular activity on a microscopic scale. Nat. Methods 19, 1004–1012 (2022).
Zhu, X. et al. Real-time whole-brain imaging of hemodynamics and oxygenation at micro-vessel resolution with ultrafast wide-field photoacoustic microscopy. Light. Sci. Appl. 11, 138 (2022).
Zambito, G., Chawda, C. & Mezzanotte, L. Emerging tools for bioluminescence imaging. Curr. Opin. Chem. Biol. 63, 86–94 (2021).
Belliveau, J. W. et al. Functional cerebral imaging by susceptibility-contrast NMR. Magn. Reson. Med. 14, 538–546 (1990).
Williams, D. S., Detre, J. A., Leigh, J. S. & Koretsky, A. P. Magnetic resonance imaging of perfusion using spin inversion of arterial water. Proc. Natl Acad. Sci. USA 89, 212–216 (1992).
Mace, E. et al. Functional ultrasound imaging of the brain. Nat. Methods 8, 662–664 (2011).
Wang, L. V. & Hu, S. Photoacoustic tomography: in vivo imaging from organelles to organs. Science 335, 1458–1462 (2012).
Hayasaka, N. et al. In vivo diagnostic imaging using micro-CT: sequential and comparative evaluation of rodent models for hepatic/brain ischemia and stroke. PLoS ONE 7, e32342 (2012).
Starosolski, Z. et al. Ultra high-resolution in vivo computed tomography imaging of mouse cerebrovasculature using a long circulating blood pool contrast agent. Sci. Rep. 5, 10178 (2015).
Engler, C., Kandzia, R. & Marillonnet, S. A one pot, one step, precision cloning method with high throughput capability. PLoS ONE 3, e3647 (2008).
Fan, F. et al. Novel genetically encoded biosensors using firefly luciferase. ACS Chem. Biol. 3, 346–351 (2008).
Holtwick, R. et al. Smooth muscle-selective deletion of guanylyl cyclase-A prevents the acute but not chronic effects of ANP on blood pressure. Proc. Natl Acad. Sci. USA 99, 7142–7147 (2002).
Cox, R. W. AFNI: software for analysis and visualization of functional magnetic resonance neuroimages. Comput. Biomed. Res. 29, 162–173 (1996).
Papp, E. A., Leergaard, T. B., Calabrese, E., Johnson, G. A. & Bjaalie, J. G. Waxholm Space atlas of the Sprague Dawley rat brain. Neuroimage 97, 374–386 (2014).
Acknowledgements
We acknowledge grants to A.J. from the National Institutes of Health (UG3 MH126868, U01 EB031641, R21 EY032369 and R01 NS121073) and the G. Harold and Leila Y. Mathers Foundation. We also gratefully acknowledge research funding from L. McGovern, G. Hendrie and B. Fikes. R.O. was funded by a fellowship from the Deutsche Forschungsgemeinschaft. M.S. was funded by a Marie Skłodowska-Curie fellowship from the European Union. Y.K. was supported by a Y. Eva Tan Fellowship, and Y.J. was supported by a J. Douglas Tan Fellowship, both from the McGovern Institute for Brain Research. A. Becker and K. Backman are thanked for technical support.
Author information
Authors and Affiliations
Contributions
R.O. and A.J. designed the BLUsH principle. R.O. performed most of the in vitro experiments. N.L. and R.O. performed the in vivo MRI experiments with contributions from V.D.P.V., M.S., M.D. and W.T.Z. R.O., V.D.P.V., Y.K. and B.S. performed histology analyses. Y.K. and Y.J. performed the BLI experiments. S.D. performed the in vitro CTZ titration. N.L., R.O. and A.J. analysed the imaging data. R.O., N.L. and A.J. wrote the paper.
Corresponding author
Ethics declarations
Competing interests
The authors declare no competing interests.
Peer review
Peer review information
Nature Biomedical Engineering thanks Ge Wang and the other, anonymous, reviewer(s) for their contribution to the peer review of this work.
Additional information
Publisher’s note Springer Nature remains neutral with regard to jurisdictional claims in published maps and institutional affiliations.
Extended data
Extended Data Fig. 1 Vascular expression of bPAC.
(a) Expression of bPAC (red, left) in two fields of view (top and bottom), compared with the tomato lectin vascular stain (green, right) in two fields of view from a different animal, showing similarity of labeled features as in Fig. 2b. Scale bar = 200 µm. (b) Images showing bPAC expression in individual cells spaced along individual vessels, analogous to Fig. 2c. Scale bars = 100 µm (top) and 200 µm (bottom).
Extended Data Fig. 2 Brain-wide vascular expression of bPAC in transgenic mouse.
(a) Immunohistochemical visualization of bPAC expression in a coronal slice from a representative SM22α-Cre transgenic mouse infected with a Cre-activated bPAC vector, showing strong and homogeneous labeling of brain-wide vasculature in the slice. Scale bar = 1 mm. (b) Close-up of the boxed region in a. Scale bar = 1 mm. (c) Close-up of the boxed region in b. Scale bar = 100 µm.
Extended Data Fig. 3 Analysis of nitrotyrosine accumulation.
Nitrotyrosine (NitroY) staining (blue, left) was performed to examine whether elevations of this marker colocalize with bPAC expression (red, middle) in virally transduced rat brain regions. Merged image is shown at right. Scale bars = 1 mm (top) and 500 µm (bottom).
Extended Data Fig. 4 Microglial staining in bPAC-expressing tissue.
Comparison of bPAC expression profile (top) with distribution of the microglial marker Iba1 (middle) and overlay (bottom), showing absence of clear microglial activation in bPAC-rich areas in a representative BLUsH-treated brain hemisphere. Panels at right represent enlargements of the dashed areas in the panels at left. Areas 1 and 2 were chosen to be regions with and without substantial bPAC expression, respectively. Scale bars = 1 mm (left) or 500 µm (right).
Extended Data Fig. 5 Raw time series data during light stimulation.
Individual image frames from an experiment as in Fig. 2d, showing raw MRI scans (top) and signal changes from baseline (bottom) at time points (t) relative to the beginning of the experiment, denoted in minutes below each frame. Grey scales denote arbitrary intensity units (AU, top) or percent signal change (%SC, bottom). The onset of signal changes coincident with bilateral LED illumination (blue bar) is indicated by the yellow arrowheads.
Extended Data Fig. 6 BLI of luciferase-expressing xenografts.
(a) BLI signal (color) and reflectance images (grayscale) of individual rats implanted with bioluminescent xenografts prepared and implanted as for the experiments of Fig. 3. The implant in the left animal expressed GLucM23, as in Fig. 3, while the implant in the rat on the right expressed Akaluc, a red-shifted luciferase. (b) FWHM of luminescence signals measured by BLI (closed purple circles = GLucM23, open purple circles = Akaluc), compared with values measured by MRI-based BLUsH (red circles). Horizontal lines denote means for BLI and BLUsH data points. The difference between BLI and BLUsH size measurements is significant with t-test p = 0.01, n = 4, 5.
Extended Data Fig. 7 BLUsH responses to repeated CTZ administration.
(a) Snapshots of the responses to three doses of CTZ infused over a luciferase-expressing cell pellet in a single animal, following the experimental paradigm of Fig. 3. CTZ was injected in 2.5-min epochs (blue shading at top), separated by 10 minute intertrial intervals. Timing with respect to infusion start is denoted at top. (b) Time courses of MRI signal change observed in ROIs defined around the cell pellet. Labeled traces denote CTZ injection trials 1, 2, and 3, and the infusion periods are denoted by blue shading. (c) Maps of mean response amplitude (5 min following CTZ start) and recovery amplitude (8 min after CTZ infusion end) averaged over the three CTZ infusion trials in an ROI around the luminescent xenograft.
Extended Data Fig. 8 Raw time series data following intravenous CTZ delivery.
Individual image frames from an experiment as in Fig. 4a, showing raw MRI scans (top) and signal changes from baseline (bottom) at time points (t) relative to the signal peak time (red bar), denoted in minutes below each frame. Grey scales denote arbitrary intensity units (AU, top) or percent signal change (%SC, bottom). The location and timing of the peak BLUsH response in this experiment is indicated by the yellow arrowhead.
Extended Data Fig. 9 BLUsH and control imaging of virally driven luciferase expression.
(a) Imaging data from five rats that underwent BLUsH imaging of AAV-driven GLucM23 expression following intravenous CTZ delivery in the experiments of Fig. 4. Data are shown over six coronal slices with bregma coordinates noted in yellow at top. (b) Corresponding MRI data obtained from three control virus-treated animals that also express GLucM23 following AAV infection.
Extended Data Fig. 10 Extended histology data from BLUsH and control experiments.
(a) Data corresponding to Fig. 4d, showing BLUsH MRI maps (left), GLucM23 staining (blue), bPAC staining (red), and merged images for three individual rats examined by postmortem histology. (b) Analogous MRI and histology data from three animals that received control viruses in place of BLUsH components. The control treatment results in vascular tdTomato expression (red) in place of bPAC. AAV-directed GLucM23 delivery is identical between BLUsH and control animals and results in robust expression (blue) without corresponding MRI signal changes (left).
Supplementary information
Supplementary Information
Supplementary figures.
Source data
Source Data Fig. 1
Source data.
Source Data Fig. 2
Source data.
Source Data Fig. 3
Source data.
Source Data Fig. 4
Source data.
Rights and permissions
Springer Nature or its licensor (e.g. a society or other partner) holds exclusive rights to this article under a publishing agreement with the author(s) or other rightsholder(s); author self-archiving of the accepted manuscript version of this article is solely governed by the terms of such publishing agreement and applicable law.
About this article
Cite this article
Ohlendorf, R., Li, N., Phi Van, V.D. et al. Imaging bioluminescence by detecting localized haemodynamic contrast from photosensitized vasculature. Nat. Biomed. Eng (2024). https://doi.org/10.1038/s41551-024-01210-w
Received:
Accepted:
Published:
DOI: https://doi.org/10.1038/s41551-024-01210-w


