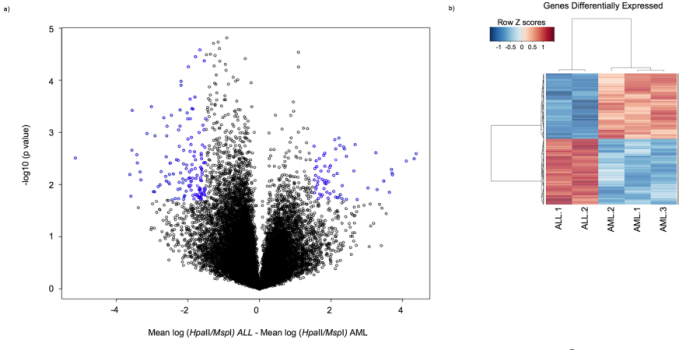
DNA methylation data can classify different types of cancer
(A) This graph shows the differential methylation of genes between the two types of cancer explored in this experiment: AML and ALL. Data from two ALL and three AML patients are shown. (B) A 'heatmap' shows genes that had a decrease in expression (blue) and an increase in expression (red). Each row represents expression of a different gene.
This image is linked to the following World Library of Science pages:
Identical twins often develop different characteristics, even though they carry the same sequence of DNA nucleotides. How can this be? The answer lies in epigenomics.