


« Prev Next »

The Variety of Genes in the Gene Pool Can Be Quantified within a Population

Most populations have some degree of variation in their gene pools. By measuring the amount of genetic variation in a population, scientists can begin to make predictions about how genetic variation changes over time. These predictions can then help them gain important insights into the processes that allow organisms to adapt to their environment or to develop into new species over generations, also known as the process of evolution.
Genetic variation is usually expressed as a relative frequency, which means a proportion of the total population under study. In other words, a relative frequency value represents the percentage of a given phenotype, genotype, or allele within a population.
Relative phenotype frequency is the number of individuals in a population that have a specific observable trait or phenotype. To compare different phenotype frequencies, the relative phenotype frequency for each phenotype can be calculated by counting the number of times a particular phenotype appears in a population and dividing it by the total number of individuals in the population.
Relative genotype
frequency and relative allele
frequency are the most important measures of genetic variation. Relative genotype
frequency is the percentage of individuals in a population that have a specific
genotype. The relative genotype frequencies show the distribution of genetic variation in a
population. Relative allele frequency is the percentage of all copies of a certain gene
in a population that carry a specific allele. This is an accurate measurement of the amount
of genetic variation in a population.
Examining allele frequencies
A gene that can occur in two forms is said to have two alleles. Body color in fruit flies is an example of a gene with two alleles: a dominant allele for brown body color, and a recessive allele for black body color. The brown body color allele can be represented as "B" and the black body color allele as "b." The allele frequencies for a gene with two alleles are usually represented by the letters p and q, where the relative frequency of the B allele is p and the relative frequency of the b allele is q.
Symbolically, these relative allele frequencies can be represented as:
relative frequency (B) = p and relative frequency (b) = q
Remember the Punnett square?
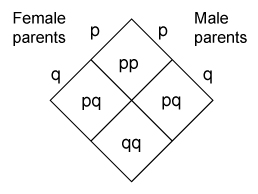
If B and b are the only two alleles of a gene, then possible genotypes can be predicted by arranging the alleles in a Punnett square, in their p and q representation (Figure 1). This exercise can help to visualize the computation of relative allele frequencies and their corresponding relative genotype frequencies in a population.
The possible combinations can be represented mathematically as:
[p × p] + [2 × p × q] + [q × q]
or
p2 + 2pq + q2
How can relative frequencies be used to study populations?
The mathematical expression p2 + 2pq + q2 can be used as a platform for understanding both allele frequencies and genotype frequencies in real populations. For instance, if a population does not change over time, then scientists can make certain predictions about its relative allele frequencies, and about its relative genotype frequencies. In other words, if they have information about its relative genotype frequencies, they may also make predictions about its relative allele frequencies.
When a population is in equilibrium, the BB homozygotes (individuals that carry the same two dominant B alleles) will have a relative genotype frequency of p2: freq (BB) = p2. Similarly, bb homozygotes (individuals that carry the same two recessive b alleles) will have a relative genotype frequency of q2: freq (bb) = q2. Finally, the Bb heterozygotes (individuals that carry both the dominant B allele and the recessive b allele) will have a relative genotype frequency of 2pq: freq (Bb) = 2pq.
In a stable population, the sum of all these relative genotype frequencies remains equal to 1 over successive generations. This is a mathematical way of expressing that the sum of all relative genotype frequencies always equals 1 because if one relative genotype frequency increases, another will decrease in tandem, and alleles become redistributed rather than increasing in proportion to the population. Therefore, this relationship can be expressed mathematically as follows:
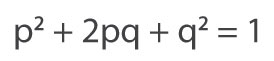
This equation is known as the Hardy-Weinberg equation, and it defines a population in which relative allele frequencies do not change over successive generations. Such a population is said to be in equilibrium. This state of equilibrium represented by the Hardy-Weinberg equation is an ideal model against which to compare observed changes in relative allele and genotype frequencies in natural populations.
How is the Hardy-Weinberg equation used?
The Hardy-Weinberg equation describes a population at equilibrium. This can only occur in the absence of disturbing factors and when mating between individuals is completely random. When mating is random in a large population, both the relative genotype and allele frequencies will remain constant.
Hardy-Weinberg equilibrium in a population can be disturbed by a number of forces, including mutations, nonrandom mating, migration and genetic drift (random changes in alleles from one generation to the next). These forces drive evolutionary change because they add to or take away from the relative allele frequencies in a population. For instance, mutations can disrupt the equilibrium of relative allele frequencies by introducing new alleles into a population. Nonrandom mating can influence relative genotype frequencies within the mating group, because mate choice of the parents can cause a bias toward certain combinations of alleles among their progeny. Migration causes a phenomenon called gene flow that occurs when breeding between two populations leads to the transfer of alleles into a new population, thereby altering the equilibrium of relative allele frequencies. Genetic drift, which typically occurs at a higher rate in small populations, takes place when relative allele frequencies increase or decrease by chance.
Since all of these disruptive forces commonly occur in nature, the Hardy-Weinberg equilibrium rarely stays constant. Typically, populations can exist in equilibrium for short periods of time, but rarely stay there in perpetuity. Therefore, Hardy-Weinberg equilibrium describes an idealized state of a population, and genetic variations in nature can be measured as changes from this ideal. The Hardy-Weinberg equation is therefore a tool for measuring real genetic variation in a population over time.
This is just one model
A population at Hardy-Weinberg equilibrium exhibits constant relative allele and genotype frequencies over successive generations. However,
the converse is not necessarily true: a population that exhibits stable relative allele and
genotype frequencies over time may not be in Hardy-Weinberg equilibrium. For
example, if the heterozygous genotype provides an advantage (e.g. allows
individuals to mate more successfully or provides resistance to disease), it
will remain prevalent in the population, yet it will not occur in the proportion predicted by
the Hardy-Weinberg equation.
Further Exploration
Key Questions
eBooks
This page appears in the following eBook


